Influence of bed surface structure on bedload transport in mountain rivers
Abstract
Mountain rivers are characterized by wide grain size distributions and complex bed surface structures, which significantly affect bedload transport. Owing to the lack of a clear understanding of the quantitative influence of the bed surface structure on the bedload transport rate, existing methods for estimating the bedload transport rate in mountain rivers produce large errors. Based on theoretical analysis and flume experiments, this study reveals the influence of bed surface structure on nonuniform bedload transport and proposes a method for estimating bedload transport rate considering the quantitative influence of bed surface structure. The findings of the present study provide theoretical methodological support for predicting the sediment transport and bed evolution in mountain rivers.
1 INTRODUCTION
Bedload transport rate is an important parameter for predicting the sediment load and riverbed evolution, and its study is greatly significant for river science and engineering (ASCE, 2006; Li et al., 2021). Over the past few decades, extensive studies have been conducted on bedload transport.
Most of the early studies on bedload transport were conducted using uniform sand, and a series of classical bedload transport theories and calculation methods were proposed. Shields (1936) proposed a criterion for the incipient motion of sediment using dimensional analysis. Meyer-Peter and Müller (1948) established a formula for the bedload transport rate of uniform sediment based on dimensional analysis and a large amount of flume test data. Einstein (1950) established the theory of bedload transport based on hydrodynamics and statistics for the first time using the random theory of sediment movement. Dou (1960) studied the critical velocity of sediment motion using statistical theory. Han (1984) used statistical methods to study sediment transport and established a statistical theoretical system for sediment movement. Bagnold (1966) first found the discrete force between particles using a rotating cylinder test and deduced a formula for the bedload transport rate of uniform sediment based on flow power. Based on the theories of Einstein (1950) and Bagnold (1966), Engelund and Fredsøe (1976) proposed a formula for the bedload transport rate of uniform sediment. Following the theory of Bagnold (1966), Van Rijn (1984) proposed a new equation for the bedload transport rate of uniform sediment. Based on a large amount of flume experimental data and the theory of Bagnold (1966), Ackers and White (1973) established a calculation method for the bedload transport rate for grain size greater than 2.5 mm. Yalin (1977) illuminated the mechanism of bedload transport based on power law and dimensional analysis.
However, natural rivers, especially mountain rivers, exhibit significant heterogeneity of sediment size and the temporal and spatial differences in sediment supply (Ferro, 2003; Papanicolaou et al., 2004). As sediment heterogeneity can considerably influence bedload transport, the existing bedload transport theory and calculation methods based on the assumption of uniform sediment cannot be directly applied to mountain rivers. The influence of sediment heterogeneity on bedload transport is primarily reflected in the riverbed structure: the varying combination of flow and sediment supply causes variations in the relative position and composition of bed sediment (i.e., bed surface structure, Fu et al., 2023) in mountain rivers, which significantly affects the bedload transport.
In the past decades, many studies have investigated the influence of bed surface structure on bedload transport. Based on flume tests, Iseya and Ikeda (1987) found that the fluctuation in bedload transport rate are primarily affected by changes in the bed surface structure and bed armouring. Gan et al. (2002) established a two-dimensional numerical model for the armouring process of a sandy riverbed based on the alternating direction implicit (ADI) algorithm, and verified their model by flume tests under clear-water scour conditions. Frey et al. (2003) found that the development of the bed surface structure blocks fine particles, reducing the instantaneous bed load transport rate; the destruction of the bed surface structure increases the capacity of flow to entrain the fine particles, increasing the instantaneous bedload transport rate sharply. Based on flume tests, Recking et al. (2009) and Luo et al. (2023) found that an increase in the riverbed slope changes the local riverbed morphological, destabilizing the coarse particles and increases the bedload transport rate significantly. Ghilardi et al. (2014) experimentally found that the formation of riverbed surface structure reduces the fluctuation intensity of bedload transport rate and that the fluctuation amplitude is related to the spatial density of the surface structure. Through conducting flume tests, Masteller and Finnegan (2017) found that the bedload transport rate is significantly related to the development of the bed surface structure. The field investigations of Golly et al. (2019) indicated that a smaller relative flow depth in mountain rivers makes the bed sediment less affected by the water flow; therefore, the morphological characteristics and stability of the surface structure mainly depend on the interaction between particles. Based on flume tests Zhang et al. (2020) found that the transport of fine particles changed bed surface structure continuously, and the bed surface structure was destroyed when those changes accumulated to a certain extent.
However, existing studies focused on the qualitative influence of bed surface structure on the movement of bedload. Up to the present, a clear understanding of the quantitative influence of bed surface structure on the bedload transport rate in mountain rivers is still lacking, which seriously restricts the prediction accuracy of bedload transport rate and bed evolution in mountain rivers. Based on flume tests and theoretical analysis, this study investigates the quantitative influence of bed surface structure on bedload transport in mountain rivers, and proposes a calculation method for the bedload transport rate considering the influence of surface structure. The findings of the present study improve the understanding of bedload transport in mountainous rivers, providing theoretical basis and methodological supports for predicting the sediment transport and bed evolution in mountain rivers.
2 THEORETICAL ANALYSIS
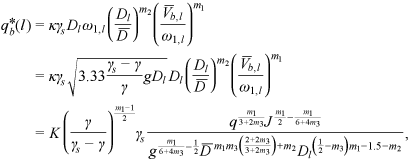 ()
() is mean diameter of sediment;
  is near-bed average velocity; K is the coefficient after conversion
  ; q is the discharge per unit width; J is the bed slope; m1, m2, m3 are coefficients such that m1 represents the influence of the nondimensional near-bed velocity, while m2 characterizes the sheltering effect between particles.
For uniform sediment, the sheltering effect between particles can be ignored (i.e., m2 = 0).
 ()
()
 ()
() ()
() ()
()3 EXPERIMENTAL SETUP
All experiments were conducted in a 10 m long, 0.39 m wide, and 0.4 m deep flume (Figure 2). The test reach was 7.5 m long. A honeycomb straightener composed of polyvinyl chloride pipes was installed at the flume inlet for energy dissipation to ensure unidirectional flow. A tail gate was installed at the flume outlet to control flow depth. The flume used a laboratory recirculating pump system to supply water. A 7.5 m long sediment layer (10 cm at the thinnest point) was laid 2.5 m downstream of the flume inlet. To stabilize the flow, large immobile cobbles (with grain size greater than 30 mm) were placed in the transitional reach between the flume inlet and the sediment bed. Flow discharge was controlled by an inlet valve and measured using a rectangular thin-plate weir placed before the flume inlet. A sediment trap immediately upstream of the tail gate was used to collect the sediment for reuse.
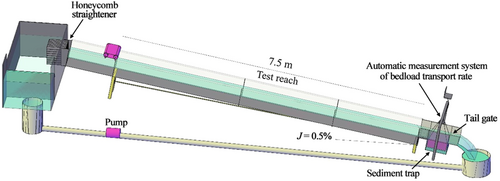
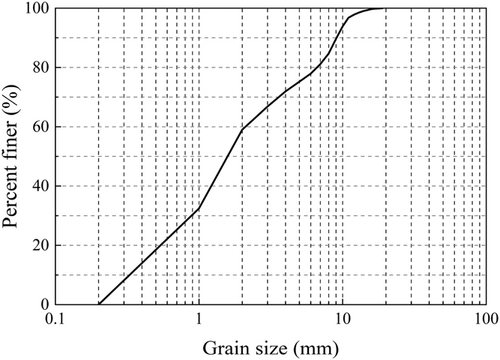
An automatic measurement system for bedload transport rate based on the weighing principle (Luo et al., 2023) was set up at the outlet of the flume (upstream of the tail gate) to continuously measure the cumulative bedload transport mass and bed load transport rate (the sampling interval was 1 min). The initial bed slope was 0.5%. The bed sediment grain sizes ranged from 0.2 to 19 mm, with d16 = 0.58 mm, d50 = 1.57 mm, d84 = 7.83 mm, dm = 3 mm, and geometric standard deviation σg = 3.14. The relative density of sediment was 2.65. The grain-size distribution of the experimental sediment is shown in Figure 3.
All experiments were conducted without upstream sediment supply to enable adjustment of bed surface structure. Eight tests were performed and test parameters are listed in Table 1. At the beginning of each test, the tail gate was closed and the inlet flow was slowly increased to fill the tank and prevent excessive erosion caused by overflow. The flume was slowly filled with a closed tail gate to prevent possible bed erosion. After reaching the desired discharge, the tail gate was opened to ensure a uniform flow to start the test. The duration for each test was 90 min. Rulers on the glass wall were used to measure the flow depth. After the end of each test, the sediment of the armor layer was removed and mixed with the sediment in the sediment trap to restore the initial bed surface.
| Test number | Q (L/s) | J (%) | h0 (mm) | t (min) |
|---|---|---|---|---|
| 1 | 19.9 | 0.5 | 80 | 90 |
| 2 | 24.6 | 0.5 | 90 | 90 |
| 3 | 31.3 | 0.5 | 115 | 90 |
| 4 | 32.5 | 0.5 | 115 | 90 |
| 5 | 37.6 | 0.5 | 121 | 90 |
| 6 | 39.9 | 0.5 | 135 | 90 |
| 7 | 42.2 | 0.5 | 146 | 90 |
| 8 | 51.6 | 0.5 | 167 | 90 |
4 RESULTS AND DISCUSSION
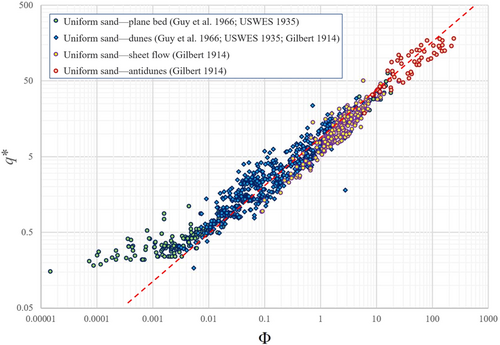
Figure 4 plots the nondimensional bedload transport rate Φ against the nondimensional flow discharge q* of the flume and field data from the present and existing studies. In Equation (5), β = 0 represents the absence of bed surface structure (i.e., uniform sediment), corresponding to the highest bedload transport capacity for a given flow intensity; β = 1 represents a fully developed bed surface structure, corresponding to the lowest bedload transport capacity for a given flow intensity. Therefore, Equation (5) with β = 0 and β = 1 should characterize the upper and lower envelopes of the data shown in Figure 4, respectively. Based on those envelopes, C = 10, k = 4 can be obtained.
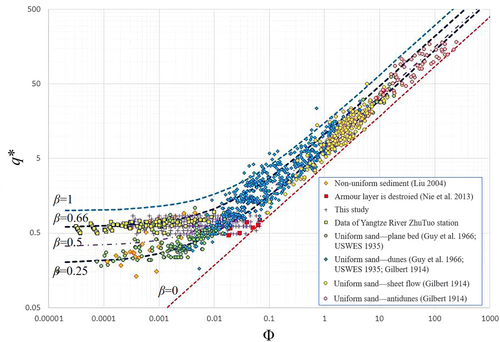
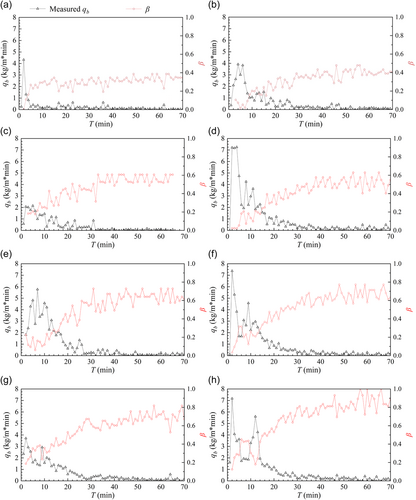
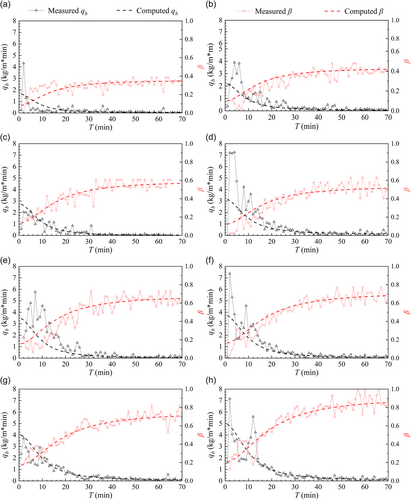
Figure 5 shows the temporal development of the bedload transport rate per unit width qb and bed surface structure parameter β under clear-water scour conditions, where β is determined using Equation (5) with C = 10, k = 4, known Φ and measured q*. Figure 5 indicates that for a given discharge, the bedload transport rate first increases rapidly and then gradually decreases with time. As no bedforms were observed during each test, it is reasonable to infer that the bedload transport rate variation is attributed to the development of the bed surface structure. As shown in Figure 5, β is the smallest at the initial stage of clear-water scouring. As the bed surface structure gradually develops, β gradually increases and tends to a constant.
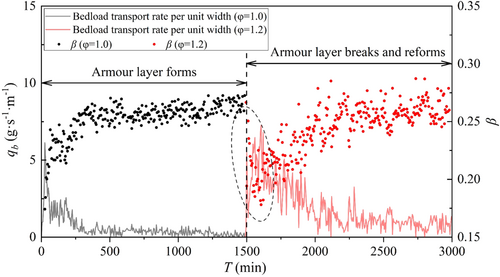
The bed surface structure generally adjust to varying sediment supply conditions through three distinct mechanisms: (1) In a river reach with a lack of sediment supply (e.g., downstream of a dam), the bed coarsens and the bed surface structure develops, increasing β to decrease the bedload transport rate (Figure 5); (2) A sufficient sediment supply causes bed fining, decreasing β to increase the bedload transport rate; (3) the break of an armor layer leads to rapid adjustment of the bed surface structure, reducing β to increase the bedload transport rate sharply in a short period. As depicted in Figure 6, when the normalized shear stress τ/τ0 reaches 1.2, the break of armor layer changes the bed surface structure (Wang et al., 2021) and reduces β, resulting in a rapid increase in bedload transport rate; consequently, as the armor layer reforms, β gradually increases to reduce bedload transport rate.
5 CALCULATION METHOD OF THE BED SURFACE STRUCTURE PARAMETER
The analysis in Section 4 shows that Equation (5) can reasonably characterize the quantitative influence of bed sediment heterogeneity on bedload transport rate if β can be determined. This section will propose a calculation method for β based on experimental results.
 as the time-averaged value of β in the last 20 min of the experiment. Figure 7 shows the dependence of
  on nondimensional flow intensity q* based on the flume data of the present study and Wang et al. (2021). Figure 7 indicates that for clear-water scour condition,
  increases linearly with increasing q* (coefficient of determination R2 = 0.99), which can be expressed as
 ()
()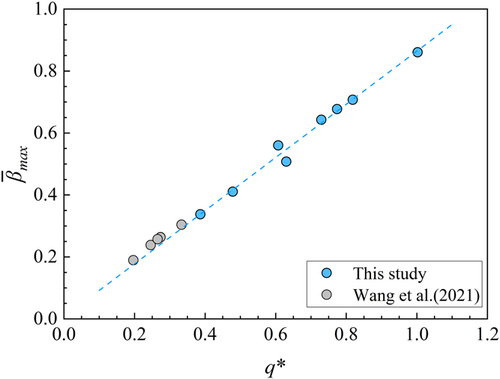
 on flow nondimensional flow intensity q* under clear-water scour conditions.
If the temporal development of β is determined, they bedload transport rate at a specific time can be calculated using Equation (5) under clear-water scouring conditions. Figure 8 shows the dependence of the normalized temporal bed surface structure parameter  on the normalized time tU0/h0, indicating that
  of each test gradually increased to equilibrium with increasing tU0/h0.
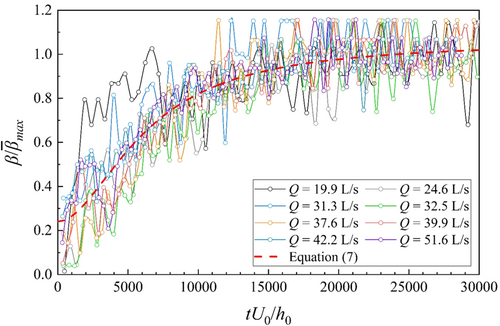
 on the normalized time tU0/h0.
 can be obtained based on Logistic equation (coefficient of determination R2 = 0.79) as follow:
 ()
()Figure 9 compares the measured and computed values by Equations (5)–(7) of qb and β. In Figure 9, except for the considerable error of the peak bedload transport rate in the initial stage of some tests, the calculated values by Equations (5)–(7) generally agree well with the measured values. Therefore, Equations (5)–(7) can be used to calculate the bedload transport rate of nonuniform sediment under clear-water scour conditions (e.g., the reach downstream of a dam or weir).
6 CONCLUSION
This study conducted theoretical derivation and flume experiments to investigate the qualitative influence of the bed surface structure on bedload transport in mountain rivers. The following conclusions were drawn:
Based on theoretical derivation, an equation for the bedload transport rate that considers the influence of the bed surface structure was established by introducing the bed surface structure parameter. The flume test results showed that under clear-water scour conditions, the bedload transport rate first increases rapidly and then gradually decreases with time, while the corresponding bed surface structure parameter gradually increases to an equilibrium value with time. Subsequently, if the flow intensity continues to increase and exceeds the critical condition of armor layer break, the bed surface structure parameter decreases rapidly to increase the bedload transport rate in a short time. As the armor layer reforms, the bed surface structure parameter gradually increases with time to reduce bedload transport rate.
Under clear-water scour conditions, the equilibrium value of the bed surface structure parameter increases linearly with the nondimensional flow intensity. The Logistic Equation can reasonably characterize the temporal development of the normalized bed surface structure parameter. Based on theoretical analysis and flume data, a calculation method of bedload transport rate for nonuniform sediment at a specific time under clear-water scour conditions is proposed.
This study reveals the quantitative impacts of bed surface structure on bedload transport in mountain rivers and proposes a calculation method for bedload transport rate for nonuniform sediment under clear-water scour conditions, providing theoretical basis and methodological supports for predicting the sediment transport and bed evolution in mountain rivers.
ACKNOWLEDGMENTS
This study was funded by National Natural Science Foundation of China, Grant/Award Numbers: U2040219, Sichuan Science and Technology Program, Grant/Award Numbers: 2023NSFSC1989, and Fok Ying Tung Education Foundation, Grant/Award Numbers: 171067.
ETHICS STATEMENT
None declared.
Open Research
DATA AVAILABILITY STATEMENT
The data that support the findings of this study are available from the corresponding author upon reasonable request.


