Identification and functional analysis of shared gene signatures between systemic lupus erythematosus and Sjögren's syndrome
Zhaowei Gao and Lan Yang contributed equally to this study.
Abstract
Background
Systemic lupus erythematosus (SLE) is an autoimmune disease that can affect multiple systems. Sjögren's syndrome (SS) is an autoimmune disease that may be primary SS (pSS) or occur together with other autoimmune diseases, including SLE. This study aimed to explore the shared gene signatures in SLE and pSS.
Methods
Gene expression data sets of SLE (GSE50772 and GSE81622) and pSS (GSE84844 and GSE48378) were obtained and analyzed for differentially expressed genes (DEGs) in peripheral blood mononuclear cells (PBMCs). A protein–protein interaction (PPI) network was constructed. Gene ontology (GO) and KEGG pathway enrichment analysis were carried out for the DEGs.
Results
We screened 232 and 110 DEGs from the SLE and pSS data sets, respectively. We found 32 shared DEGs, which were all upregulated in patients compared with controls. Among these 32 DEGs, 11 genes showed a more than twofold change in all data sets (IFI27, IFI44L, RSAD2, IFIT1, IFI44, USP18, IFI6, HERC5, EPSTI1, OAS1, and OAS3). PPI analysis showed that 29 genes interacted with each other. GO analysis showed that these 32 shared DEGs were mainly enriched in biological processes associated with the type I interferon signaling pathway, defense response to viruses, response to viruses, negative regulation of viral genome replication, and the immune response. Kyoto Encyclopedia of Genes and Genomes pathway analysis showed that these 32 DEGs were related to virus infection.
Conclusion
This study showed that alterations to biological processes associated with the response to virus infection play critical roles in both SLE and pSS.
Key points
-
Two hundred and thirty-two and 110 differentially expressed genes (DEGs) were screened in systemic lupus erythematosus (SLE) and primary Sjögren's syndrome (pSS) peripheral blood mononuclear cells RNA-seq data sets, respectively.
-
Thirty-two shared DEGs were screened in SLE and pSS data sets, which were all upregulated in patients compared to controls.
-
These 32 shared DEGs were mainly enrichment in biological progress associated with type I interferon signaling pathway, defense response to virus, response to virus, negative regulation of viral genome replication, and immune response.
1 INTRODUCTION
Sjögren's syndrome (SS) is a chronic systemic autoimmune disease that mainly involves the destruction of exocrine tissues, such as the lacrimal gland and salivary gland, also known as autoimmune exocrine gland disease.1 SS may be primary (pSS) or occur together with other autoimmune diseases, such as systemic lupus erythematosus (SLE) and rheumatoid arthritis. Most SS patients are middle-aged women.2, 3 The pathogenesis and underlying mechanism of SS are still unclear. Therefore, screening and identifying genes associated with SS is necessary to understand its complex pathogenesis.
SLE is a systemic autoimmune inflammatory disease with unknown etiology, characterized by the formation of multiple autoantibodies and multisystem involvement.4 There are several obvious similarities between SS and SLE patients. First, middle-aged women are the most susceptible group to both conditions. Second, immunological abnormalities mediate the production of circulating autoantibodies, such as antinuclear antibodies, antiribosomal P protein antibodies, and antibodies against SS-related antigen A (SSA/Ro) or SS-related antigen B (SSB/La). Third, SS can occasionally occur together with SLE. Thus, identification of the disease-associated genes shared between SLE and SS will be useful to explore the potential pathogenesis of SLE and SS.
In this study, we screened the shared differentially expressed gene (DEGs) signatures between SLE and SS patients by comprehensive analyses of published gene expression data in the Gene Expression Omnibus (GEO) database. Moreover, the expression levels of key DEGs were further verified in clinical samples from patients and healthy individuals. The main objective of this study was to screen for the potential key genes involved in the progression of both SLE and SS.
2 METHODS
2.1 Screening for DEGs
The GEO database was searched for gene expression data sets of peripheral blood mononuclear cells (PBMCs) or whole blood samples from SLE and pSS. Only data sets that included more than 10 patients and 10 controls were analyzed. Then, GSE50772,5 GSE81622,6 GSE84844,7 and GSE483788 were used to explore the shared DEGs between SLE and pSS patients.
First, the DEGs between patients and normal controls in each data set were screened using GEO2R. Genes with |log2(FC)| > 0.5 (FC, fold change) and adjusted p< 0.05 were selected and used for analysis in the next step. Then, we screened for the DEGs shared between the data sets. The expression levels of the shared DEGs in T and B cells from SLE and SS patients were analyzed based on the GSE4588, GSE135809,9 and GSE9368310 data sets. Information about these GEO data sets is summarized in Table 1.
| GEO accession | Platforms | Patients | Controls | Samples |
|---|---|---|---|---|
| GSE50772 | GPL18460 | 61 SLE | 20 normal | PBMCs |
| GSE81622 | GPL570 | 30 SLE | 25 normal | PBMCs |
| GSE84844 | GPL10558 | 30 pSS | 30 normal | Whole blood |
| GSE48378 | GPL5175 | 11 pSS | 16 normal | PBMCs |
| GSE4588 | GPL570 | 8 SLE | 10 normal | CD4 T cells |
| GSE4588 | GPL570 | 7 SLE | 9 normal | B cells |
| GSE135809 | GPL570 | 24 pSS | 24 normal | B cells |
| GSE93683 | GPL570 | 24 pSS | 24 normal | CD8 T cells |
- Abbreviations: GEO, Gene Expression Omnibus; PBMCs, peripheral blood mononuclear cells; pSS, primary Sjögren's syndrome; SLE, systemic lupus erythematosus.
2.2 Functional analysis of DEGs
Gene ontology (GO) and Kyoto Encyclopedia of Genes and Genomes (KEGG) pathway analysis of the DEGs were performed using DAVID bioinformatics resources (https://david.ncifcrf.gov/tools.jsp).11 R bubble diagrams were used for visualization of the enriched GO terms and KEGG pathways.
2.3 Protein–protein interaction (PPI) network analysis
PPI networks for the DEGs were constructed using the “Search Tool for the Retrieval of Interacting Genes/Proteins” (STRING) database (http://stringdb.org/).12
2.4 PBMC sample collection
Ethical approval was obtained from the Ethics Committee of Tangdu Hospital, Fourth Military Medical University (202103-068). Informed consent was exempted for this study. Blood samples from SLE (n = 10) and pSS (n = 10) patients were collected. Patients were recruited from the Department of Rheumatism and Immunology, Tangdu Hospital, Air Force Medical University. SLE patients satisfied the 1997 Revised American College of Rheumatology Criteria. pSS patients satisfied the 2002 American–European Consensus Group Classification criteria. Healthy subjects were used as the control group in this study. PBMCs were obtained using Ficoll separation according to the operation manual (Dakewe Biotech).
2.5 Quantitative real-time PCR (qRT-PCR)
First, RNA extracted from PBMC was reverse-transcribed into complementary DNA using a reverse transcription kit (Applied Biological Materials Inc.) according to the manufacturer's instructions. Then, qRT-PCR was performed to investigate the expression levels of the DEGs using BlasTaq™ qPCR Mastermix (Applied Biological Materials Inc.). The relative expression levels of genes were normalized to the housekeeping gene GAPDH  . The primers are listed in Supporting Information: Table 1.
2.6 Statistical analysis
The expression differences were calculated using R software (version 4.0.2; The R Foundation) for statistical analysis. FC and adjusted p values were used to compare the expression data between different groups. Spearman's correlation analysis was used to estimate the correlation of DEG expression FC between different data sets. The Wilcoxon test was used to analyze the difference in gene expression between patients and healthy controls, and p < 0.05 was considered statistically significant.
3 RESULTS
3.1 DEGs in the SLE and pSS data sets
We screened for genes with |log2(FC)| > 0.5 and adjusted p< 0.05 in patients compared with normal controls. First, for the SLE data sets, 3075 and 446 DEGs were screened from the GSE50772 and GSE81622 data sets, respectively. Moreover, 232 common DEGs were found (Figure 1A). Among these 232 DEGs, 156 genes were upregulated in SLE patients while 76 genes were downregulated in SLE patients (Figure 1B). The expression changes of these 232 genes showed high consistency between the two data sets (r = 0.87; Figure 1C).
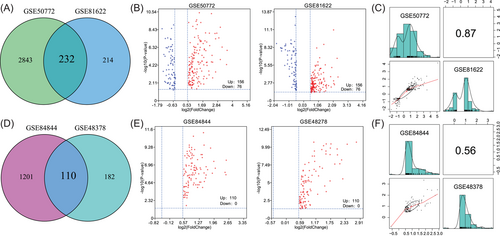
Second, for the pSS data sets, 1311 and 292 DEGs were screened from the GSE84844 and GSE48378 data sets, respectively. Moreover, 110 common DEGs were found (Figure 1D). Notably, the expression of all 110 DEGs was increased in pSS patients compared with controls (Figure 1E). The expression changes of these 110 genes showed high consistency between the GSE84844 and GSE48378 data sets (r = 0.56; Figure 1F).
3.2 Functional analysis of DEGs in SLE
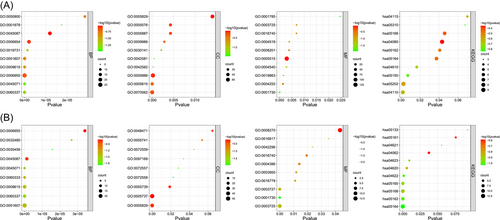
To further explore the potential mechanism of SLE and SS progression, GO and KEGG enrichment analysis were used to analyze the biological functions of the DEGs. First, we conducted GO and KEGG analysis for the 232 DEGs in the SLE data sets. Regarding the GO_BP (biological process) term, the results revealed that these 232 DEGs were significantly enriched in BPs associated with the response to pathogen infection, including the type I interferon signaling pathway, negative regulation of viral genome replication, response to viruses, defense response to viruses, antibacterial humoral response, and innate immune response (Figure 2A). GO_MF (molecular function) analysis showed that these genes were mainly related to terms, such as serine-type endopeptidase activity, IgE binding, ribonuclease activity, protein binding, and endonuclease activity. KEGG pathway analysis showed that these genes were closely involved in Staphylococcus aureus infection, the complement and coagulation cascades, and influenza A. Taken together, these results suggest that a variety of immune processes related to pathogen infection are involved in SLE development.
3.3 Functional analysis of DEGs in pSS
We conducted GO and KEGG analysis of the 110 DEGs in the pSS data sets (Figure 2B). GO_BP analysis showed that these genes were closely involved in multiple interferon-related signaling pathways, including type I interferon signaling pathway, response to interferon-β, interferon (IFN)-γ-mediated signaling pathway, and negative regulation of type I interferon production. GO_MF analysis showed that these 110 DEGs were significantly related to nucleic acid metabolism, including RNA binding, 2′−5′-oligoadenylate synthetase activity, nucleotidyl transferase activity, and helicase activity. KEGG pathway analysis showed that these DEGs were linked to various pathways related to virus infection, including influenza A, measles, and herpes simplex infection.
3.4 Shared DEGs in the SLE and pSS data sets
Based on the previously set criteria for DEGs, 32 shared DEGs between the SLE and pSS data sets were found in this study, which were all upregulated compared with controls (Figure 3A). The correlation coefficient of expression FC for the 32 DEGs was 0.45 between the two SLE data sets and 0.7 between the two pSS data sets (Figure 3B). Moreover, among these 32 DEGs, the expression FC of 11 genes (IFI27, IFI44L, RSAD2, IFIT1, IFI44, USP18, IFI6, HERC5, EPSTI1, OAS1, and OAS3) were more than twofold (i.e., log2FC > 1) in all four data sets (Figure 3C,D). The expression level changes of these 11 genes were also analyzed in T cells and B cells from SLE and pSS patients. The results showed that these 11 genes were all upregulated in both T and B cells from patients compared with normal controls (Supporting Information: Figure 1).
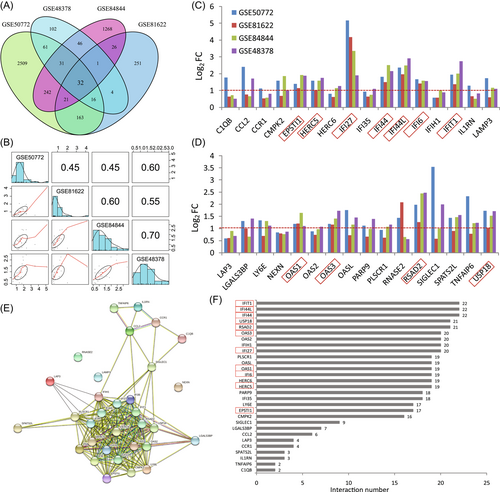
Furthermore, PPI analysis was performed to determine the interactions between the 32 shared DEGs. PPI analysis demonstrated that 29 genes interacted with each other (Figure 3E). Of these genes, 20 genes interacted with more than 15 of the other genes (Figure 3F).
3.5 Enrichment analysis of the DEGs shared between SLE and pSS
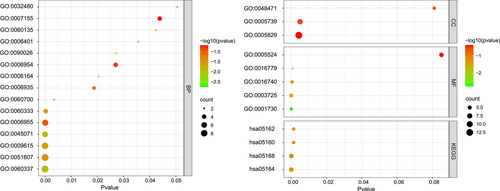
We performed GO and KEGG analysis of the 32 shared DEGs. The top five significantly enriched GO_BP terms were the type I interferon signaling pathway, defense response to viruses, response to viruses, negative regulation of viral genome replication, and immune response (Figure 4). KEGG pathway analysis showed that these DEGs were related to virus infections, such as influenza A, herpes simplex infection, and hepatitis C. These results confirmed that the BP related to the interferon signaling pathway and response to virus infection are important for disease development in both SLE and pSS.
3.6 Validation of the DEGs in SLE and pSS patients
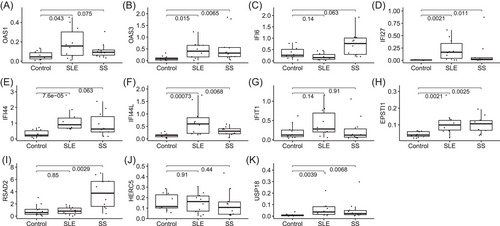
To validate the reliability of the DEGs, the expression levels of the top 11 DEGs (OAS1, OAS3, IFI6, IFI27, IFI44, IFI44L, IFIT1, EPSTI1, RSAD2, HERC5, and USP18) were further identified by qRT-PCR in clinical samples. Coincident with the results from the GEO database, the qRT-PCR results showed that the expression of OAS3, IFI27, IFI44L, EPSTI1, and UPS18 were significantly higher in PBMCs from both SLE and SS patients than in normal controls. OAS1 and IFI44 were increased in SLE patients, and RSAD2 was increased in SS patients (Figure 5).
4 DISCUSSION
SLE and SS are both prevalent autoimmune diseases with complex clinical manifestations. The pathogenesis involved in SLE and SS is still unclear. Moreover, SS is found in association with other autoimmune diseases, including SLE.13 It seems that few studies have explored the genetic aspects of susceptibility to SS and SLE. Therefore, the identification of key common genes in SLE and SS is critical for exploring the potential mechanism of SLE, SS, and particularly the cooccurrence of SLE and SS.
With the development of high-throughput sequencing technologies, analysis of transcriptome data sets has become an important approach for screening for both key genes involved in disease development and therapeutic targets. However, the results of RNA-seq can be influenced by the heterogeneity of sampling. By increasing the number of samples, the influence of sample heterogeneity is weakened. Thus, in this present study, the PBMC transcriptome data sets analyzed all included more than 10 patients and 10 controls, and data sets including fewer samples were excluded.
In this present study, we analyzed the common DEGs and functions in SLE and pSS based on the transcriptome data sets. In total, we screened 232 and 110 DEGs in the SLE and SS data sets, respectively. Among these DEGs, there were 32 shared DEGs, which were all upregulated compared with healthy controls. These 32 DEGs were enriched in the BP involved in the type I IFN signaling pathway (GO:0060337), defense response to viruses (GO:0051607), response to viruses (GO:0009615), negative regulation of viral genome replication (GO:0045071), immune response (GO:0006955), and the IFN-γ-mediated signaling pathway (GO:0060333). These results demonstrate that IFN signaling is highly active in both SLE and SS patients.
To further explore the potential mechanism of SLE and SS progression, GO and KEGG enrichment analysis were used to analyze the biological functions of the DEGs IFN is a multifunctional cytokine with a wide range of biological functions that play an important role in the natural immune response, which can be divided into types I, II, and III. When IFN binds to receptors expressed on cells, it induces the expression of hundreds of genes. Of the 32 common DEGs in this study, there were 15 IFN-induced genes (IFI27, IFI44L, HERC6, RSAD2, IFI35, IFIT1, IFI44, IFIH1, IFI6, HERC5, OAS2, OASL, OAS1, OAS3, and LY6E). Increased levels of IFN and type I IFN-induced genes play important roles in the pathogenesis of SLE.14-16 Pascual and colleagues have reported a series of foundational studies on IFN signaling in SLE and revealed the potential mechanism of generation of IFN and its critical roles in the regulation of multiple immune cells.17-21 For example, they found that antibody-mediated internalization of red blood cells carrying mitochondria induced IFN production through cGAS activation in macrophages in SLE.18 In addition, netting neutrophils were major inducers of IFN production in pediatric SLE, and oxidized mitochondrial nucleoids released by neutrophils drive type I IFN production in SLE.19, 20 Moreover, IFN-α induced unabated production of short-lived plasma cells in pre-autoimmune lupus-prone mice but not in normal mice.21 Thus, these studies revealed a central role for IFN in SLE pathogenesis.
Several IFN-blocking strategies have shown good clinical efficacy in clinical trials. For example, Khamashta et al.'s22 study showed that sifalimumab (a fully human, immunoglobulin G1 κ monoclonal antibody to IFN-α subtypes) is a promising treatment for adults with SLE. A clinical trial study showed that anifrolumab (a human monoclonal antibody to type I INF receptor subunit 1) results in a significant benefit with respect to the glucocorticoid dose and the severity of skin disease.23 In 2021, intravenous anifrolumab was approved in the United States of America for the treatment of adult patients with moderate to severe SLE who are receiving standard therapy.24 Notably, herpes zoster infections were more frequent with anti-IFN treatment in SLE.22, 24 Thus, it is important to screen and identify better therapeutic targets for SLE, which could include one of the DEGs mentioned in this study. For SS, although no anti-IFN drugs are used for SS treatment at present, accumulating studies have reported that the levels of multiple IFN-induced genes were increased in PBMCs, serum, or saliva from SS patients, which promoted the pathogenesis of SS.25-27
USP18 is an interferon signaling pathway inhibitor that specifically cleaves ISG15 (a ubiquitin protein) from its substrate protein, thereby protecting the protein from degradation. Yang et al.28 showed that USP18 deletion upregulated regulatory T (Treg) cell differentiation in mice. Because the level of Treg cells in SLE patients is significantly downregulated, upregulation of USP18 may play an important role during SLE development. Moreover, Altorok et al.29 showed that USP18 was hypomethylated in CD4+ T cells from pSS, which might contribute to the upregulation of USP18 mRNA expression.
Chemokines and their receptors, mediating signal transduction, are critical for the recruitment of effector immune cells to the inflammatory site, which may contribute to autoimmune inflammation. Monitoring serum chemokines levels has emerged as a potential tool to assess the likelihood of future exacerbations of clinically inactive patients with SLE. This study showed that CCL2 and CCR1 were increased in both SLE and pSS. Consistent with this result, Geneva-Popova et al.30 found that serum CCL2 levels were increased in SLE patients, and Hernández-Molina et al.31 found that pSS patients had higher saliva CCL2 levels than healthy controls.
Several of the other DEGs have been reported to be involved in autoimmune disease development. For example, LAMP3 (lysosome-associated membrane protein 3) induces apoptosis and autoantigen release in SS patients.32 Thus, increased LAMP3 in SLE might contribute to the development of SS. Lai et al.33 showed that CMPK2 (cytidine/uridine monophosphate kinase 2) potentially contributes to premature atherosclerosis in SLE by regulating IFN-α-enhanced foam cell formation, while the changes and function of CMPK2 in SS remain unknown.
In conclusion, these data confirm the important roles of IFN-related molecules in SLE and SS development, and that IFN-related genes may be potential biomarkers and therapeutic targets for SLE and SS. The function of these DEGs during the development of SLE and SS should be investigated in further studies.
AUTHOR CONTRIBUTIONS
Concept and design: Zhaowei Gao and Ke Dong. Data analysis: Chong Liu and Lan Yang. Manuscript preparation: Zhaowei Gao, Lan Yang, and Xi Wang. Manuscript editing and review: Huizhong Zhang and Ke Dong.
ACKNOWLEDGMENT
This work is supported by the Basic Research Program of Natural Science in Shaanxi Province (2020JM-315), and Scientist Fund of Tangdu Hospital (2021SHRC004).
CONFLICT OF INTEREST
The authors declare no conflict of interest.
ETHICS STATEMENT
Ethical approval was obtained from the Ethics Committee of Tangdu hospital, Fourth Military Medical University.
Open Research
DATA AVAILABILITY STATEMENT
The data that support the findings of this study can be obtained from the corresponding author ([email protected]).


