Proteomics in Kidney Allograft Transplantation—Application of Molecular Pathway Analysis for Kidney Allograft Disease Phenotypic Biomarker Selection
See accompanying commentary by Alberto Ortiz, https://doi.org/10.1002/prca.201900004
Abstract
There is a need for accurate, robust, non-invasive methods to provide early diagnosis of graft lesions after kidney transplantation. A multitude of proteomic biomarkers for the major kidney allograft disease phenotypes defined by the BANFF classification criteria have been described in literature. None of these biomarkers have been established in the clinic. A key reason for this is the lack of clinical validation which is difficult, as even the gold standard of diagnosis, kidney biopsy, is often ambiguous.
The semantic clustering by ReviGO on top of transcriptomic pathway analysis is evaluated to connect histological and transcriptomic kidney allograft disease characteristics with proteomic biomarker qualification.
By using public data generated in microarray studies of kidney allograft tissue, biological processes and key molecules specifically associated with the different kidney allograft disease phenotypes are identified.
Semantic clustering holds the promise to guide adaptation of proteomic marker panels to molecular pathology. This can support the development of noninvasive tests (e.g. in urine, by capillary electrophoresis mass spectrometry) that simultaneously detect diverse kidney allograft phenotypes with high accuracy and sensitivity.
1 Introduction
Chronic kidney damage after kidney allograft transplantation impairs long-term function and survival of the renal allograft. It is complex and can arise mainly from active or latent rejection episodes, viral infections, and drug toxicity. It is important to identify any post-transplantation complication as early as possible so that appropriate therapies can be initiated. However, detection and differentiation of the underlying pathological processes at an early stage is challenging. Currently, unequivocal identification of these complications requires an allograft biopsy. However, allograft biopsies suffer from (i) being unpleasant and possibly traumatic to the patient, (ii) the occurrence of high sampling error and interobserver variability rates, and (iii) the inability to repeat biopsies within short time intervals indefinitely often in one patient. Due to these drawbacks of biopsy monitoring, there is a strong clinical need for the development of noninvasive tests for accurate, specific, and early detection of complications applicable to all patients with kidney allografts. Such diagnostic tests would allow appropriate interventions before clinical signs of kidney damage become apparent.1
The presence of serum anti-HLA donor-specific antibodies (“DSAs”) has been shown to be strongly predictive of antibody-mediated rejection (AMR), but even DSAs have limitations since they do not cover the whole spectrum of AMR-related complications.2, 3 Some other biomarker candidates like the chemokines CXCL9 and CXCL10 showed promising results in the diagnosis of some rejection phenotypes4 but implementation in clinical routine requires further studies. Whole proteome analysis of body fluids has the potential of identifying patterns of biomarkers that allow a more detailed view on the molecular disease processes5 and thus may enable a more timely and accurate detection of transplantation-related complications. In recent years, numerous protein biomarkers have been described in the literature using proteomics approaches to provide specific diagnosis for defined allograft disease phenotypes. However, none of the proteomic biomarkers could be implemented into clinical diagnosis so far due to a lack of validation. What makes proteomic biomarker discovery and qualification for renal graft diseases a challenging task is its dependence on histomorphological examination of kidney biopsies as the sole reference standard, which is sometimes inconclusive and error prone.6, 7 To solve this problem, methods have to be employed that allow disease phenotyping of biopsy sections on the molecular level with the objective to avoid indeterminate cases and to come to a better classification tree omitting “borderline,” “suspicious,” or “probably non-specific” assignments together with a clearer distinction of the different disease phenotypes from each other.8 As summarized below first studies toward a molecular characterization of renal graft diseases have been performed. These studies were used here in a semantic clustering approach to search for similarities and differences in the molecular pathways and biological processes between the main kidney allograft disease phenotypes AMR, T cell-mediated rejection (TCMR), interstitial fibrosis/tubular atrophy (IFTA), and polyomavirus-associated nephropathy (PVAN). In subsequent analysis, pathway clusters were evaluated in respect to their connection to proteomic biomarker profiles, that is, those that were established in urine samples of kidney transplant recipients by capillary electrophoresis mass spectrometry. We tested specifically for TCMR if semantic clustering of molecular pathways and biological processes in the renal allograft tissue may serve as a valuable tool to guide adaptation of proteomic marker panels to the molecular pathology of a specific kidney allograft disease phenotype TCMR.
2 The Molecular View: Mapping of Molecular Pathways
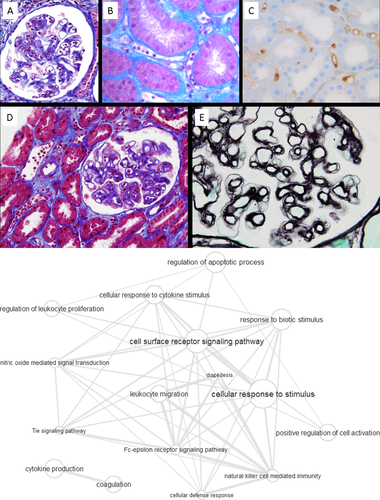
In this study, we searched the literature for studies presenting the results of pathway analysis on microarray data sets by the well-established Gene Ontology (GO), Ingenuity Pathway Analysis (IPA), and Kyoto Encyclopedia of Genes and Genomes (KEGG) analytical approaches. We restricted our search to gene enrichment analyses in human renal biopsies and to studies describing pathways specific for AMR, TCMR, IFTA, and PVAN. As presented in Table 1, we identified two studies for AMR,2, 9 five for TCMR,10-14 eight for IFTA,11, 15-21 and two for PVAN13, 22 using statistically validated differentially regulated gene expression and appropriate GO-, IPA-, and KEGG-derived pathway mappings. To perform semantic clustering on these kidney transplantation related disease phenotypes by the software tool ReviGO,23 we converted IPA and KEGG pathways to GO biological processes using QuickGO,24 AmiGO,25 and UniProt. The lists of GO biological processes for AMR, TCMR, IFTA, and PVAN are presented in the Supporting Information “GO term lists.” Based on these lists, ReviGO performed semantic clustering for each of these post-transplant phenotypes. The results are presented in the Figures 1B–4B as interaction graphs and in the Supporting Information “Treemap Graphs” as treemap graphs. Additionally, unconnected hubs in the interaction graphs were manually removed to spatially determine the interconnectivity between the individual GO-terms. These graphical representations of pathway interconnections were used to distinguish disease phenotype-specific pathways from those that are common to all disease phenotypes.
Clinical Relevance
Kidney transplantation is the optimal treatment for patients with end-stage renal disease, but long-term graft function is limited due to several causes of graft injury. Early and reliable diagnosis of this injury by allograft biopsy is limited because close follow-up is not possible even with repeated biopsies; also, histology leaves many cases unclear. Non-invasive diagnostic tests could solve this dilemma. A multitude of proteomic biomarkers for major allograft disease phenotypes have been proposed, including T cell- and antibody-mediated rejection, interstitial fibrosis/tubular atrophy and polyomavirus-associated nephropathy. However, lacking clinical accuracy and validation of these proteomic markers prevented the establishment in routine clinical diagnostics. An important step to consolidate phenotypic disease markers could be semantic clustering of renal tissue transcriptomic pathways. This approach identifies phenotype-specific pathways and associated key molecules that can be used as sensitive and specific markers for a given phenotype. By defining non-overlapping key molecules and marker sets for each disease phenotype, simultaneous detection of different disease processes should be possible.
| Study | Disease phenotype with pathway information | Number of biopsies used for gene expression profiling | Patient groups | Gene set | Pathway analysis | P-value threshold for gene expression level changes |
|---|---|---|---|---|---|---|
| 14 | TCMR | 703 | 64 AKI, 25 PVAN, 67 TCMR, 89 BL, 110 AMR, 28 Mixed, 27 TG, 81 GN, 72 IFTA, 116 NRF, 24 Other | Training set: GSE36059, validation set: GSE48581 | IPA | p < 0.05, Fisher's exact test, Benjamini–Hochberg correction |
| 22 | PVAN | 45 | 15 PVAN, 30 NRF | GSE75693 | GO & KEGG | p< 0.05, t-test, gene counts ≥ 5 |
| 13 | TCMR & PVAN | 168 | 26 TCMR, 59 IFTA, 10 PVAN, 73 NRF; confirmation by qPCR in 15 PVAN, 18 AR and 18 NRF | GSE72925 | GO | empirical Bayes moderated t-test, p < 0.05, Benjamini–Hochberg correction |
| 11 | IFTA & TCMR | 234 | 54 TCMR, 42 IFTA, 29 TCMR+IFTA, 10 i-IFTA, 99 NRF | GSE76882 | GO & IPA & Gene co-expresssion analysis | p < 0.05, two-sample t-test, Benjamini–Hochberg correction |
| 12 | TCMR | 25 | 5 TCMR, 5 i-IFTA, 5 PVAN, 5 NRF, 5 Other | IPA | Audic Calverie Test, Benjamini–Hochberg correction | |
| 10 | TCMR (chronic & acute) | 76 | 14 chronic TCMR, 10 acute TCMR, 52 CD | GSE69677 | IPA | p < 0.05, Fisher's exact test, Benjamini–Hochberg correction |
| 9 | AMR | 703 | 64 AKI, 25 PVAN, 67 TCMR, 89 BL, 110 AMR, 28 Mixed, 27 TG, 81 GN, 72 IFTA, 116 NRF, 24 Other | Training set: GSE36059, validation set: GSE48581 | IPA | p < 0.05, Fisher's exact test, Benjamini–Hochberg correction |
| 2 | AMR | 48 | 28 AMR, 20 NRF | GSE50084 | GO | p < 0.05 by fitting gene-wise linear models, Benjamini–Hochberg correction |
| 19 | IFTA | 159 | 159 IFTA (101 w/ 12-mo biopsy; 44 high & 57 low CADI-12 scores) | GSE57387 | GO | p ≤ 0.05 by Fisher's exact test, Spearman correlation to CADI score at 3 and 12 months, selection by cross-validation |
| 20 | IFTA | 20 | 8 IFTA, 12 NRF | GO | p < 0.05, t-test, qFDR adjustment | |
| 16 | IFTA | 227 | 106 IFTA, 121 NRF | GSE25902, GSE44131, GSE9493, GSE22459, GSE74313 | IPA | p < 0.05, hypergeometric test, Benjamini–Hochberg correction |
| 18 | IFTA | 32 | 24 IFTA (9 IFTA grade 1, 15 IFTA grade 2 or 3), 8 NRF (IFTA grade 0) | IPA | p ≤ 0.05, Fisher's exact test, Spearman correlation for hierarchical clustering | |
| 15 | IFTA | 84 | 59 IFTA, 25 NRF | GSE7392, GSE9493 | IPA & KEGG | p ≤ 0.05, Fisher's exact test, Benjamini–Hochberg correction |
| 17 | IFTA | 21 | 21 IFTA (6 IFTA grade 1 & 9 IFTA grade 2 vs. 6 IFTA grade 3)a | IPA | p < 0.1, FDR-adjustment | |
| 21 | IFTA | 30 | 30 IFTA (3- to 12-month increase in ci & ct scores, no IFTA grade 3) | GO & IPA | p < 0.05, two-tailed t-test, Spearman correlation with IFTA at 12 months |
- a according to personal communication
- Abbreviations: AKI, acute kidney injury; AMR, antibody-mediated rejection; AR, not further specified acute rejection regarding AMR/TCMR; BL, borderline rejection; CADI, Chronic Allograft Damage Index; CD, cadaveric donor; GN, glomerulonephritis; GO, Gene Ontology; i-IFTA, inflammation in areas with IFTA; IFTA, interstitial fibrosis and tubular atrophy; IPA, Ingenuity Pathway Analysis; KEGG, Kyoto Encyclopedia of Genes and Genomes; NRF, normal renal function; PVAN, Polyomavirus-associated nephropathy, also known as BK virus nephropathy; TCMR, T cell-mediated rejection; TG, transplant glomerulopathy
3 The Histomorphological View: Banff Criteria for Histological Characterization of Kidney Allograft-Pathologies
Since the beginning of the renal transplantation era, histological examination of kidney graft biopsies has been and still is the gold standard to identify rejection and to assess graft status.
In 1991, an international group of renal allograft rejection experts convened in the Canadian city of Banff and established the Banff classification criteria to allow an “international standardization of criteria for the histologic diagnosis of renal allograft rejection.”26 The group intended to “promote international uniformity in reporting of renal allograft pathology, facilitate the performance of multicenter trials of new therapies in renal transplantation, and ultimately lead to improvement in the management and care of renal transplant recipients.”26
The content and consecutive changes in Banff classification following each meeting have been summarized recently.27 The initial classification included six “principal diagnostic categories”: normal, hyperacute rejection, borderline acute rejection, acute rejection, chronic allograft nephropathy, and other changes not to be considered to be due to rejection. It initiated a system using code letters (“t” for tubulitis, “ct” for tubular atrophy, etc) for each elementary lesion of a renal compartment where the severity of the lesion is graded from 0 (absent) to 3 (severe). Each principal diagnostic category has its own requirement (e.g. t > 2 and I > 2 for acute T cell-mediated rejection). Protocol biopsies have been advocated since the 1999 edition of the Banff classification. In the 2005 edition of the classification guidelines a major evolution started with the recognition that molecular markers can go beyond sheer biopsy findings.28 That same year, the imprecise entity “chronic allograft nephropathy” was eliminated. The 2011 edition started promoting the use of tissue-based transcriptomics data, “endothelial activation and injury transcripts” (ENDATs), popularized by the research group of P.F. Halloran and these recommendations have grown stronger in the following editions.29-32 The recent updates from 2015 and 2017 of the Banff criteria now introduce inflammation within areas of IFTA (i-IFTA) as a separate histological entity of the classification suggestive of chronic active TCMR.31, 32
4 Histological and Molecular Characterization of Kidney Allograft-Related Disease Phenotypes
Below, we will give a brief summary of the characteristics of the most prominent kidney allograft-related disease phenotypes with their histological presentations and literature-described principal molecular pathways. Connecting each disease phenotype and its respective pathways may enable, classification and qualification of biomarkers. In addition, this could lead to a better definition of the pathological entities.
4.1 Antibody-Mediated Rejection
Due to differences in the genetic background between kidney donor and recipient, B lymphocytes are activated and mature to plasmocytes producing large amounts of specific antibodies that target the allograft and elicit effector functions, for example, complement activation. Antibodies from the recipient target donor organ epitopes and are therefore called donor-specific antibodies (DSA). Sensitization of the recipient against the donor antigens might have preceded (e.g. due to pregnancy, blood transfusion, prior organ transplantation), or may have followed kidney transplantation (de novo donor-specific antibodies). Insufficient immunosuppression is an important cause for the development of de novo DSA. Antibodies directed against HLA molecules have been described as central in this type of rejection. Following antibody fixation, different pathways can lead to allograft destruction. For instance, activation of the complement cascade leads to mainly endothelial lesions of glomerular and peritubular capillaries.
AMR is today viewed as the major cause of long-term graft loss. Regular screening for anti-HLA antibodies in the recipient's serum using dedicated technology (e.g. Luminex technology) is part of the standard follow-up.
Typical histological characteristics of acute AMR are presented in Figure 1A and are described as follows: Peritubular capillaritis, acute glomerulitis, acute endothelial cell damage, capillary thrombosis, thrombotic microangiopathy, and C4d deposition. In chronic active AMR, additional features are: Peritubular capillary basement membrane multilayering, transplant glomerulopathy, and new-onset arterial intimal fibrosis.
Key molecular pathways identified by pathway analysis to be strongly associated with AMR are presented in the Supporting Information “GO term lists.” The integration of these pathways to an interaction graph is presented in Figure 1B.
According to the treemap of AMR in the Supporting Information “Treemap Graphs,” semantic clustering of pathways indicates that caveolin-mediated endocytosis is an AMR-specific pathway category. Caveolin-mediated endocytosis is a distinct endocytotic pathway in addition to the well-established clathrin-mediated endocytosis33 and is a cellular mechanism for TGFβ signal suppression.34 Expression of the caveolin structural protein caveolin-1 was described by Yamamoto et al. to be a distinct feature of chronic active AMR.35 The same group later found in multivariate COX regression analysis on 98 kidney transplant recipients that caveolin-1 but not C4d immunoreactivity was independently associated with graft failure.36
4.2 T Cell-Mediated Rejection
While AMR relies on the production of deleterious antibodies and mainly affects the microvasculature of the graft, in T cell-mediated rejection, primed T cells of the recipient infiltrate the donor's transplant and recognize its cells as foreign. In addition, danger-associated molecular patterns (DAMPS) are released due to organ damage, for instance in ischemia-reperfusion injury following transplantation. Upon activation by these stimuli, T cells secrete toxic molecules including perforin and granzyme B, leading to graft destruction.
TCMR is characterized by immune cell infiltration of renal tubules (known as tubulitis) and by interstitial infiltrates, that is, the presence of inflammatory cells in the tissues surrounding the tubules and the glomeruli. A second entity of TCMR is vascular rejection characterized by subendothelial leukocyte infiltration. Recently, inflammation in areas of interstitial fibrosis and tubulitis of atrophic tubuli have been suggested as one criterion of chronic active TCMR. The incidence of acute TCMR tends to decrease over the years after transplantation. It has also dramatically decreased since the introduction of the immune suppressant drug tacrolimus.
TCMR can be confused with PVAN due to similar histopathological features.13 Moreover, in biopsies with low-grade tubulitis and interstitial infiltrates, TCMR can only be suspected. Due to this uncertainty these biopsies are categorized according to the Banff criteria as “borderline rejection.”
Typical histological characteristics of TCMR are presented in Figure 2A and are described as follows: Tubulitis or tubular infiltration of T and monocyte cells, interstitial inflammation, intimal arteritis of pre-glomerular vessels, and specifically in chronic active TCMR: IFTA with inflammation and chronic arteriopathy with monocyte cell inflammation/neointima.
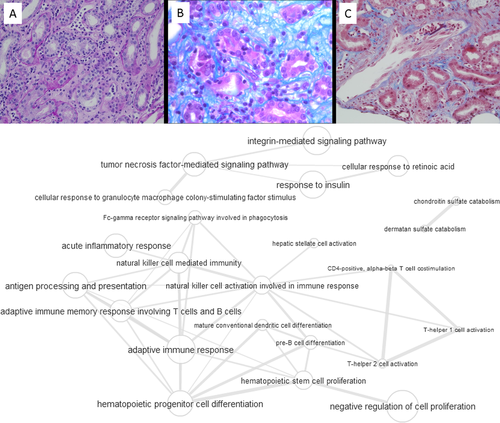
The molecular pathway map shows that there is an adaptive immune response mediated via T and B cells and signaling through pathways involving tumor necrosis factor, integrin, insulin, retinoic acid, and granulocyte macrophage colony-stimulating factor (GM-CSF) (Supporting Information “GO term lists” and interaction graph presented in Figure 2B). Semantic clustering of GO terms shown in the treemap analysis in the Supporting Information “Treemap Graphs” indicates a GM-CSF-mediated cell response, granzyme B production and phosphatidylinositol catabolism as the main higher-order elements. GM-CSF, an immune modulatory cytokine, is known to be expressed by both infiltrating inflammatory cells and renal parenchymal cells under appropriate conditions, and to mediate glomerular damage.37 Other components of the GM-CSF biological process are the microRNA's Mir21 and Mir155 biomarker candidates for allograft rejection.38, 39 Recently their expression levels in RNA isolates of human biopsies were reported to be significantly higher in TCMR than in AMR cases.40 Additionally, infiltrating lymphocytic T cells in renal transplant tissue have been shown to possess a strong immunopositivity for granzyme B, a protease with target-cell lysis properties in cell-mediated immune responses, which may be used as a marker of severity of graft damage.41 In accordance to the treemap graph for TCMR in the Supporting Information “Treemap Graphs,” where phosphatidyl-inositol catabolism is shown as another TCMR-specific pathway cluster, expression of granzyme B in activated T lymphocytes is linked to the phosphatidylinositol pathway through the PI3K/mTOR axis.42 This in turn links directly to catabolism or destruction of cell surface proteoglycans.43
4.3 Interstitial Fibrosis and Tubular Atrophy
IFTA describes the transformation of highly differentiated renal tubuli to atrophic tubuli with the loss of tubular epithelial cells. This process is accompanied by peritubular capillary rarefaction, and accumulation of large amounts of connective tissue between atrophic tubuli. It is non-specific in itself and is the sequel of acute and chronic immunologic injury due to multiple reasons, such as rejection, BK virus nephritis, and bacterial infections. Besides these-immunologic injury factors, other non-immunologic factors such as calcineurin inhibitor toxicity, ischemia/reperfusion, and hydronephrosis of the kidney can contribute to IFTA.
Typical histological characteristics of IFTA are presented in Figure 3A and are described as follows: Interstitial fibrosis, tubular atrophy, dilation of tubules, epithelial-mesenchymal transition, shrinkage of the outer dimensions of the graft (atrophy).
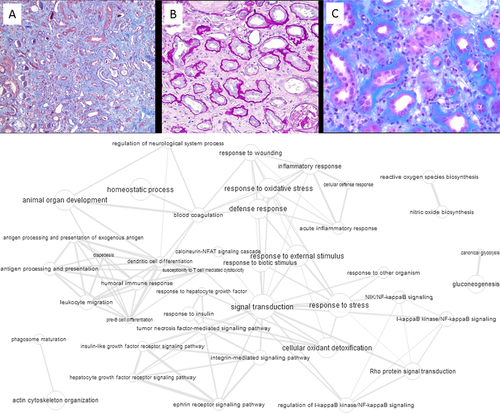
The integration of GO terms (from the Supporting Information “GO term lists”) to an interaction graph is presented in Figure 3B. From the molecular pathway map in Figure 3B and from the treemap in the Supporting Information “Treemap Graphs” only few markers appear specifically associated with IFTA. This is not surprising given the multitude of causes leading to this type of kidney allograft complication. Only response to hepatocyte growth factor (HGF) was identified as a dominant feature for IFTA. This is in line with a recent genomic meta-data analysis report that HGF and EGF growth factor and integrin adhesion molecule and explicitly not TGFβ related pathways can differentiate chronic allograft nephropathy/IFTA progression.15 Of note, HGF is a driver of epidermal-to-mesenchymal transition,44 which is also described in IFTA.45 The other features are rather unspecific, like gluconeogenesis or shared with AMR and TCMR, like antigen processing and presentation.
4.4 Polyomavirus-Associated Nephropathy
PVAN is defined as a nephropathy due to a persisting polyoma-virus infection of the kidney allograft recipient. During childhood the majority of the population will have contracted an asymptomatic type of the polyomavirus.46 The virus remains dormant in the urinary tract and is permanently controlled by the immune system. Following immunosuppression required for kidney transplantation, the virus may escape the immune system and may then be found at high titers in urine, in blood and in the renal tissue itself and cause PVAN. The generic term polyomavirus refers to both BK and JC virus, with the latter being responsible for only 5% of PVAN cases.47
Whereas TCMR requires an increase in immunosuppressive therapy, treatment of PVAN mainly consists in reducing immunosuppression demanding reliable differentiation of PVAN from TCMR.
Typical histological characteristics of PVAN are presented in Figure 4A and are described as cytopathic signs in renal tubular epithelium with intranuclear inclusions, polyoma viremia, Simian Virus 40 positive staining of tubules, and IFTA.
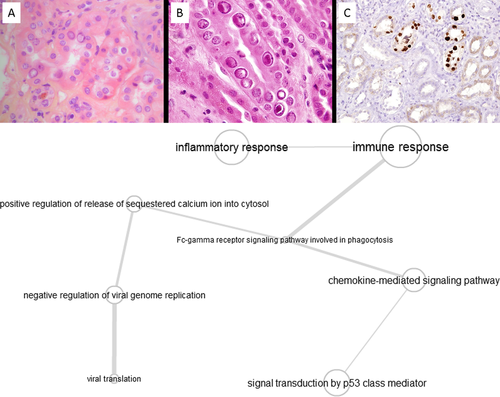
The analysis of GO-terms associated with PVAN shown in the molecular pathway map (Figure 4B) indicates that the viral response through inflammation and immune response is linked to p53 class mediators, such as membrane-associated tyrosine kinases and chemokine signaling events. Interestingly a direct link of tyrosine kinase inhibition by the drug leflunomide and BK virus inactivation has been demonstrated,48 as well as the enhanced expression of chemokines and cytokines of BK virus infected collecting duct cells.49 This inflammatory response, and the resulting infiltration with immune-responsive cells, can lead to difficulties in distinguishing PVAN from TCMR on a molecular level.12 The treemap analysis indicates that the urea cycle, through its linkage with the tricarboxylic acid-cycle/gluconeogenesis axis and other up-/down-stream events, as well as cytosolic calcium release, potentially leading to apoptosis initiation, is affected in this type of nephropathy. Although this result remains to be explored, it might hint toward abnormal or excessive cellular energy metabolism during BK nephritis, possibly due to severe acute tubular injury, and potentially be connected to exacerbated pyrimidine synthesis.50
4.5 Microarray Data-Based Pathway Analysis as a Tool for Proteomic Biomarker Selection
A multitude of biomarkers have already been described for the main complications occurring after kidney transplantation, particularly for TCMR and AMR.51 Yet, there is an unmet need for better understanding of the mechanisms driving acute and chronic alloimmune injury, immunological quiescence, operational tolerance and tissue injury. Understanding of both overlapping and unique signaling pathways of the different disease phenotypes could in turn help to define the most accurate diagnostic biomarkers and potential therapeutic targets. Complementary application of omics multivariate data analysis with systems biology data integration of molecular interaction networks and pathways might be a robust way to reach these aims. Whereas omics analysis of tissue samples and body fluids generates huge numbers of potential biomarkers, network analysis provides a selection step to reduce the number of biomarkers to those that are key markers for highly disease-specific pathophysiological processes.
Systematic understanding of a disease state on the molecular level is often restricted by the lack of depth and granularity of the associated data. In order to alleviate this bottleneck, it is possible to map both observational and measured data along with “general” prior knowledge data to a controlled and inter-linked dictionary. The information can then be used to perform a semantic analysis based on the Gene Ontology database. This database is designed in a hierarchical way, allowing to cross-reference and tie seemingly unconnected terms on levels within the dictionary hierarchy, using either the existing level order, semantic associations, or both.
In this study, we have selected ReviGO to perform this task since it has the necessary functionalities embedded in its analysis pipeline and performed our semantic clustering analysis based on the currently available AMR-, TCMR-, IFTA-, and PVAN-specific GO, IPA, and KEGG pathway lists derived from statistically appropriate gene enrichment studies on microarray data sets. By this attempt, we aimed to identify molecular pathways specific for a certain disease phenotype, and to improve understanding on how pathways are shared between the different disease phenotypes. Based on the comparison of semantic clustering by ReviGO, specific pathway categories could be observed besides common pathways of all disease phenotypes like coagulation or phagosome maturation. These are cellular defense response and caveolin-mediated endocytosis for AMR, cellular response to granulocyte macrophage colony-stimulating factor stimulus, granzyme B production, phosphatidylinositol catabolism, and hepatic stellate cell activation for TCMR, response to hepatocyte growth factor, processes associated with wound healing and response to oxidative stress for IFTA and urea cycle for PVAN. Specifically targeting hub proteins of these pathways in tissue or body fluids might be a way to establish specific biomarker signatures.
Semantic biological process clustering of biopsy microarray data was tested as a tool to connect transcriptomic analysis of biopsy samples with proteomic biomarkers search in body fluids. However, several limitations apply: only few studies with biological process information from transcriptomic tissue analysis are currently available in the field of kidney transplantation. Some of these studies have used the same microarray data sets. Nonetheless, we included all their results because shared microarray data sets were analyzed under different aspects in these studies. One such case refers to the gene sets GSE36059 and GSE48581 which were analyzed once for TCMR-specific14 and once for AMR-specific9 biological processes. In the majority of studies, specific disease entities concerned only few patients. Although all studies performed histological assessment according to the BANFF classification, it isn't clear whether only pure phenotypes were used or to what degree mixed disease features, for example, TCMR with low IFTA grades, were accepted. Low sample numbers together with a high degree of heterogeneity within the group might be the reason for the low number of biological processes shared between studies. Not all studies followed the classical discovery and validation study scheme by using one transcriptomic data set for biological process identification and another independent transcriptomic data set for subsequent validation. Finally, since some studies analyzed their transcriptomic data sets by KEGG and IPA, the resulting pathways had to be transduced to the respective ReviGO-dependent GO terms based on a QuickGO, AmiGO, and UniProt search. This may introduce bias by the inability to ensure absolute homologous matching of the different biological process nomenclatures of IPA, KEGG, and GO.
Therefore, although we provide a proof of concept that collective analysis of microarray data sets can point to disease-specific pathways, additional data sets are required for a more robust result.
5 TCMR as Showcase for the Integration of Tissue Transcriptomics and Urinary Proteomics
A number of urinary proteins and peptides have been associated with acute rejection in general (which are here also mentioned since terminology regarding TCMR was not uniform according to the Banff criteria), and TCMR in particular in several thoroughly performed studies. In the following section, we first provide a brief summary of biomarkers released from the injured kidney into the urine. We then evaluate how these are connected to the TCMR-specific biological processes that we identified in tissue transcriptome microarray datasets.
Using mass spectrometry, Sigdel et al.52 detected a number of urinary proteins with significantly different levels between stable transplant recipients and patients with acute rejection. Among these proteins they validated uromodulin (UMOD), SERPINF1, and CD44 by ELISA in an independent set of urine samples. Urinary levels of UMOD and CD44 were lower, whereas those of SERPINF1 were higher in acute rejection patients than in stable recipients. Ling et al.53 reported on the peptidome analysis in urine of pediatric renal transplants, using non-targeted MALDI-TOF analysis. They detected 630 peptide “features,” among which a panel of 40 discriminated acute rejection with 83% agreement with clinical diagnosis of acute rejection. Identification of these 40 down-regulated peptides by MALDI-TOF/TOF showed that they all originated from UMOD and various collagens. To explain these results, the authors proposed a mechanism of fibrosis caused by acute rejection with decreased collagen breakdown by collagenases in the rejecting graft and increased collagen deposition, which would ultimately lead to fibrosis. The same group54 identified urinary HLA class II protein HLA-DRB1, KRT14, HIST1H4B, FGG, ACTB, FGB, FGA, KRT7, DPP4 strongly associated with acute rejection of which FGB and FGG also enabled differentiation between acute rejection and PVAN. In the same publication, Ling et al.53 reported a panel of six urinary proteins that together constitute a sensitive and specific indicator for TCMR. Among these six proteins and protein fragments, two were collagen fragments, one was a metalloprotease (MMP7), and two were protease inhibitors. Hence, five out of six proteins in this biomarker panel were involved in extracellular matrix deposition and its remodeling. In serial urine samples of biopsy-proven TCMR patients, Loftheim et al.55 found IGFBP7, vasorin, EGF, and galectin-3-binding protein levels to be increased compared to age-matched transplant recipients with stable renal function. Using capillary-electrophoresis mass spectrometry (CE-MS) for urine biomarker discovery and monitoring, Metzger et al.56 analyzed urinary peptides in subclinical TCMR observed in protocol biopsies (i.e. without significant impairment of graft function) in comparison to cases without rejection. The rationale for using subclinical cases of rejection was to detect TCMR at an early stage, before severe, irreversible lesions have taken place. A group of 14 urinary markers was identified, which were included in a diagnostic classification model to subsequently validate it in an independent group of patients with subclinical and clinical TCMR. Sequence analysis of these biomarkers showed that they were collagen fragments (three collagen α-1 fragments and one collagen α-3 fragment), most likely the result of metalloproteinase 8 (MMP8) proteolysis. The authors further demonstrated that MMP8 was over-represented by polynuclear neutrophils on kidney biopsies of clinical and subclinical TCMR using immunohistochemistry.
5.1 Comparison of Tissue Molecular Pathways with Functional Reactome Protein Clusters for TCMR
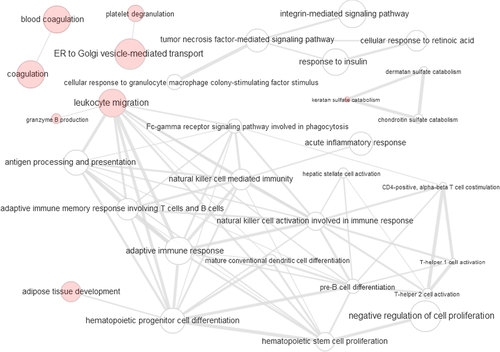
In a recent review on proteomic markers in blood and urine for TCMR, Gwinner et al.51 presented a functional Reactome interaction graph. This interaction graph revealed processes related to platelet degranulation, keratan sulphate degradation, lipid digestion, antigen presentation, and IFN-γ signaling. We integrated this interaction network of TCMR-specific proteomic markers with the tissue transcriptomics-derived interaction graph of TCMR-specific biological processes (Figure 5). When comparing the combined graph with Figure 2B presenting only transcriptomics data, there was an increase in the number of edges between the pathway nodes. This indicates that the pathways already described by transcriptomics become more tightly connected to each other when considering proteomic biomarker information. The number of novel nodes is low and these nodes are either not connected to the transcriptomic pathways, as in the case of coagulation and platelet degranulation, or located in the periphery of the interaction graph, as in the case of adipose tissue development, leukocyte migration/granzyme B production, and keratan sulphate catabolism. Therefore, we conclude that tissue transcriptomics and urinary proteomics reflect different features for TCMR that are complementary to each other. However, the available transcriptomic and proteomic data sources seem incomplete because of lacking association of immune response and inflammation pathways to coagulation and platelet degranulation, a connection which apparently exists (as reviewed by Foley and Conway57). This gap of information may be caused by the switch from an amplified intracellular PCR-based to an unamplified detection system of protein levels in body fluids. This restricts the selection of proteomic biomarkers in body fluids to abundant proteins that are subject to disease-related profound changes, either due to release or shedding from renal cell compartments or surfaces, that is, uromodulin or CD44, proteolytic release of extracellular matrix components (i.e. collagen fragments) or glomerular filtration of blood components, that is, fibrinogen or cleaved β-2 microglobulin.
6 Paving the Way to a CE-MS-Based All-in-One Differential Diagnostic Test for Renal Graft Diseases
Including both clinical and subclinical rejection episodes,56 proteomic profiling by CE-MS enabled detection of T-cell mediated tubulointerstitial rejection at an early stage of disease progression. However, differentiation of TCMR from stable kidney function is only one aspect and does not cover the full diagnostic need in kidney allograft surveillance.58 Becoming aware of this fact, implementation of CE-MS in kidney allograft surveillance was extended to AMR and its differentiation from TCMR within the international research consortium on biomarkers of renal graft injuries in kidney allograft recipients (BIOMARGIN). Including also peptide marker profiles for acute kidney injury59 and PVAN, the aim of this project is to characterize a single patient sample for all of these different disease features. For this diagnostic application, a multiparametric approach like CE-MS is ideally suited since it captures the entire urinary proteome content of a given sample in the mass range of 0.8 to 20 kDa and down to the one femtomolar scale.
Specific peptides identified in the CE-MS proteomic profiles are combined using support vector machine learning based on the comparison of a case against a control group in the initial model establishment phase. The composition of case and control groups is crucial at this point because it determines the model's classification characteristics. Applied to the setting of renal graft injury, samples of patients with mixed phenotypes and heterogeneous disease expressions can be assigned to multiple case groups. Exclusion of patients with complex, hard to differentiate disease features, that is, borderline lesions, from this modelling process is no longer necessary, eliminating the risk of introducing diagnostic gaps.
Solely relying on histological evaluation of biopsy sections as reference might cause up to 20% false group assignments that in consequence later limits the model's diagnostic performance to an accuracy below 80%.60 One way out of this dilemma is to improve the biopsy as gold standard by for example also including transcriptomics data from the tissue sample as suggested by the most recent report to the Banff classification.31 Nonetheless, it may help to identify key proteins for each disease entity based on a systems biology approach that combines tissue transcriptomics, pathway analysis and semantic clustering. In that, proteins and peptide fragments identified by proteomic analyses can then be assigned more precisely to specific pathophysiological networks and disease phenotypes.
For clinical application, such a proteomic marker panel should cover the entire spectrum of major allograft disease phenotypes, particularly TCMR, ABMR, IFTA, and PVAN to qualify for a “one-time box stop” of diagnosis making and to identify those patients who need more attention and further workup by allograft biopsy and possibly, therapeutic action. Evaluation of such a molecular diagnostic tool in a properly powered longitudinal prospective trial is mandatory to proof its additional value.61
Acknowledgements
D.M., J.M., W.G., and S.C. contributed equally to this work. J.M. and W.G. were supported by grant 305499 from the BIOMARGIN FP7-HEALTH EU-project and by the Bundesministerium für Bildung und Forschung (BMBF), under the frame of ERACoSysMed-2, the ERA-Net for Systems Medicine in clinical research and medical practice (project ROCKET; 2018). S.F. was supported by a grant from the University Hospital of Toulouse (AOL 2016 – Bioclack)
Conflict of Interest
Jochen Metzger and Iwona Belczacka are employees of the biotechnology company mosaiques-diagnostics GmbH located in Hannover, Germany.


