Selective Killing of Human Breast Cancer Cells by Plasma-Treated L-Arginine Solution
ABSTRACT
l-arginine is a nonessential amino acid that plays an important role in normal immune function and can be used as an adjuvant treatment for cancers. The antitumor effect of nonequilibrium atmospheric pressure plasma treated l-arginine solutions (PTA) was investigated in this research. The cancer-specific killing effect of PTA on human breast epithelial cells (MCF-10A) and human breast cancer cells (MCF-7) was proved. Liquid chromatography-tandem mass spectrometry was used to analyze the organic compounds formed in PTA, and their effects were individually evaluated by MTS assay, revealing that some compounds inhibited cell proliferation but lacked selectivity. PTA's selective cytotoxicity may result from a mixture of various compounds formed in plasma combined in a certain concentration.
Abbreviations
-
- AC
-
- alternating current
-
- DM
-
- diethyl maleate
-
- DMEM
-
- Dulbecco's Modified Eagle Medium
-
- EPR
-
- electron paramagnetic resonance
-
- FBS
-
- fetal bovine serum
-
- LC-MS/MS
-
- liquid chromatography-tandem mass spectrometry
-
- MCF-10A
-
- Michigan Cancer Foundation Cell Line 10A
-
- MCF-7
-
- Michigan Cancer Foundation Cell Line 7
-
- MD
-
- N-methyl diethanolamine
-
- NEAPP
-
- nonequilibrium atmospheric pressure plasma
-
- OES
-
- optical emission spectroscopy
-
- PA
-
- picric acid
-
- PAL
-
- plasma-activated lactate
-
- PDA
-
- photodiode array
-
- PTA
-
- plasma-treated l-arginine
-
- RONS
-
- reactive oxygen and nitrogen species
-
- TWC
-
- total wavelength chromatograms
1 Introduction
The potential application of nonequilibrium atmospheric pressure plasma (NEAPP) in cancer treatment is highly promising. Both direct irradiation of cancer cells and the indirect use of activated solutions resulting from plasma irradiation may serve as adjuncts in cancer therapy [1-7]. NEAPP comprises electrons, positive ions, and neutral particles, presenting an overall electrically neutral state. While positive ions and neutral particles have temperatures close to room temperature, the electron temperature is much higher, over 104K, resulting in a nonequilibrium plasma state [8]. These unstable positive ions and excited neutral particles can initiate a series of reactions at the gas-liquid interface and within the liquid phase, generating numerous free radicals, chemicals, and reactive oxygen and nitrogen species (RONS) [9]. It was shown that RONS may lead to cell death [10-15].
Both plasma-activated lactate (PAL, obtained by NEAPP irradiation of lactic acid Ringer's solution) and plasma-activated acetate (PAA, obtained by plasma irradiation of acetic acid Ringer's solution) have been experimentally shown to exhibit selective in vitro cytotoxicity against the human breast cancer cell line MCF-7 [16-18]. These works suggested that plasma irradiation accelerated the decomposition and dehydrogenation of precursor organic compounds, resulting in the formation of plasma-activated organic compounds in PAL and PAA that induce cell cytotoxicity. When the resulting organic acids were evaluated individually for their activity against cancer cells and normal cells, one compound, 2,3-dimethyltartrate, clearly demonstrated selective cytotoxicity [19].
In several types of plasma-activated solutions, the direct cytotoxic effect of RONS has been attributed primarily to hydrogen peroxide (H2O2), although the concentration of nitrite ions (NO2−) also contributes to these properties [20-23]. However, the cytotoxic effect on cancer cells of NO2− alone is not significant [21]. Nevertheless, the presence of H2O2, NO2− enhances the cytotoxic effect of H2O2 [24]. Other work has shown that the selective killing activity of PAL solution is stronger when using a gas mixture of Ar/O2/N2 for NEAPP exposure compared to when using a gas mixture of Ar/O2; this result indicates that nitrogen-derived compounds have an auxiliary role in the killing of cancer cells by plasma-activated solutions [25]. l-arginine is an amino acid that contains four nitrogen atoms, which may provide a nitrogen source for RONS and hence, the potential for inducing selective cancer cell death. In previous studies, the generation of nitrogen-containing compounds following NEAPP exposure was attributed to the nitrogen gas used in the plasma discharge [16, 17, 26, 27]. In the present work, we sought a method for a more efficient introduction of nitrogen into plasma-activated solutions by using l-arginine solutions of different concentrations. In humans, l-arginine is a non-essential amino acid involved in various metabolic processes, immunity, cardiovascular diseases, sexual function, and cancer therapy [28-30]. The levels of arginine in the body are significantly decreased in patients with certain malignancies; strategies to increase arginine levels have been shown to counteract tumor growth [31-33]. Exogenous l-arginine inhibits the MCF-7 cell proliferation in vitro and also assists breast cancer therapy in vivo by enhancing innate and adaptive immune responses [34, 35].
In the present work, we analyzed the cytotoxicity of plasma-treated l-arginine (PTA). Specifically, we tested the effects on normal and cancer cells of plasma-treated l-arginine solutions of two different concentrations (10 and 474.7 mM). This work confirmed that PTA solutions exhibit stronger cytotoxicity towards human breast cancer cells (MCF-7) than on human mammary epithelial cells (MCF-10A). The mechanism of the PTA selective killing effect on cells was investigated by Liquid Chromatography coupled with tandem Mass Spectrometry (LC-MS/MS) and Electron Paramagnetic Resonance (EPR) to identify radicals formed in plasma and newly generated organic compounds. The colorimetric assay was employed for the quantification of H2O2, NO2−, and NO3− levels and for understanding their role in the PTA-killing effect. In vitro cytotoxicity of the newly formed chemical compounds in PTA, both individually and in mixture solutions, was investigated.
2 Experimental Sections
2.1 Plasma Source Equipment, Parameter Settings, and Sample Preparation
The plasma source equipment (Fuji Co. Ltd. Aichi, Japan) was equipped with a purge system that employed a 300-sec pulse of argon gas to decrease the oxygen level to below 0.2% while maintaining the stable gas ratio, as set. The experimental configuration is shown schematically in Figure 1a. The plasma was generated by using an AC power supply (9 kV, 60 Hz) to ignite an 8:1:1 gas mixture ratio of argon, nitrogen, and oxygen gases; the total flow rate was two standard liters per minute. The distance between the plasma nozzle and the sample liquid surface was set to L = 19 mm, while the irradiation time was 5 min, similar to the previous research [25, 36, 37]. To investigate the effects of PTA at low and high concentrations, 10 mM and 474.7 mM solution concentrations were prepared and irradiated. Therefore, 21.066 mg l-arginine HCl (C6H14N4O2・HCl) (Peptide Institute Inc. Osaka, Japan) was formulated in 10 mL ultrapure water to get the solution of 10 mM, while 1 g l-arginine HCl (C6H14N4O2・HCl) in 10 mL ultrapure water was used to obtain the solution of 474.7 mM. The PTA solutions were generated by irradiating the l-arginine solutions for 5 min with Ar/O2/N2 plasma.

2.2 Optical Emission Spectroscopy (OES)
OES was employed to measure the excited species formed in the Ar/O2/N2 plasma. As shown in Figure 1b, the l-arginine solution was placed 19 mm under the plasma nozzle. Light emitted from the plasma was collected through an optical fiber placed at 5 mm above the liquid level, and the optical emission spectra were collected using a spectrometer (USB 4000, Ocean Optics, Florida, USA) with the software SpectraSuite, Ocean Optics, Florida, USA.
2.3 Colorimetric Assay
H2O2, NO2−, and NO3− were quantitatively detected using the PACKTEST detection kits (WAK-H2O2, WAK-NO2, and WAK-NO3; Kyoritsu Institute of Physical and Chemical Research, Tokyo, Japan) according to the manufacturer's instructions. Briefly, an aliquot (1.5 mL) of 100-fold diluted 10 mM and 474.7 mM PTA samples were introduced into the test pack and mixed thoroughly to initiate a reaction with the reagent. After 2 min, the sample concentration was quantified using a colorimetric device detector [17] equipped with a digital water analyzer (DPM-MTSP, Kyoritsu Institute of Physical and Chemical Research).
2.4 Cell Lines and Cell Culture
MCF-7, a tumorigenic cell line derived from human breast cancer, and MCF-10A, a cell line derived from normal (untransformed) human mammary epithelium, were purchased from the American Type Culture Collection (ATCC, Manassas, VA, USA). The MCF-7 cells were cultured in Dulbecco's Modified Eagle Medium (DMEM; Catalog D5796; Millipore/Sigma-Aldrich, St. Louis, MO, USA) supplemented with 10% fetal bovine serum (FBS) (ThermoFisher Scientific, Waltham, MA, USA) and 1% Penicillin-Streptomycin (P/S, a stock solution of 10,000 units/mL penicillin and 10,000 μg/mL streptomycin; ThermoFisher Scientific/Life Technologies, Grand Island). The MCF-10A cells were cultured in the culture medium formulated using the Mammary Gland Epithelial Cell Growth Medium Bullet Kit (MEGM; Catalog CC-3150; Lonza, Basel-Stadt, Switzerland) and were supplemented with 100 ng/mL of cholera toxin (Catalog 030-20621; Wako Chemical Co. Ltd. Osaka, Japan). For both lines, the growth conditions consisted of incubation at 37°C in a 5% CO2 environment, as detailed in our previous work [17].
2.5 Measurement of Cell Viability
Cells were plated at 5000 cells/well in 96-well plates. After 24 h of growth, the medium was replaced with a serially diluted l-arginine solution in unsupplemented DMEM, or PTA serial dilutions with unsupplemented DMEM to provide an osmotic environment for cell survival, and the plates were placed in the incubator. After 2 h of incubation, the medium again was replaced by fresh, unsupplemented DMEM to avoid the cytotoxicity of PTA that may be weakened by the supplemented medium and to observe the short-term effect of PTA. Plates were further incubated for 24 h, and the cytotoxicity of the PTA solution was then evaluated using the CellTiter 96 Aqueous One Solution Cell Proliferation Assay Kit (Promega, Madison, WI, USA) according to the manufacturer's instructions. This kit assesses cell proliferation and cytotoxicity by a colorimetric assay, detecting the ability of live cells to convert 3-(4,5-dimethylthiazol-2-yl)-5-(3-carboxymethoxyphenyl)-2-(4-sulfophenyl)-2H-tetrazolium (MTS) to a formazan product, which is detected as absorbance at 490 nm by a plate reader (Figure 1c). The same procedure was used to assess the cytotoxicity of individual chemical compounds identified in the PTA solution by LC-MS/MS. Specifically, we assessed the effects of picric acid (C6H3N3O7, ≥ 98% purity, Millipore/Sigma-Aldrich), N-methyldiethanolamine (C5H13NO2, ≥ 99.5% purity, Millipore/Sigma-Aldrich), 3-hydroxy-5-(hydroxy methyl)-2-methylisonicotinaldehyde oxime (C8H10N2O3, ≥ 98% purity, TCI), and diethyl maleate (C8H12O4, 97% purity, Millipore/Sigma-Aldrich). For these assays, the individual compounds were formulated and serially diluted in unsupplemented DMEM to generate solutions at concentration ranges ranging from 0.01 to 20 mM. For the combination assays (used to assess the combination effects), mixtures of compounds were formulated at the indicated concentrations and serially diluted in unsupplemented DMEM in the same manner.
2.6 Electron Paramagnetic Resonance (Epr)
The detection of free radicals generated in PTA was conducted by the spin-trapping method using a nitroso spin trap consisting of 3,5-dibromo-4-nitrosobenzene sulfonic acid, sodium salt (DBNBS; Kyoto-Spinlabo Co. Ltd. Kyoto, Japan). Briefly, a suitable volume (8 mL) of 474.7 mM l-arginine was mixed with 100 μL of 10 mM DBNBS and irradiated with plasma. Immediately following plasma exposure, the samples were transferred to a glass capillary tube (Catalog VC-HO75P; Terumo, Tokyo, Japan), the capillary tube was inserted into a special quartz tube in an EPR spectrometer (Model RFR-30; Radical Research Inc. Tokyo, Japan), and the EPR spectrum was recorded at room temperature. The experimental conditions were as follows: scanning time, 4 min; time constant, 0.3 s; amplitude, 5 × 10²; microwave power, 4 mW; field modulation frequency, 100 kHz; field modulation width, 0.1 mT; frequency, 9.420 MHz; and center field, 329.6 mT. The yields of spin adduct were determined by comparison to the spectrum for a standard of 4-hydroxy-2,2,6,6-tetramethyl-1-piperidinyloxyl (TEMPOL), a stable nitroxide radical. The EPR spectrum of the spin adducts with DBNBS presented characteristics that were sufficiently detailed that the hyperfine coupling constants (HFCCs) could be determined directly from the experimental spectra. Simulation of the measured spectra was performed using the EasySpin software package [38].
2.7 Liquid Chromatography Coupled to Tandem Mass Spectrometry (LC-MS/MS)
The organic compounds in PTA were analyzed by LC–MS/MS on a SCIEX X500 QTOF mass spectrometer (CB21311709, AB Sciex, USA) equipped with a Turbo VTM Ion Source (Electrospray Ionization; ESI), two ExionLC AC pumps, ExionLC AC Autosampler (Cat. No. 5036650), and PDA detector (5036657) manufactured and distributed by AB Sciex, USA). The chromatographic separation was performed on a 150 mm × 2.1 mm Sypron AX-2 column ((particle size, 5 µm; GL Sciences, Tokyo, Japan). The column temperature was set to 40°C. Mobile Phase A consisted of a 50:50 mixture of high-performance LC (HPLC) -grade H2O and acetonitrile (CH3CN), and Mobile Phase B is 50 mM aqueous solution of ammonium formate (NH4HCO2). The reagents used to formulate these phases were obtained from Kanto Chemical Co. Inc. (Tokyo, Japan). The mobile phases were delivered at a flow rate of 0.20 mL/min. The injection volume was 1 µL, and the total run time was 10 min.
The formation of DL-enantiomers in PTA solutions was investigated using a 150 mm × 4.6 mm Sumichiral OA-5000L column (particle size, 5 µm; Sumika Chemical Analysis Ltd. Osaka, Japan) equipped with the above-noted ExionLC AC PDA detector. The mobile phase consisted of a 98:2 mixture of 2 mmol/L copper sulfate and 2-isopropanol delivered at a flow rate of 1 mL/min. The injection volume was 2 µL, and the total run time was 10 min.
The instrument was operated in negative-ion mode. The experimental curtain gas was set at 25 psi, the ion spray voltage at −4500 V, and the heater gas temperature at 300°C. Nitrogen was used as the collision gas. The experimental parameters and measurements were described in detail in our previous reports [7, 17].
The LC-MS/MS measurements were performed for both control (untreated) and plasma-irradiated solutions of 10 and 474 mM l-arginine. Nonirradiated samples of the individual substances identified in plasma were prepared as described above for use in the cytotoxicity assay (Section 2.4). Ultra-pure water was obtained using a Milli-Q Direct-Q 3 UV Remote Water Purification System (Millipore/Sigma-Aldrich). The concentrations of the compounds found in plasma-irradiated samples were calculated using linear regression for the calibration curves generated for the nonirradiated compounds listed above, using the Sciex OS Analytics software (version 1.3); Danaher/AB Sciex), as described in our previous work [17].
2.8 Statistical Analysis
MTS assays were performed in one independent experiment with six biological replicates. The cell viability data for PTA and compounds identified in LC-MS were analyzed by the two-tailed Student's t-test in Microsoft Excel, and the graphs presented the standard error of the mean. Differences were considered statistically significant when the p < 0.05. Limited dose response was investigated by using the Bliss independence simulation program [39] to model the synergy effect of the chemical combinations.
3 Results and Discussion
3.1 Results
3.1.1 Gas-Phase Species Analysis in Plasma
Optical emission spectroscopy was employed to identify excited species formed in Ar/O2/N2 plasma. The emission spectrum at typical discharge conditions mainly consists of the OH rotational bands (OH A2Σ → X2Π (0, 0) and (1, 0) bands at about 309 nm), the atomic oxygen (3p5P → 3s5S0 at 777.5 nm and 3p3P → 3s3S0 at 844.6 nm) emission lines, the numerous Ar lines (3p54p[1/2] → 3p54s[3/2] at 763.5 nm and 3p⁵4 s → 3p⁵3p at 811.5 nm), and O bands/lines. The nitrogen rotational bands from the Second Positive System (337.1 nm and 357.7 nm), as well as the NH (A-X) rotational band and weak NO A2Σ+ → X2Π bands from γ-system (in the 220–260 nm range) were detected, as shown in Figure 2, as well as in one of our previous work [25]. Therefore, in Ar/O2/N2 plasma, reactive species are generated that may lead to RONS and other chemically active compound formation, responsible for a selective cytotoxic effect on cancer cells. The identification and formation pathways of these compounds were investigated and are further presented in this work.

3.1.2 Measurement of RONS Concentration in PTA samples
PTA (10 mM Arg) and PTA (474.7 mM Arg) were obtained by irradiating l-arginine solutions (of the indicated concentration) for 5 min using the methods described above (Sections 2.1 and 2.3). The H2O2, NO2−, and NO3− concentrations of the resulting PTA solutions are shown in Table 1. Both PTA (10 mM) and PTA (474.7 mM) samples exhibited similar H2O2 concentration levels of approximately 2500 μM, but this behavior could not be observed in the case of NO2− and NO3− species. Specifically, the NO3− concentration in PTA (474.7 mM) was 9838.71 μM, 9.8-fold higher than that in PTA (10 mM). The NO2− concentration in PTA (474.7 mM) was 1108.7 μM, at least four orders of magnitude higher than that in PTA (10 mM), although the actual difference value could not be determined because the NO2− concentration in PTA (10 mM) was below the detection limit (1 μM) of the device.
| Solution | H2O2 [μM] | NO2 − [μM] | NO3− [μM] |
|---|---|---|---|
| PTA (10 mM) | 2470.58 | Undetected | 1000 |
| PTA (474.7 mM) | 2500 | 1108.7 | 9838.71 |
3.1.3 Effect of PTA and Untreated L-Arginine Solutions on Normal and Cancer Cells
The MTS assay was used to assess the cytotoxicity of PTA on both a breast cancer cell line (MCF-7) and a non-tumorigenic epithelial cell line (MCF-10A). The control (untreated) l-arginine solution and PTA solution were tested at multiple dilutions using unsupplemented DMEM.
The MTS assay showed that the untreated l-arginine had no cytotoxic effects on either the cancer cells or normal cells at Arg concentrations below 118.7 mM (Figure 3a). The cytotoxicity observed at higher concentrations of l-arginine presumably reflected dehydration and killing of the cells due to osmotic pressure and acidity. In contrast, the PTA (10 mM) samples (Figure 3b) exhibited a strong killing effect on both MCF-7 and MCF-10A at l-Arg concentrations ranging from 0.5 to 10 mM; selective killing (of MCF-7 but not of MCF-10A) was observed only at 0.05 and 0.1 mM l-Arg concentrations. For the PTA (474.7 mM) samples (Figure 3c), cell killing was seen in both cell lines at l-Arg concentrations ranging from 14.8 to 474.7 mM. A selective killing was observed only for the 7.4 mM l-Arg solution.

Although the PTA (10 mM) and PTA (474.7 mM) samples demonstrated selective killing effects, there were differences between these irradiated solutions that will be discussed in Section 3.2.1. Notably, the selectivity of PTA (474.7 mM) was observed only for the 64-fold dilution, while that of PTA (10 mM) samples was observed for both the 100-fold and 200-fold dilutions. In the case of the PTA (474.7 mM), dilution ratios exceeding 64-fold resulted in cell viabilities (for both cell lines) of less than 80%, while the PTA (10 mM) sample showed cell viabilities (in both cell lines) of approximately 100%. Therefore, PTA (10 mM) showed selective killing at a wider range of dilutions and concentrations, but PTA (474.7 mM) showed higher cytotoxicity.
These results indicated that the PTA solutions exhibit higher cytotoxicity than the PAL (27.7 mM) (Supporting Information S1: Figure S1a) used in our previous work [16], even when the same configuration and parameters were used to generate the plasma. Notably, MCF-7 viability was 25.93% ± 10.8% with the 64-fold dilution of PAL (27.7 mM) but 6.48% ± 1.88% with the 100-fold dilution of PTA (10 mM), indicating that PAL (27.7 mM) had lower cytotoxicity than PTA.
To investigate whether this effect is related to the molecular structure of the solution components, we investigated the formation of enantiomers in plasma-irradiated solutions and evaluated the cytotoxicity of these individual chemicals. The d-arginine enantiomer, which exhibits an opposite optical activity than that of l-arginine, is thought to contribute only minimally to human physiology. Nonetheless, to address the possible role of d-Arg on cell viability, we prepared a plasma-treated d-arginine solution and assessed its cytotoxicity using the same assay method as that used above. Notably, plasma-treated d-arginine solution exhibited selective killing at a higher concentration (0.5 mM, 20-fold) than PTA. Specifically, the selectivity was observed for the 20-fold (0.5 mM) plasma-treated d-arginine, but no significant selectivity was displayed when the cells were incubated with 100-fold (0.1 mM) plasma-treated d-arginine (Figure 3d). On the other hand, the MCF-7 cell line exhibited cell viability of 6.48% ± 1.88% for the 100-fold diluted (0.1 mM) PTA (10 mM) sample (Figure 3b), with significant selectivity for cancer cells (p < 0.001). These results demonstrated that plasma-treated l-arginine has a stronger selective killing effect than does the plasma-treated enantiomer, indicating that a possible formation of d-arginine from l-arginine during irradiation would not be the cause of PTA's selective cytotoxicity against cancer cells.
3.1.4 Free Radical Detection Using EPR-Spin Trapping
To investigate free radicals formed by plasma irradiation, an aqueous solution of l-arginine (474.7 mM) supplemented with a water-soluble non-volatile spin trap (DBNBS) was exposed to Ar/O2/N2-plasma and subjected to electron paramagnetic resonance (EPR) analysis and spin trapping. The DBNBS spin trap agent permits the characterization of radicals centered on carbon atoms, as assessed by spin adducts detected in the EPR spectra of multiple species [40, 41]; these spectra are much less sensitive to radicals centered on oxygen [42]. The EPR spectra of spin-adducts formed with DBNBS by plasma treatment of l-arginine solutions are shown in Figure 4a.

Quantum calculations were performed using the method and basis functions of UMP2(full)/aug-cc-PVDZ under the solvent of water with Gaussian 16. The molecular structures of the radicals were fully optimized, and the frequency analysis with the structures detected no imaginary frequencies. The calculated enthalpy of formation for the reaction of RH → R• + H• for three alkyl radicals of l-arginine and HFCCs of the α-protons on the alkyl radicals are shown in Figure 4b and Table 2.
| Entry | R• | Enthalpy of formation/kJ mol–1 | Isotropic HFCC/mT |
|---|---|---|---|
| 1 |  |
372.97 | −0.82 |
| 2 | 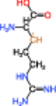 |
378.55 | −1.92 |
| 3 | 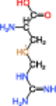 |
384.86 | −1.99 |
The radical of Entry 1 was the most stable; this molecule exhibited the smallest absolute value of HFCC due to the delocalization of an unpaired electron to the ▬NH(C 〓 NH)NH2 group. The HFCCs of the radicals of Entries 2 and 3 were similar to each other, with the absolute values of these HFCCs exceeding that of the radical of Entry 1. We inferred that the DBNBS spin-adduct with a smaller HFCC (0.265 mT, corresponding to one β-proton) is the adduct of the radical of Entry 1. The spin-adduct with a larger HFCC (0.688 mT, corresponding to one β-proton) is likely the adduct of the radical of Entry 2 or 3. Based on the enthalpy of formation, we consider the radical of Entry 2 to be the more plausible candidate (of the two) for this spin-adduct.
3.1.5 Chemical Compounds Identification by LC-MS/MS
Total ion chromatograms (TICs) were obtained for both the control (untreated) and PTA samples. The main peak in the TIC of the l-arginine (10 mM) solution, a feature that corresponds to l-arginine, eluted at a retention time (RT) of 1.2 min. Some additional fragments eluted at RT 7.43 min (Figure 5a). The PTA (10 mM) sample showed the same l-arginine peak at RT 1.2 min, along with additional peaks at RT 1.55 min and 2.8 min. The novel peaks presumably corresponded to new compounds formed by plasma exposure. The control l-arginine (474.7 mM) solution exhibited two peaks (RT 1.26 min and 1.47 min) also corresponding to l-arginine, albeit at a higher concentration, while the peak at 6.3 min presumably corresponded to arginine fragments generated during the analysis (Figure 5b). The TICs of the PTA samples showed an additional peak at RT 1.58 min, along with novel peaks corresponding to compounds newly formed by plasma exposure. The peaks in the PTA (474.7 mM) exhibited a slight shift to higher RT values than those seen in the PTA (10 mM) TIC, reflecting increased peak widths resulting from the higher l-Arg concentration.

The mass spectra of control (untreated) 10 and 474.7 mM l-arginine solutions, as well as those of PTA (10 mM) and PTA (474.7 mM), are shown in Figure 6a,c. The most prominent MS peak (m/z 173.01) corresponded to l-arginine and was seen in both the control and PTA solutions at both l-Arg concentrations. Notably, the area of this peak in the PTA (10 mM) sample following plasma discharge was 6.78% lower than that in the control sample, with the concentration of l-arginine in the solution decreasing to 9.35 mM after plasma exposure. The arginine percentage of the PTA (474.7 mM) sample was 11.17% lower than that in the respective control sample, indicating that the concentration of l-arginine in this solution decreased to 460 mM after plasma exposure. The fragment ions at m/z 131.08 formed after collision-induced dissociation were also observed in the spectra (caused by the loss of an acetyl group). Extracted ion chromatograms (XICs) for the untreated (control) 10 mM l-arginine and the PTA (10 mM) solutions included a major peak at RT 1.25 min, corresponding to the l-arginine in both samples. In the untreated 474.7 mM l-arginine and the PTA (474.7 mM) solution, the major peak was seen at RT 1.46 min, again corresponding to the l-arginine (Figure 6b,d).

The mass spectra of the control and plasma-treated compounds were compared and analyzed using the Sciex OS software (Analytics) of the LC-MS/MS system. The new peaks and m/z values displayed in the table were analyzed, considering the fragments and the exact mass of each compound, and the chemical structure established. Accordingly, commercial compounds were purchased, and the retention time, m/z, and extraction ion chromatograms were analyzed.
Compounds were identified only in the mass spectra of the PTA samples, including methyl diethanolamine ([C5₅H12NO2-H]−, m/z 118.05) decitabine ([C8H11N4O4-H]−), m/z 227.80), 2-pyrrolidinone ([C4H6NO-H]−, m/z 84.04), maleic hydrazide ([C4H3N2O2-H]−, m/z 112.04), diethyl maleate ([C8H11O4-H]−, m/z 171.06), and picric acid ([C6H2N3O7-H]−, m/z 227.79) (Supporting Information S1: Figure S2). The cytotoxicity of these individual compounds was, therefore, tested by the MTS assay and will be further discussed in this work.
The formation of enantiomers was investigated for the control and plasma-irradiated l-arginine solutions. Total-wavelength chromatograms (TWCs) of a 10 mM DL-arginine solution showed that the d-arginine peak was detected at RT 1.9 min and the l-arginine peak at RT 2.22 min (Figure 7a). The 10 mM d-arginine control sample showed the peak eluted at RT 1.9 min, while the l-arginine 10 mM solution (untreated by plasma) was eluted at RT 2.22 min (Figure 7a). In contrast, neither the PTA (10 mM) nor PTA (474.7 mM) contained a peak corresponding to the d-peak (Figure 7b), indicating that plasma does not induce the formation of d-arginine in the irradiated solution.

3.1.6 Cytotoxicity of Individual Compounds Identified by LC-MS/MS
To better understand the contribution to the antitumor activity of the novel species detected in the PTA solutions, we repeated the MTS assay with the corresponding individual compounds, as obtained from commercial sources. Specifically, stock solutions of growth medium containing these compounds were prepared for a range of concentrations (from 0.01 to 20 mM). Then, cells were incubated for 2 h in the resulting growth medium using the same protocol as described above for the PTA samples. Among the tested compounds, only 3-hydroxy-5-(hydroxy methyl)-2-methylisonicotinaldehyde oxime ([C8H9N2O3-H], m/z 203.08) demonstrated selective killing of the cancer cells (Figure 8c), decreasing the MCF-7 viability to 81% ± 6.27% and 66.7% ± 6.26% at concentrations of 5 and 10 mM, respectively, and slight growth promotion in MCF-10A. However, these differences between the cell lines fell short of statistical significance. The methyl diethanolamine exhibited cytotoxicity at relatively high concentrations (1 ~ 5 mM) for both cell lines and, therefore, a lack of selectivity (Figure 8a). In contrast, picric acid appeared to promote the growth of the MCF-7 cell line (Figure 8b).

4 Discussion
4.1 Selective Cytotoxicity of PTA
The 100-fold diluted PTA (10 mM) solution (Figure 3b) had stronger cytotoxicity against MCF-7 than did the 64-fold diluted PAL (Supporting Information S1: Figure S1a), the subject of our previous research [16]. These differences may reflect the different types of reactive species and chemically active compounds formed in PTA and PAL. Compared to the sodium lactate in PAL, the l-arginine in PTA contains larger numbers of carbon or nitrogen functional groups, potentially enhancing the formation of novel compounds. Additionally, we observed that the ratios of l-arginine and RONS (following dilution) in PTA (474.7 mM) differed from those in PTA (10 mM). Notably, in contrast to the case of PTA (10 mM), the concentration of l-arginine in PTA (474.7 mM) was still high enough (after dilution) to promote cell viability and support cell proliferation, presumably because the l-arginine in PTA (474.7 mM) was not entirely decomposed after the 5 min plasma exposure. Although both PTA (474.7 mM) and PTA (10 mM) had the same H2O2 concentration approximately 2500 μM, the concentration of l-arginine in PTA (10 mM) (after dilution) may not support cell proliferation, leading to the wider concentration range (0.1–0.05 mM; 100- to 200-fold dilution) over which PTA (10 mM) showed selective killing of the cancer cells. With the PTA (474.7 mM) sample, cytotoxicity was seen across a range of 7.42–0.93 mM (2 to 64-fold dilution). The cell viability plateaued at approximately 80%, the growth promotion being possibly sustained by the remaining l-arginine, despite the toxic effects of newly formed radicals (Figure 3c).
The l-arginine and d-arginine enantiomers, sharing the same molecular formula, possess different spatial configurations. Notably, plasma-treated d-arginine solution showed less selectivity of killing against the cancer cell line (Figure 3d). Specifically, exposure of MCF-7 to plasma-treated d-arginine at 0.1 mM resulted in cell viability of 81.38% ± 24.95% with no significant selectivity of killing. In contrast, exposure of this cell line to PTA (10 mM) at 0.1 mM resulted in cell viability of 6.48% ± 1.88% with significant selectivity of killing (p < 0.001) (Figure 3b). The more limited cytotoxicity and lack of selective killing effect seen for the D- isomer presumably reflect the L- isomer bias of biomolecules; for instance, the cells preferentially uptake the l-arginine rather than the d-arginine [43]. Clearly, the structure of amino acids relates to their effects on cells.
4.2 Possible Chemical Formation Pathway Following Plasma Irradiation
Changes in the mass spectra were used to identify several compounds that were newly formed in the l-Arg solution following plasma exposure. These chemicals included picric acid, methyl diethanolamine, maleic hydrazide, 2-pyrrolidinone, and alloxan (Supporting Information S1: Table S1). Most of them did not show a killing effect which was confirmed by MTS assay. Because of particle collisions in the gas and liquid phase, chemical bonds are broken, and new compounds are formed. Notably, plasma irradiation generates a variety of radicals and functional groups (such as carboxyl groups, hydroxyl groups, methyl groups, and methylene groups), which contribute in turn to the formation of organic molecules that are smaller in size than the parent compound. During irradiation with NEAPP, collision with high-temperature thermal electrons and reactive species causes chemical bond cleavage, including dehydrogenation and oxidation, resulting in the formation of new compounds containing aromatic structures [44]. Here, we consider how the observed compounds might be formed following plasma exposure.
Picric acid was detected in PTA at m/z 227.79. The main method for obtaining picric acid is by nitration of benzene, phenol, or mononitrophenol [45, 46]. When a liquid is irradiated with plasma, hydrogen peroxide is formed as an oxidant. The peroxide reacts with benzene to produce phenol. Subsequently, through nitration reactions, phenol reacts with nitrate ions (NO2-) generated in the plasma discharge process. This process introduces nitro groups into the phenol molecules, generating nitrophenol. Upon repeated introduction of nitrate ions, picric acid is formed (Figure 9a), as was detected in PTA by LC-MS/MS.

Methyl diethanolamine was detected in PTA at m/z 118.04. This compound potentially may have been formed through the introduction of additional hydroxy-containing moieties into the precursor 2-(methylamino)ethanol, which was also detected at m/z 74.04 [47]. Alternatively, during the oxygen-containing heterocycle ring-opening reaction leading to the formation of hydroxyl groups, nitrogen-hydrogen bonds in the secondary amine of the precursor 2-(methylamino) ethanol may have been replaced, resulting in the formation of a tertiary amine with two hydroxyl groups and one methyl group (Figure 9b).
Diethyl maleate was also detected at m/z 171.06. We hypothesize that this compound may be generated through the oxidation of benzene to generate maleic anhydride, which would further react with ethanol (in an acidic environment) to yield diethyl maleate [48].
When the l-arginine solution is irradiated by plasma, various cyclic compounds may be formed, as illustrated in Supporting Information S1: Figure S5. The oxidation of the benzene ring would lead to the formation of maleic anhydride (m/z 112.04) [49]. The amino group (▬NH2) then may react with the carbonyl group (C 〓 O) of succinic anhydride, resulting in the adduct maleic hydrazide [50]. Dehydration of 1,4-butanediol would result in a ring formation, such that the introduction of an amino group (▬NH) would generate 2-pyrrolidinone (m/z 84.04) [51, 52]. Active amino groups in the plasma-irradiated liquid may react with organic acids, producing barbituric acid, which would be oxidized further to yield alloxan monohydrate (m/z 160.07) [53-55]. Indeed, all three of these products were detected (by LC-MS/MS) in the PTA solutions.
4.3 Synergistic and Antagonistic Effects of Chemical Compounds on Cancer Cells
When tested individually, the newly formed compounds detected in PTA exhibited distinct effects on the growth of MCF-7 and MCF-10A cells. Specifically, 3-hydroxy-5-(hydroxy methyl)-2-methylisonicotinaldehyde oxime was cytotoxic to MCF-7. The methyl diethanolamine was cytotoxic to both MCF-7 and MCF-10A cells, while picric acid appeared to promote the growth of both cell lines. Clearly, these compounds were not sufficient to induce the selective cytotoxicity seen with PTA. We, therefore, investigated the effects (against the cell lines) of mixtures of these compounds, using concentrations representative of those observed in PTA. Given that the concentrations of these compounds in PTA were below 5 μM, we spiked several of the compounds of interest in control (plasma-untreated) l-arginine (20 mM). Notably, mixtures of picric acid (PA), diethyl maleate (DM), and N-methyl diethanolamine (MD) (Figure S3) demonstrated cytotoxicity when spiked in l-Arg solution at concentrations ranging from 0.5 to 20 mM. The serial dilutions of the resulting mixtures result in loss of cytotoxicity, and the concentration of each compound and their killing concentration range are shown in Table 3. We combined PA, l-arginine, DM, and MD at some concentration to investigate these chemicals’ effects working together, and the results of selective killing effects are shown in Figure 10. Further cytotoxicity assays conducted with various dilutions and concentration ranges revealed that only certain concentrations and ratios were able to induce a selective killing effect against cancer cells (Supporting Information S1: Figure S6). Additional studies will be needed to understand the complex mechanisms behind the formation of new molecules during plasma irradiation and the effect of these compounds on cells.
| Dilution | Killing concentration | Selective concentration | |
|---|---|---|---|
| Picric acid (PA) | 0.05–20 mM | — | 1 mM |
| diethyl maleate (DM) | 0.05–20 mM | 5–20 mM | — |
| Methyl diethanolamine (MD) | 20–0.05 mM | 20–5 mM | — |

According to the theoretical calculations, EPA:DM:A < EPA:DM:A actual, so the effect of PA, DM, and l-arginine is synergistic. The theory and the actual E values were all listed in Table S3 and the data of each compound were listed in Table S2. l-arginine showed no significant killing effects on cells, and the concentrations were not the same as the other three compounds, so the viability of cells under the influence of l-arginine was considered approximately 100%. Figure 10 shows that the antagonistic or synergistic effects between different compounds should be further investigated to establish the dose and to maximize the killing selectivity on cancer cells.
The results obtained in this work also demonstrate that the oxidant stress associated with plasma-generated reactive species such as H2O2, NO2−, and ONOOH− have also contributed to cell death. The growth promotion exhibited by l-arginine and the combinational effects of the novel compounds detected in PTA were sufficient to provide a selective killing at levels consistent with those seen with the PTA solution (Figure 3b,c).
The strong selective effect of PTA has significant implications for breast cancer treatment. Current treatments affecting normal cells lead to severe side effects. PTA potentially minimizes these side effects by selectively targeting cancer cells. Furthermore, PTA provides a foundation for clinical applications of combinatorial chemistry identified in this work to enhance selectivity during therapy, offering patients a more effective and less harmful option. However, further thorough research on the compounds’ combination and selection, dose, and long-term effects is still required.
5 Conclusions
We demonstrated the selective killing by PTA by conducting an in vitro evaluation of the solution's cytotoxicity. Plasma irradiation of l-arginine solutions resulted in the generation of various compounds with chemical structures distinct from that of the liquid precursor that showed a stimulating, as well as an inhibiting effect on cancer and normal cells. d-arginine was not detected in PTA, indicating that this isomer did not contribute to the cytotoxicity or selective killing seen with the irradiated solution. Our results demonstrate that the selective cytotoxicity of PTA against MFC-7 cancer cells does not reflect the effects of a single chemical compound but rather the antagonistic or synergistic effects of multiple components. Further experiments involving the simultaneous addition of two or three components at a time will be required to validate these results and to further elucidate the interactions among these compounds in causing the observed cytotoxicity.
Author Contributions
Conceptualization of the study: Liyin Du, Camelia Miron, Masaru Hori, and Hiromasa Tanaka. Investigation, experimental operation, and writing–original draft: Liyin Du. Confirmation of experimental results by EPR spectra simulation: Takashi Kondo and Jun Kumagai. Confirmation of experimental results by LC-MS spectra analysis: Camelia Miron. Writing–review and editing: Camelia Miron and Hiromasa Tanaka. Project management: Kenji Ishikawa, Masaaki Mizuno, Shinya Toyokuni, and Hiroaki Kajiyama.
Acknowledgments
This work was supported, in part, by a Grant-in-Aid for Specially Promoted Research (No. 19H05462) from the Ministry of Education, Culture, Sports, Science and Technology of Japan. The author, Liyin DU, was supported by the Otsuka Toshimi Fellowship to cover daily life spent and be able to focus on academic research.
Conflicts of Interest
The authors declare no conflicts of interest.
Open Research
Data Availability Statement
Data that support the findings of this study are available from the corresponding author upon reasonable request.