Adipose triglyceride lipase gene expression in peripheral blood mononuclear cells of subjects with obesity and its association with insulin resistance, inflammation and lipid accumulation in liver
Abstract
Introduction
Adipose triglyceride lipase (ATGL) is a crucial enzyme responsible for the release of fatty acids from various tissues. The expression of ATGL is regulated by insulin and this enzyme is linked to Insulin resistance (IR). On the other hand, ATGL-mediated lipolysis is connected to macrophage function and thus, ATGL is involved in inflammation and the pathogenesis of lipid-related disorders. This study aimed to investigate the correlation between ATGL, obesity, Metabolic Syndrome (MetS), and inflammation.
Methods
A total of 100 participants, including 50 individuals with obesity and 50 healthy participants, were recruited for this study and underwent comprehensive clinical evaluations. Blood samples were collected to measure plasma lipid profiles, glycemic indices, and liver function tests. Additionally, peripheral blood mononuclear cells (PBMCs) were isolated and used for the assessment of the gene expression of ATGL, using real-time PCR. Furthermore, PBMCs were cultured and exposed to lipopolysaccharides (LPS) with simultaneous ATGL inhibition, and the gene expression of inflammatory cytokines, along with the secretion of prostaglandin E2 (PGE2), were measured.
Results
The gene expression of ATGL was significantly elevated in PBMCs obtained from participants with obesity and was particularly higher in those diagnosed with MetS. It exhibited a correlation with insulin levels and Homeostatic Model Assessment for IR (HOMA-IR), and it was associated with lipid accumulation in the liver. Stimulation with LPS increased ATGL expression in PBMCs, while inhibition of ATGL attenuated the inflammatory responses induced by LPS.
Conclusions
Obesity and MetS were associated with dysregulation of ATGL. ATGL might play a role in the upregulation of inflammatory cytokines and act as a significant contributor to the development of metabolic abnormalities related to obesity.
Graphical Abstract
Adipose triglyceride lipase (ATGL) was significantly increased in subjects with obesity and was associated with lipid accumulation in liver. There was also a direct relationship between ATGL and markers of insulin resistance, including insulin and HOMA-IR. ATGL inhibition abolished the expression of inflammatory cytokines.
1 INTRODUCTION
Lipids are present in diverse cell types, including those within adipose tissue and numerous other tissues, enclosed in small cytoplasmic vesicles known as lipid droplets or adiposomes.1 Excessive adiposity leads to the enlargement of lipid droplets in hepatocytes, forming large vacuoles that contribute to pathological conditions such as non-alcoholic fatty liver disease (NAFLD), steatohepatitis, and cirrhosis.2 The accumulation of lipid intermediates in different tissues beyond their normal capacity results in lipotoxicity, impairing cellular function, and promoting apoptosis.3
Defective insulin signaling, decreased insulin sensitivity, increased oxidative stress, and reduced metabolic capacity are prevalent disorders in individuals with obesity, leading to elevated levels of free fatty acids (FFAs), lipid intermediates, and inflammatory cytokines in non-adipose tissues.3, 4 Low-grade chronic inflammation is an essential element in the pathogenesis of obesity.5 The role of accumulated lipids in promoting inflammatory responses has become a focal point in the study of obesity-induced inflammation. Free fatty acids in blood and peripheral blood mononuclear cells (PBMCs) are strongly correlated with obesity and its associated chronic inflammation.6 Research has shown that many alterations that occur in obesity, such as elevation of adipokines and inflammatory cytokines, also occur in PBMSs.7 PBMCs also reflect homeostatic changes in relation to obesity and thus these particular blood cells can serve as a reservoir of early homeostatic imbalance in biomarkers of obesity.8
Adipose triglyceride lipase (ATGL) has garnered significant interest as a rate-limiting enzyme involved in the separation of fatty acids from intracellular triacylglycerol.9-11 ATGL is expressed in all tissues, where it regulates basal and stimulated lipolysis.12 Complete deletion of ATGL in both adipose and non-adipose tissues leads to reduced triacylglycerol hydrolysis and subsequent defective release of FFAs.13 It is worth noting that decreased lipolysis improves glucose homeostasis and insulin signaling and activity in various tissues.13, 14 However, the precise contribution of ATGL function to metabolic changes and inflammatory responses in obesity remains unclear. For instance, under acute lipolytic stimuli, ATGL activity can induce the recruitment of inflammatory factors and immune cells.15 On the other hand, there is evidence suggesting that ATGL protects against adipose tissue inflammation in response to nutritional and age-related stress. This effect is thought to be mediated by the release of FFAs, which not only serve as energy sources but also act as ligands for peroxisome proliferator-activated receptors,16, 17 essential nuclear transcription factors influencing both metabolism and inflammation.18 To elucidate the role of ATGL in obesity, this study aimed to investigate the expression status of ATGL in the PBMCs of individuals with obesity and its contribution to Metabolic Syndrome (MetS) and obesity-related inflammation.
2 MATERIALS AND METHODS
2.1 Participants and sample collection
This study included a total of 100 adults, consisting of 50 individuals with normal weight and 50 individuals with obesity. The height and weight of each participant were measured, and the body mass index (BMI) was calculated using the formula weight [kg]/(height)2 [m2]. Based on their BMI, participants were classified into two groups: those with BMI of 30 and above were categorized as the obesity group, while those with BMI between 18.5 and 24.9 were considered to have normal weight. All participants underwent comprehensive clinical evaluations, and their medical history was recorded. None of the participants were taking medications that could affect lipid and carbohydrate metabolism, had endocrine abnormalities or other illnesses, or were pregnant or lactating. They were not following any specific dietary regimen, and their level of physical activity was normal.
Measurements of waist circumference (WC), hip circumference (HC), systolic blood pressure (SBP), and diastolic blood pressure (DBP) were performed, and the waist-to-hip ratio (WHR) was calculated. The level of lipid accumulation in the liver was assessed using ultrasound. Metabolic syndrome was defined according to IDF criteria and an individual was classified as having MetS if they exhibited central obesity (WC ≥94 cm for males and ≥80 cm for females), in addition to the presence of any two of the following four factors: elevated triglycerides (≥150 mg/dL); reduced levels of high-density lipoprotein (HDL) cholesterol (<40 mg/dL in males, <50 mg/dL in females) or the use of specific treatments for these lipid abnormalities; elevated blood pressure (blood pressure ≥130/85 mm Hg) or treatment for previously diagnosed hypertension; elevated fasting plasma glucose (≥100 mg/dL) or a prior diagnosis of Type 2 Diabetes Mellitus.19
Whole blood samples were collected into ethylenediaminetetraacetic acid (EDTA) tubes, and immediate isolation of human PBMCs was carried out. The isolated PBMCs were then utilized to analyze the expression of the ATGL gene in both the obesity and non-obesity groups, while the plasma samples were used for other biochemical measurements.
This study adhered to the ethical considerations outlined in the declaration of Helsinki, and all participants provided informed consent prior to their participation in the study.
2.2 PBMC isolation
Isolation of human PBMCs was conducted by diluting blood samples in an equal volume of phosphate-buffered saline (PBS). The diluted samples were layered with Ficoll solution (Sigma Aldrich, Germany) and centrifuged at 1000 g for 20 min at room temperature. The mononuclear cell phase was carefully collected, washed twice with PBS, and centrifuged at 1000 g for 10 min. The resulting PBMCs were resuspended in 3 mL of PBS, and cell counting and viability assessment were performed using trypan blue exclusion dye.
2.3 RNA isolation, cDNA synthesis, and real-time PCR
For RNA isolation, TRIzol (TRI reagent, Sigma Aldrich, Germany) was used to extract total RNA from the PBMCs. The quality of the extracted RNA was evaluated using a NanoDrop 2000 spectrophotometer (Thermo Fisher Scientific, USA). Subsequently, cDNA synthesis was carried out from the total RNA using the QuantiTect Reverse Transcription Kit (QIAGEN, USA). Real-time PCR was performed using the SYBR Green Master Mix (RealQ Plus Master Mix Green, Amplicon, Denmark). The amplification protocol consisted of an initial denaturation step at 95°C for 15 min, followed by 40 cycles of 30 s at 95°C and 60 s at 61°C. GAPDH was used as the internal reference gene. Each experiment was repeated three times, and samples were loaded in duplicate for each run. The primer sequences are presented in Supporting Information S1.
2.4 Culture and treatment of PBMCs
PBMCs were seeded in 24-well plates at a density of 5 × 10⁵ cells/well in RPMI 1640 cell culture medium. The medium was supplemented with 10% fetal bovine serum (FBS) and 1% penicillin/streptomycin. The cells were incubated at 37°C in a humidified environment with 5% CO2.
To investigate the impact of inflammation on ATGL, the PBMCs were treated with 100 ng/mL lipopolysaccharide (LPS) for 6 h. To assess ATGL-induced inflammation, the cells were pre-treated with 10 and 40 μmol/L of atglistatin (Sigma Aldrich, Germany), a selective ATGL inhibitor, for 2 h before LPS treatment. The concentrations were selected based on previous research.20 After treatment, the cells were centrifuged at 500 g for 5 min, and the collected cells were used for RNA isolation and subsequent analysis.
2.5 Prostaglandin E2 measurement
PBMCs were cultured and seeded as described above. After overnight incubation, the cells were pre-treated with 10 and 40 μmol/L atglistatin and then treated with 100 ng/mL LPS for 24 h. Following incubation, the cells were centrifuged at 500 g for 5 min, and the supernatant was collected for PGE2-level examination using the Prostaglandin E2 ELISA kit (Cusabio, China). The kit had inter-assay and intra-assay precision of less than 15%.
2.6 Statistical analysis
Statistical analysis was performed using SPSS software version 25 (Armonk, NY, IBM Corp, USA) and MedCalc version 18.9.10 (Ostend, Belgium). The normal distribution of data was assessed using the Kolmogorov-Smirnov Test. For the comparison of different groups, student's t-test or Mann-Whitney U test was used for parametric or non-parametric variables, respectively. Analysis of variance (ANOVA) with Dunnett's post hoc test was employed for multiple comparisons of parametric variables, and Kruskal-Wallis test was used for non-parametric variables. Correlation analysis was conducted using Pearson or Spearman tests. A significance level of p < 0.05 was considered statistically significant.
3 RESULTS
3.1 Patients and demographic/biochemical characteristics
The demographic and biochemical characteristics of the patients and comparison groups are presented in Tables 1 and 2. The age and gender distributions were similar in both groups. However, patients exhibited significantly higher WC, HC, SBP, DBP, and fasting blood sugar (FBS) than those in the comparison participants. Although there were slight differences in other biochemical parameters between the two groups, these differences did not reach statistical significance.
| Factor | Normal-weight | Obesity | p value |
|---|---|---|---|
| Male/female | 16/34 | 26/24 | 0.066 |
| Age (years) | 40.55 ± 10.8 | 43.42 ± 11.69 | 0.210 |
| Weight (kg) | 71.84 ± 10.7 | 104.62 ± 21.2 | <0.001 |
| BMI | 23.66 ± 3.2 | 36.40 ± 7.2 | <0.001 |
| WC (cm) | 86.02 ± 8.9 | 110.96 ± 17.1 | <0.001 |
| HC (cm) | 96.31 ± 7.0 | 123.16 ± 19.5 | < 0.001 |
| W/H | 0.89 ± 0.05 | 0.90 ± 0.04 | 0.343 |
| SBP (mmHg) | 119.39 ± 2.4 | 122.45 ± 5.9 | 0.001 |
| DBP (mmHg) | 78.78 ± 3.3 | 82.45 ± 6.9 | 0.001 |
- Note: Data are presented as mean ± standard deviation (SD). The bold values indicate significant values.
- Abbreviations: BMI, body mass index; DBP, diastolic blood pressure; HC, hip circumference; SBP, systolic blood pressure; W/H, waist to hip circumference ratio; WC, waist circumference.
| Factor | Normal-weight | Obesity | p value |
|---|---|---|---|
| FBS (mg/dL) | 90.4 ± 13.7 | 101.6 ± 25.2 | 0.007 |
| TG (mg/dL) | 122.06 ± 41.9 | 147.7 ± 82.6 | 0.058 |
| TC (mg/dL) | 178.40 ± 32.6 | 175.4 ± 34.1 | 0.664 |
| LDL-C (mg/dL) | 102.9 ± 19.1 | 98.5 ± 20.1 | 0.261 |
| HDL-C (mg/dL) | 41.0 ± 7.9 | 41.26 ± 10.13 | 0.886 |
| Insulin (μIU/mL) | 7.01 (5.2–11.3) | 9.14 (6.2–13.9) | 0.098 |
| HOMA-IR | 1.56 (1.0–2.9) | 2.12 (1.3–3.4) | 0.087 |
| AST (IU/L) | 25.9 ± 8.8 | 31.5 ± 21.3 | 0.084 |
| ALT (IU/L) | 31.0 ± 17.9 | 34.20 ± 25.8 | 0.478 |
| ALP (IU/L) | 193.6 ± 28.8 | 206.0 ± 47.9 | 0.126 |
| T-bilirubin (mg/dL) | 0.73 ± 0.35 | 0.71 ± 0.47 | 0.868 |
| D- bilirubin (mg/dL) | 0.24 ± 0.08 | 0.24 ± 0.12 | 0.848 |
- Note: Data are presented as mean ± standard deviation (SD) or median (interquartile range). The bold values indicate significant values.
- Abbreviations: ALP, Alkaline Phosphatase; ALT, alanine aminotransferase; AST, aspartate aminotransferase; D-bilirubin, direct bilirubin; FBS, fasting blood sugar; HDL-C, high-density lipoprotein cholesterol; HOMA-IR, homeostatic model assessment of insulin resistance; LDL-C, low-density lipoprotein cholesterol; T-bilirubin, total bilirubin; TC, total cholesterol; TG, triglycerides.
Among the cases, 22 individuals (44%) were diagnosed with MetS, whereas 28 participants (56%) did not have MetS. Insulin resistance (IR) was determined using the cutoff value of 1.85 for the Homeostatic Model Assessment of IR (HOMA-IR), which indicates IR.21 Accordingly, out of the total patients, 17 (34%) were found to be insulin resistant.
Furthermore, the patients were categorized based on the level of lipid accumulation in the liver, and the biochemical parameters were compared according to the grade of liver steatosis (Table 3). It was observed that individuals with higher grades of liver steatosis (grade 3) exhibited elevated liver function tests, including aspartate transaminase, alanine transaminase, and alkaline phosphatase. Additionally, FBS, total cholesterol, HDL, and HOMA-IR were significantly increased in those with a higher grade of liver steatosis (Table 3).
| Factor | Normal | Grade 1 | Grade 2 | Grade 3 |
|---|---|---|---|---|
| FBS (mg/dL) | 91.8 ± 16.4 | 100.23 ± 18.7 | 104.05 ± 21.8 | 116.4 ± 49.4* |
| TG (mg/dL) | 155.3 ± 97.4 | 156.38 ± 123.7 | 147.3 ± 71.3 | 119.0 ± 41.3 |
| TC (mg/dL) | 174.06 ± 32.2 | 157.46 ± 27.5 | 189.7 ± 32.3 | 204.71 ± 29.4* |
| LDL-C (mg/dL) | 99.73 ± 19.1 | 87.89 ± 17.7 | 107.1 ± 18.6 | 116.8 ± 14.8 |
| HDL-C (mg/dL) | 39.83 ± 7.6 | 36.5 ± 7.6 | 44.8 ± 10.5 | 51.2 ± 10.02* |
| Insulin (μIU/ml) | 7.01 (5.19–11.05) | 8.54 (6.01–10.2) | 9.74 (6.63–16.69) | 15.34 (7.38–19.19) |
| HOMA-IR | 1.55 (1.03–2.9) | 2.04 (1.29–2.6) | 3.41 (1.5–4.0) | 3.41 (1.7–8.8)* |
| AST (IU/L) | 25.68 ± 8.9 | 23.00 ± 5.7 | 27.88 ± 11 | 69.71 ± 33.46** |
| ALT (IU/L) | 29.2 ± 17.2 | 23.69 ± 11.3 | 32.22 ± 17.9 | 79.14 ± 32.95** |
| ALP (IU/L) | 189.88 ± 34.0 | 211.38 ± 55.24 | 212.38 ± 40.58 | 231.28 ± 24.42* |
| T-bilirubin (mg/dL) | 0.71 ± 0.34 | 0.68 ± 0.32 | 0.73 ± 0.59 | 0.88 ± 0.65 |
| D-bilirubin (mg/dL) | 0.23 ± 0.08 | 0.24 ± 0.05 | 0.23 ± 0.08 | 0.35 ± 0.26* |
- Note: Asterisks indicate significant difference from normal subjects, *p < 0.05, **p < 0.01.
- Abbreviations: ALP, Alkaline Phosphatase; ALT, alanine aminotransferase; AST, aspartate aminotransferase; D-bilirubin, direct bilirubin; FBS, fasting blood sugar; HDL-C, high-density lipoprotein cholesterol; HOMA-IR, homeostatic model assessment of insulin resistance; LDL-C, low-density lipoprotein cholesterol; T-bilirubin, total bilirubin; TC, total cholesterol; TG, triglycerides.
3.2 ATGL expression
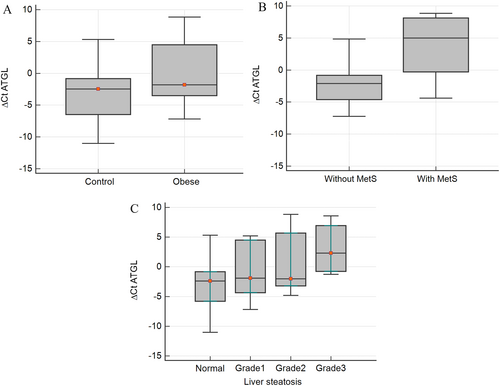
ATGL expression was assessed in PBMCs of all the participants, and its relationship with MetS, IR, and NAFLD was explored. Our findings revealed a significantly higher expression of ATGL in PBMCs of participants with obesity compared to the control group (p < 0.05) (Figure 1A). Moreover, the expression of ATGL was notably elevated in individuals with MetS (p < 0.001) and those with IR (p < 0.05).
Comparison of ATGL gene expression in (A) 50 subjects with obesity and 50 comparison subjects, (B) subjects with or without metabolic syndrome (MetS), and (C) subjects with different grades of liver steatosis.
When examining individuals with NAFLD, a concurrent increase in ATGL gene expression with the severity of liver steatosis (Figure 1B) was observed. No significant differences in ATGL expression were observed between male and female participants.
Correlation analysis demonstrated a significant positive association between ATGL expression and markers of IR, including WC, insulin levels, and Homeostatic Model Assessment for IR (HOMA-IR) (Table 4). Additionally, ATGL gene expression exhibited a significant correlation with DBP, while a slight correlation with SBP was observed, although it did not reach statistical significance.
| R | p value | |
|---|---|---|
| BMI (kg/m2) | 0.183 | 0.058 |
| Weight (kg) | 0.242 | 0.031 |
| WC (cm) | 0.246 | 0.029 |
| W/H | −0.050 | 0.662 |
| SBP | 0.212 | 0.051 |
| DBP | 0.249 | 0.021 |
| FBS (mg/dL) | 0.166 | 0.142 |
| TG (mg/dL) | 0.050 | 0.664 |
| TC (mg/dL) | −0.016 | 0.885 |
| LDL-C (mg/dL) | 0.021 | 0.853 |
| HDL-C (mg/dL) | −0.046 | 0.689 |
| Insulin (μIU/ml) | 0.269 | 0.016 |
| HOMA-IR | 0.250 | 0.026 |
| AST (IU/L) | −0.107 | 0.348 |
| ALT (IU/L) | −0.093 | 0.416 |
| ALP (IU/L) | −0.071 | 0.532 |
| T- bilirubin (mg/dL) | 0.069 | 0.530 |
| D- bilirubin (mg/dL) | 0.055 | 0.616 |
- Note: The bold values indicate significant values.
- Abbreviations: ALP, Alkaline Phosphatase; ALT, alanine aminotransferase; AST, aspartate aminotransferase; BMI, Body mass index; DBP, diastolic blood pressure; FPG, Fasting plasma glucose; HDL-C, high-density lipoprotein cholesterol; LDL-C, low-density lipoprotein cholesterol; SBP, systolic blood pressure; TC, total cholesterol; T-bilirubin, total bilirubin; TC, total cholesterol; TG, triglyceride; W/H, waist to hip circumference ratio; WC, waist circumference.
3.3 Interrelationship between ATGL and inflammation
To investigate the mechanism underlying the increased expression of ATGL in individuals with obesity and determine whether it is associated with the inflammatory state of obesity, the isolated PBMCs were cultured and treated with lipopolysaccharide (LPS) to induce inflammation. As depicted in Figure 2A, LPS stimulation resulted in a significant upregulation of the ATGL gene expression. Additionally, LPS-induced inflammation in PBMCs was confirmed by the upregulation of the inflammatory cytokines IL-6, MCP-1, and TNF-α (Figure 2B–D).
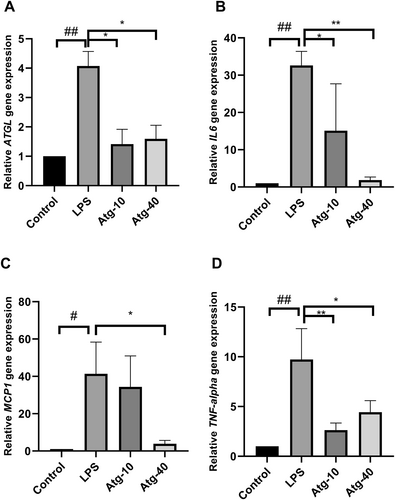
(A) The effect of LPS-induced inflammation on the gene expression of ATGL and the inhibitory effect of atglistatin (10 and 40 μmol/L) as the specific inhibitor of ATGL in cultured PBMCs. Atglistatin also inhibited the LPS-induced expression of IL-6 (B), MCP-1 (C) and TNF-α (D). The data presented is the mean ± SD of three separate experiments. *p < 0.05 and **p < 0.01 compared with LPS-treated cells. #p < 0.05 and ##p < 0.01 compared with untreated control.
To validate the involvement of ATGL in the induction of inflammatory cytokines, atglistatin was utilized to inhibit ATGL activity. The results demonstrated that inhibition of ATGL markedly attenuated the LPS-induced upregulation of IL-6, MCP-1, and TNF-α. Interestingly, treatment with atglistatin also led to a significant reduction in ATGL expression, further supporting the interconnection between inflammation and ATGL.
Considering that ATGL activity has been associated with the production of prostaglandins through the release of arachidonic acid,22 the secretion of prostaglandin E2 (PGE2) by PBMCs into the culture medium was evaluated using an ELISA method. As shown in Figure 3, LPS stimulation significantly increased the release of PGE2, while atglistatin effectively blocked this effect and significantly decreased the LPS-induced production of PGE2. It is worth noting that atglistatin alone did not alter the concentration of PGE2 in the cell culture medium (Figure 3).
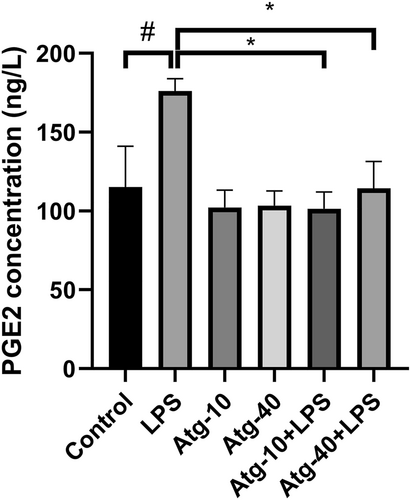
Secretion of prostaglandin E2 (PGE2) from cultured PBMCs in response to LPS and the inhibitory effect of atglistatin (10 and 40 μmol/L) as the specific inhibitor of ATGL on the LPS-induced PGE2 secretion. The results are the mean ± SD of three independent experiments. *p < 0.05 compared with LPS-treated cells. #p < 0.05 compared with untreated control.
4 DISCUSSION
Studies on global ATGL-deficient mice have demonstrated a significant defect in both basal and stimulated lipolysis, as well as systemic triglyceride overload in adipose and non-adipose tissues, emphasizing the importance of ATGL in lipolysis.13, 23 A substantial elevation in ATGL expression was observed in the PBMCs of individuals with obesity as opposed to the normal-weight comparison group. This finding is consistent with a previous report of increased ATGL mRNA expression in adipose tissue of individuals with obesity, independent of BMI.24 However, it is worth noting that contrasting results have been reported, with reduced ATGL gene expression observed in individuals with obesity and those with IR.25 These discrepancies might arise from distinct regulatory mechanisms governing ATGL expression and activity in adipocytes and other cell types. Therefore, it is plausible to propose that the upregulation of ATGL in obesity is influenced by the inflammatory state associated with obesity rather than solely driven by adipose tissue expansion.
To investigate the hypothesis that inflammation contributes to the upregulation of ATGL, in vitro experiments were conducted using cultured PBMCs. Upon induction of inflammation, a significant increase in ATGL expression was observed, supporting our hypothesis. Furthermore, when we administered atglistatin, an inhibitor of ATGL, it effectively attenuated the inflammatory response induced by LPS, indicating the involvement of ATGL in PBMC inflammation. The inhibition of LPS-induced PGE2 secretion by atglistatin further confirmed the role of ATGL in PBMC inflammation.
Consistent with the findings of this study, previous studies have shown that pharmacological inhibition of ATGL suppresses IL-6-mediated lipolysis in adipose tissue, highlighting the pivotal role of ATGL in macrophage-enhanced lipolysis in adipose tissue.26 Additionally, genetic deletion of ATGL in adipocytes has been shown to reduce immune cell infiltration into adipose tissue, emphasizing the role of ATGL-mediated lipolysis in immune cell recruitment and subsequent inflammation.27 Decreased release of arachidonic acid and subsequent prostacyclin secretion has also been observed upon downregulation of ATGL in human aortic endothelial cells.28 Arachidonic acid is a precursor for pro-inflammatory prostaglandins synthesized by cyclooxygenase (COX) enzymes.29-31 Therefore, the lipolytic activity of ATGL might contribute to the initiation of an inflammatory cascade through the release of arachidonic acid. The rate of fat oxidation in PBMCs has been associated with the expression of inflammatory markers, indicating that PBMCs possess metabolic pathways that can be influenced by high-fat diet independently of changes in adipose tissue.32
In obesity, the expansion of adipose tissue is often accompanied by the secretion of inflammatory cytokines, such as IL-6, MCP-1, and TNF-α, from adipocytes and infiltrating immune cells. These cytokines have been implicated in the development of obesity-related IR.33 Moreover, PBMCs also contribute to the inflammatory state associated with obesity, contributing to the chronic low-grade inflammation characteristic of this condition.34 Inflammation is considered as a key underlying mechanism in the occurrence of MetS, and cytokines play a significant role in obesity-related IR.33
In this study, a significant correlation was observed between ATGL mRNA expression and markers of IR, including insulin levels and HOMA-IR. This finding is consistent with previous research demonstrating that systemic knockout of ATGL in mice leads to improved insulin sensitivity and glucose tolerance.27 Furthermore, experiments suppressing ATGL expression in insulinoma cell lines resulted in impaired fatty acid-stimulated insulin secretion, highlighting the involvement of ATGL in glycemic control.35
Another noteworthy finding of this study is the association between ATGL expression and liver steatosis. These results align with previous research by Schweiger et al., where the use of atglistatin, a potent ATGL inhibitor, led to a reduction in high-fat diet-induced liver steatosis, liver inflammation, and hepatic fibrosis.36 This effect may be attributed to the continuous increased delivery of FFAs to the liver, which can contribute to the development of NAFLD. Taken together, the findings of this study suggest that ATGL plays a role in both IR and liver steatosis, further emphasizing its significance in the pathogenesis of metabolic disorders associated with obesity.
5 CONCLUSION
In summary, this study found that ATGL expression is elevated in obesity and is closely associated with MetS, IR, and NAFLD in affected individuals. The up-regulation of ATGL might be attributed to the inflammatory state associated with obesity. Furthermore, the findings suggest that ATGL plays a role in promoting inflammation in obesity. These findings highlight the multifaceted nature of ATGL in the context of obesity and provide evidence for its potential as a therapeutic target in managing obesity and its associated metabolic disturbances. Targeting changes in PBMCs may be particularly crucial in preventing the development of metabolic and inflammatory complications related to obesity.
ACKNOWLEDGMENTS
This research was financially supported by grants (number 97-4-75-13469 and 97-3-24-12506) from Iran University of Medical Sciences.
CONFLICT OF INTEREST STATEMENT
The authors have no financial or personal interests to declare.


