Accelerated fatty acid composition MRI of epicardial adipose tissue: Development and application to eplerenone treatment in a mouse model of obesity-induced coronary microvascular disease
Funding information: National Institute of Biomedical Imaging and Bioengineering, Grant/Award Number: R01 EB001763; National Heart, Lung, and Blood Institute, Grant/Award Number: R01HL162872; US-Israel Binational Science Foundation, Grant/Award Number: BSF2017200
Click here for author-reader discussions
Abstract
Purpose
To develop an accelerated MRI method to quantify the epicardial adipose tissue (EAT) fatty acid composition (FAC) and test the hypothesis that eplerenone (EPL) shifts the EAT FAC toward unsaturation in obese mice.
Methods
Undersampled multi-echo gradient echo imaging employing a dictionary-based compressed-sensing reconstruction and iterative decomposition with echo asymmetry and least-squares–based mapping (IDEAL) was developed, validated, and used to study EAT in obese mice scanned at 7T. Fully sampled and rate 2, 2.5, 3, and 3.5 undersampled image data were acquired, reconstructed, and assessed using RMSE and structural similarity (SSIM). Two groups of mice were studied: untreated (control, n = 10) and EPL-treated (n = 10) mice fed a high-fat high-sucrose diet. MRI included imaging of EAT FAC, EAT volume, and myocardial perfusion reserve.
Results
Rate 3 acceleration provided RMSE <5% and structural similarity >0.85 for FAC MRI. After 6 weeks of diet, EPL-treated compared to untreated mice had a reduced EAT saturated fatty acid fraction (0.27 ± 0.09 vs. 0.39 ± 0.07, P < 0.05) and increased EAT unsaturation degree (4.37 ± 0.32 vs. 3.69 ± 0.58, P < 0.05). Also, EAT volume in EPL-treated compared to untreated mice was reduced (8.1 ± 0.6 mg vs. 11.4 ± 0.7 mg, P < 0.01), and myocardial perfusion reserve was improved (1.83 ± 0.15 vs. 1.61 ± 0.17, P < 0.05).
Conclusion
Rate 3 accelerated FAC MRI enabled accurate quantification of EAT FAC in mice. EPL treatment shifted the EAT FAC toward increased unsaturation and was associated with improvement of coronary microvascular function.
1 INTRODUCTION
In recent years, there has been growing interest in the role of epicardial adipose tissue (EAT) in various types of heart disease, including coronary microvascular disease and heart failure with preserved ejection fraction.1-4 EAT is an active endocrine organ located directly on the heart's surface with an extensive secretome, and it shares an unobstructed microcirculation with the underlying myocardial tissue.5 In normal conditions, EAT protects the coronary arteries and myocardium from inflammation and fibrosis6-8; however, in pathological conditions such as obesity, the EAT has been described as a transducer of metabolic inflammation to the coronary vasculature.3, 9 Specifically, in obesity the EAT volume increases, and a phenotypic shift occurs where M1-polarized macrophages accumulate and the EAT secretes proinflammatory cytokines that promote vascular and myocardial dysfunction.10-13 In this condition, the EAT fatty acid composition (FAC) is thought to contribute to its proinflammatory state14, 15 because saturated fatty acids (SFAs) through toll-like receptor 4 signaling promote macrophage M1 polarization and inflammasome activation.16 Alternatively, decreasing SFAs and increasing the degree of unsaturation promotes cardioprotection.17-19 These points suggest that whereas imaging EAT volume provides one important metric describing the EAT,20, 21 imaging EAT FAC may provide additional important information regarding its inflammatory or proinflammatory state.
FAC MRI techniques have recently been developed and validated in phantoms22-24 and applied in the abdomen,22, 25, 26 liver,27 and bone marrow28, 29 to quantify adipose tissue FAC; however, these methods have not yet been applied to EAT. Generally, by using prior knowledge of the 1H triglyceride spectrum,30 the multi-echo gradient echo (GRE) signal from adipose tissue is represented using a multi-resonance signal model. After fitting the model to acquired multi-echo GRE data using a method such as iterative decomposition with echo asymmetry and least-squares (IDEAL), physiologically meaningful parameters such as SFA fraction, polyunsaturated fatty acid (PUFA) fraction, monounsaturated fatty acid (MUFA) fraction, unsaturated degree (UD), and polyunsaturated degree (PUD) can be computed from the model parameters.22
Although standard FAC MRI methods can be applied to EAT, heart motion dictates the need for cardiac-gated segmented acquisitions, lengthening the scan time. Acceleration techniques are thus essential to achieve practical scan times. Liu et al. has demonstrated the use of a compressed sensing method utilizing a dictionary based on the multi-resonance 1H triglyceride spectrum to reconstruct separate fat and water images of the gastrointestinal tract.31 Here, we extend these methods to accelerate FAC MRI of EAT.
The first goal of the present study was to develop and validate an accelerated multi-echo GRE MRI method to be used with IDEAL mapping to quantify EAT FAC in mice. Next, using MRI applied to a mouse model of diet-induced obesity, we tested the hypothesis that eplerenone (EPL), a mineralocorticoid antagonist shown to reduce obesity-related adipose inflammation,32, 33 reduces EAT volume, shifts the EAT FAC toward an anti-inflammatory state (with reduced SFAs and increased UD), and reduces coronary microvascular dysfunction.
2 METHODS
2.1 FAC imaging and mapping
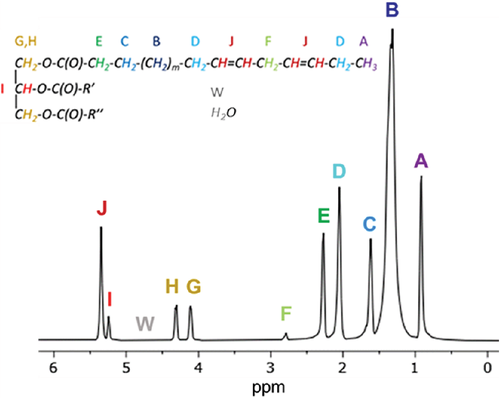
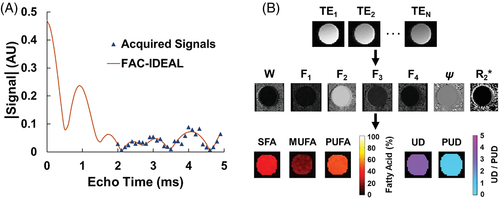
(A) Example FAC-IDEAL least-squares fit of the signal model to the acquired multi-echo GRE data of vegetable oil for 1 pixel. (B) Flow diagram of FAC-IDEAL showing the process of FAC mapping from N GRE images. FAC-IDEAL, fatty acid composition–iterative decomposition with echo asymmetry and least-squares; GRE, gradient echo.
2.2 Selection of the number of echoes and the echo spacing for FAC MRI at 7 T
An important issue for FAC imaging is choosing the number of echoes and interecho spacing required for efficient estimation of SFA, PUFA, MUFA, UD, and PUD. To address this issue, Cramér-Rao lower bound analysis on the variance of the estimates35 was performed on an oil phantom. The phantom was constructed using separate tubes of water, sesame oil, olive oil, and vegetable oil. Specifically, 1 mL pipette tips were filled with each oil, attached to the lid of an empty 50 mL conical tube, and placed inside the tube. Sesame, olive, and vegetable oils were chosen because they have a FAC similar to that of mammalian adipose tissue. Using a 7T small-animal MRI system (Clinscan, Bruker, Ettlingen, Germany), 30 GRE images were acquired using evenly spaced TEs ranging from the minimum TE of 2.0 ms to 4.9 ms. Using TE ≥ 5 ms, due to magnetic field inhomogeneity at 7 Tesla around the mouse heart,36 GRE images suffer from T2* decay and distortion artifacts; thus, we constrained our maximum TE to be less than 5 ms. Other acquisition parameters included slice thickness = 1 mm, TR = 120 ms (approximating the mouse R-R interval), flip angle = 15°, 32 averages, acquisition matrix 128 × 128, and resolution 0.2 × 0.2 mm2. For Cramér-Rao analysis, the number of echoes was retrospectively varied from 6 to 30, and the interecho spacing was retrospectively varied between 0.1 and 0.5 ms. Of note, Berglund et al. demonstrated that the choice of the initial TE does not have a significant impact on the analysis. Thus, for this analysis, we did not vary the initial TE.22
Figure 3A shows sample SFA maps of sesame oil demonstrating changes in parameter map variance with different numbers of echoes and echo spacings. Figure 3B, 3C shows the average variances for SFA and UD maps from all 3 oils with various numbers of echoes and interecho spacings. For all parameters, including SFA, PUFA, MUFA, UD, and PUD, the optimal choices for the number of echoes and the interecho spacing were found to be 9 or 10 echoes and 0.3 ms spacing, respectively. Because in practice for in vivo imaging we will acquire 2 echoes per RF excitation, there is no practical benefit to using 9 versus 10 echoes.
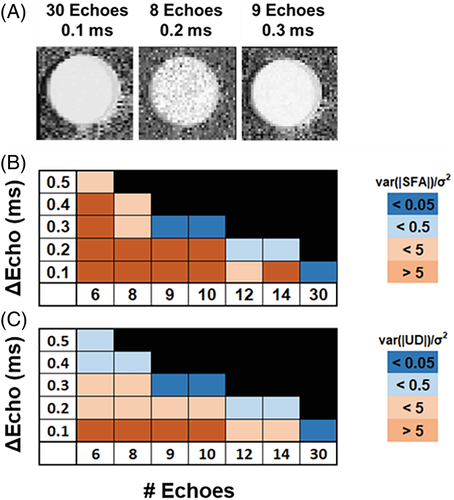
(A) Example grayscale SFA maps of sesame oil from acquisitions with varying numbers of echoes and ΔEcho demonstrating differences in signal variance. Cramér-Rao analysis shown for (B) SFA and (C) UD maps indicates that 9 or 10 echoes with 0.3 ms spacing represents the smallest number of echoes that provides a ratio of signal variance/noise variance () less than 0.05.
ΔEcho, interecho spacing; SFA, saturated fatty acids; UD, unsaturated degree.
2.3 Minimum SNR required for accurate FAC MRI
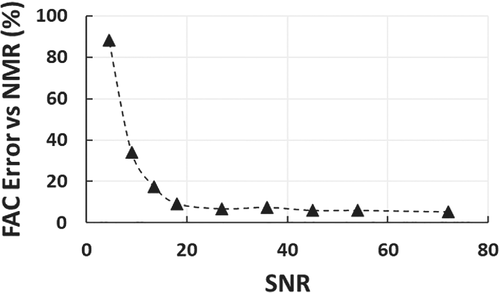
SNR is related to scan time; thus, it is also important to find the minimum SNR that maintains accurate estimation of FAC. Using oil phantom datasets with 10 echoes, 0.3 ms interecho spacing, and varied numbers of averages, we show that an SNR of 18 (corresponding to 8 signal averages for the in vivo EAT imaging protocol) maintains FAC-IDEAL SFA, PUFA, MUFA, UD, and PUD estimation errors of less than 10% compared to NMR spectroscopy as shown in Figure 4. SNR was calculated using the SNRdiff method, which is based on the evaluation of a difference image of 2 repeated acquisitions.37 For each dataset, SNRdiff was calculated using a manually contoured region of interest (∼150 pixels) from the first echo (TE = 2.0 ms) magnitude-reconstructed images.
2.4 NMR spectroscopy
As a reference method, NMR spectroscopy was used to characterize the SFA, MUFA, and PUFA fractions and the UD and PUD. Samples were placed in an NMR tube with width of 5 mm and length of 7″. A Bruker AVIII-600 spectrometer was used to acquire 1D 1H spectra. Sixteen averages were obtained for each spectrum, and the time between pulses was 10s. Spectral analysis was performed in Mnova v14.2.1 (Mestrelab Research SL, Santiago de Compostela, Spain), and SFA, PUFA, and MUFA fractions as well as UD and PUD were quantified as described.22, 30
2.5 Accelerated multi-echo GRE FAC MRI
Building upon the work of Liu et al.,31 undersampling masks using a uniform rate 2 undersampling pattern for the center 33% of k-space and a Poisson-Disc undersampling pattern for the outer 66% of k-space along the ky and TE dimensions were generated for rate 2, 2.5, 3, and 3.5 acceleration. An example mask is shown in Figure 5A.
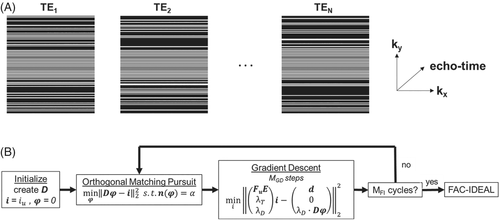
Equation (3) was solved using alternating updates of and where α elements of are obtained using orthogonal matching pursuit (OMP), which searches for the entry in D with the highest correlation to . Subsequently, is updated using MGD steps of gradient descent. After MFI full iterations of OMP and gradient descent, mapping using FAC-IDEAL was performed on the final reconstructed images. Figure 5B shows a flow diagram of the reconstruction, which we refer to as compressed-sensing/dictionary (CS-DICT). FAC-IDEAL was applied after using a dictionary-based reconstruction because the resolution of the dictionary was limited in order to achieve a reasonably fast reconstruction time. Use of a dictionary with limited resolution followed by FAC-IDEAL mapping provided a practical combination of computation time and accuracy.
2.6 CS-DICT parameter selection
D, α, λT, λD, MGD, and MFI were optimized to minimize the RMSE using L-curve analysis.38 The entries to D, potential signal evolutions over N echoes, were created by computing Equation (1) for all combinations of F1, F2, F3, F4, , and , given that W = 1 – F1 – F2 – F3 – F4, and using parameter ranges based on FAC-IDEAL mapping of fully sampled datasets acquired from obese mice scanned at 7 T. D was constructed using number of echoes = 10, 0 < F1 < 0.1, 0 < F2 < 0.7, 0 < F3 < 0.15, 0 < F4 < 0.15, −250 Hz < < 250 Hz, and 0 s−1 < < 400 s−1, resulting in a dictionary with size 10 × 38 016. Other optimized parameters include: α = 4, λT = 0.01, λD = 0.1, MGD = 12, and MFI = 12.
2.7 FAC MRI protocol for imaging the EAT in mice
All animal studies were performed in accordance with protocols that conformed to the Declaration of Helsinki as well as the Guide for Care and Use of Laboratory Animals (NIH publication no. 85–23, revised 1996) and were approved by the Animal Care and Use Committee at the University of Virginia. Prior to MRI, male C57Bl/6 mice (Jackson Laboratories, Bar Harbor, Maine) were fed a high-fat high-sucrose diet (HFHSD) (40% kcal fat, 40% kcal sucrose, Diet 12 327, Research Diets Inc., New Brunswick, NJ) for 6 weeks to induce the development of EAT, which otherwise is inappreciable. MRI was performed using a 7T system and a 4-channel phased-array radiofrequency coil. During imaging, mice were anesthetized with 1.25% isoflurane, and core temperature was maintained at 36 ± 0.5°C using circulating warm water. Also, the electrocardiogram, body temperature, and respiration were monitored (SA Instruments, Stony Brook, NY). Localizer imaging was performed to establish a short-axis slice positioned toward the base of the left ventricle, where EAT is typically abundant. Fully sampled and prospectively undersampled images for FAC-MRI were acquired using an electrocardiogram-gated, respiration-gated flyback double-echo GRE sequence with time between echoes of 1.5 ms, TR = R-R interval, flip angle = 15°, averages = 8, bandwidth = 390 Hz/pixel, slice thickness = 1 mm, FOV = 25.6 × 25.6 mm2, acquisition matrix of 128 × 128, and resolution of 0.2 × 0.2 mm2. Using 5 acquisitions, 10 echoes were acquired with TEs ranging from 2.0 ms to 4.7 ms with interecho spacings of 0.3 ms, corresponding to the optimal values as determined by the Cramér-Rao lower bound analysis. Because fully sampled images were acquired as a reference for each acquisition, they were also used to generate coil sensitivity maps39 for the undersampled acquisitions, and autocalibration techniques were not implemented. All postprocessing, including computation of coil sensitivity maps, CS-DICT, and FAC-IDEAL, was performed offline using MatLab r2021a (MathWorks, Natick, MA).
2.8 Selection of acceleration rate
To select an acceleration rate to use for undersampled imaging, fully sampled EAT FAC MRI datasets were acquired from obese male C57Bl/6 mice (n = 12). The images were retrospectively undersampled at rate 2, 2.5, 5, and 3.5 acceleration, and CS-DICT reconstruction was performed. For assessment and error quantification of CS-DICT reconstructed versus fully sampled images at various retrospective acceleration rates, RMSE and structural similarity index (SSIM) were computed. Thresholds of RMSE < 5% and SSIM > 0.85 were used as criteria to select an undersampling rate for prospectively accelerated imaging.
2.9 Phantom and in vivo validation of FAC parameters
To validate measurements of the FAC parameters, SFA, MUFA, PUFA, UD, and PUD, we performed NMR spectroscopy, fully sampled FAC-IDEAL, and accelerated FAC-IDEAL on sesame, olive, and vegetable oil phantoms as well as axillary adipose tissue from n = 3 mice fed 6 weeks of HFHSD. Axillary adipose tissue was chosen instead of EAT because the volume of EAT that could be excised was too small to fill an NMR tube. Mice were euthanized after MRI, and NMR spectroscopy was performed on the excised tissues. For quantification of MRI FAC parameters, adipose depots were manually segmented from F2 maps for pixels where F2 > 0.4.
2.10 Relationship of EAT to coronary microvascular disease: experimental design
Untreated (n = 10) and EPL-treated (n = 10) obese wild type male C57Bl/6 mice (Jackson Laboratories, Bar Harbor, Maine) were studied. Untreated mice were fed a HFHSD, whereas treated mice were fed a HFHSD + EPL (100 mg/kg/day, Mylan Pharmaceuticals Inc.). The diets and EPL treatment were initiated at 10 weeks of age and continued for 6 weeks, at which time fully sampled and rate 3 accelerated EAT FAC MRI was performed. The total scan times for fully sampled and rate 3 accelerated FAC MRI were ∼ 25 min and ∼ 8 min, respectively.
The MRI protocol also included multi-slice 3-point Dixon imaging of the EAT to quantify EAT volume.40 An electrocardiogram-gated, respiration-gated double-inversion recovery black-blood cine sequence41 was used to acquire 6 short-axis slices covering the left ventricle. Sequence parameters included TE1/TE2/TE3 = 2.5/3.0/3.5 ms, TR = R-R interval, FOV = 30 × 30 mm2, matrix size = 128 × 128, flip angle = 15°, slice thickness = 1 mm, and number of averages = 3. Water and fat–separated images were computed using the 3-point Dixon approach, and EAT volume was manually contoured and calculated from the fat images. The total scan time for EAT volume imaging was ∼18 min.
Lastly, myocardial perfusion reserve (MPR) imaging of a midventricular short-axis slice was performed at baseline (prior to initiating the HFHSD) and 6 weeks post-diet to assess coronary microvascular function (n = 8/group). Myocardial perfusion was quantified using electrocardiogram-gated and respiration–self-gated arterial spin labeling (ASL).42, 43 After ASL applied at rest, adenosine was infused intraperitoneally (300 mg/kg/min, 5 μl/min); 10 min later, ASL was repeated. ASL parameters included TE/TR = 2.5/10.0 ms, FOV = 38 × 38 mm2, matrix size = 128 × 128, flip angle = 7°, slice thickness = 1 mm, saturation band thickness = 10 mm, and number of averages = 9. For myocardial perfusion analysis, the myocardium was manually segmented, and rest and adenosine stress perfusion were quantified using methods previously described.42 MPR was calculated as stress perfusion/rest perfusion. The total time for myocardial perfusion reserve imaging including adenosine infusion was ∼26 min.
2.11 Data analysis and statistics
Statistical analysis was performed using IBM SPSS Statistics for Windows v28 (IBM, Armonk, NY). All results of RMSE, SSIM, and parametric maps are expressed as mean ± SD. T tests were used to test for differences in FAC parameters between untreated and EPL-treated mice. Two-way ANOVA was used to detect differences in rest perfusion, stress perfusion, and MPR between groups of mice at baseline and 6 weeks after diet. Bland–Altman analysis was used to compare SFA fractions and UD between fully sampled and CS-DICT reconstructed images.
3 RESULTS
3.1 CS-DICT reconstructions and FAC-IDEAL mapping of undersampled images
Figure 6A demonstrates CS-DICT reconstructions of retrospectively undersampled images at acceleration rates of 2, 2.5, 3, and 3.5. As expected and shown in Figure 6B, 6C, RMSE and SSIM increase and decrease, respectively, as the acceleration rate increases. At rate 3 acceleration, RMSE was 4.50% ± 0.61% and SSIM was 0.85 ± 0.02, which were within our predetermined thresholds for selecting the acceleration rate to use for prospectively undersampled imaging. Thus, rate 3 acceleration was used for subsequent experiments.
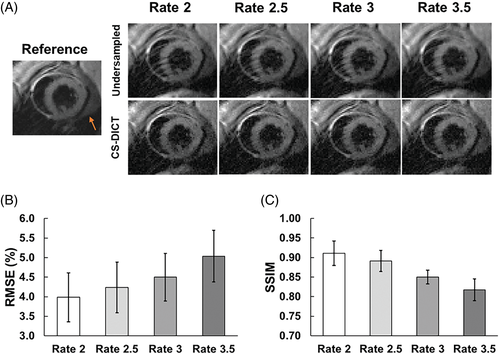
(A) Retrospectively undersampled images reconstructed using CS-DICT for the first TE at undersampling rates of 2.0, 2.5, 3.0, and 3.5 are shown with the corresponding fully sampled (reference) image. Orange arrows point toward EAT. Summary of (B) RMSE and (C) SSIM results (n = 12) shows that rate 3 acceleration provides RMSE <5% and SSIM >0.85.
EAT, epicardial adipose tissue; SSIM, structural similarity.
Figure 7 shows example EAT FAC-IDEAL maps computed from fully sampled, rate 3 retrospectively undersampled, and rate 3 prospectively accelerated CS-DICT images showing close agreement for all cases. For this example, the mean SFA, PUFA, and MUFA fractions were 0.40, 0.52, and 0.08 for fully sampled reference maps; 0.41, 0.50, and 0.09 for retrospectively undersampled maps; and 0.40, 0.53, and 0.07 for prospectively accelerated maps, respectively. Mean UD and PUD were 3.36 and 1.56 for the fully sampled case, 3.33 and 1.53 for the retrospectively undersampled, and 3.39 and 1.59 for the prospectively accelerated case, respectively. RMSE and SSIM of the FAC-IDEAL maps were 3.24% ± 0.26% and 0.90 ± 0.03 for retrospectively undersampled maps and 4.68% ± 0.37% and 0.86 ± 0.04 for prospectively undersampled maps compared to their fully sampled counterparts.
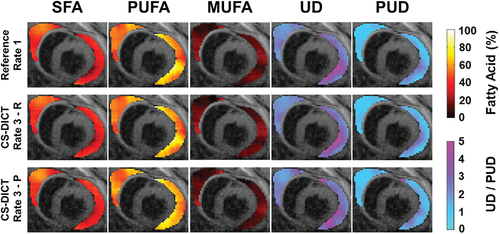
Example EAT SFA, PUFA, MUFA, UD, and PUD maps overlayed on first echo images from mice fed HFHSD. The top row shows fully sampled images (reference); the middle row shows retrospectively (R) rate-3 undersampled CS-DICT images; and the bottom row shows prospectively (P) rate 3 accelerated CS-DICT images. MUFA, monounsaturated fatty acid; PUD, polyunsaturated degree; PUFA, polyunsaturated fatty acid; CS-DICT, compressed.
3.2 Validation of FAC-IDEAL
The measured SFA, PUFA, MUFA, UD, and PUD values of the 3 oils and axillary adipose tissue from FAC-IDEAL of fully sampled and rate 3 accelerated CS-DICT images, as well as from NMR spectroscopy, are summarized in Table 1. As shown, for the oil phantoms, all FAC parameters from fully sampled and rate 3 accelerated images were within 14% of their corresponding NMR spectroscopy values. For in vivo imaging of axillary adipose tissue in mice, FAC parameters from fully sampled and rate 3 accelerated images were within 7% of one another, and both were within 7% of NMR spectroscopy values for the measurement of SFAs and UD. However, for PUFAs and PUD, FAC-IDEAL values from fully sampled and rate 3 accelerated images were 8%–24% higher than NMR spectroscopy; and for MUFAs, they were 20%–30% lower than NMR spectroscopy. Based on these results, for EAT we had high confidence for estimating SFA and UD, and lower confidence in breaking down the unsaturated fraction into PUFAs and MUFAs or estimating the PUD.
| SFA | PUFA | MUFA | UD | PUD | ||
|---|---|---|---|---|---|---|
| Phantoms | ||||||
| Sesame oil | NMR | 0.25 | 0.40 | 0.35 | 3.45 | 1.20 |
| FAC-IDEAL (Ref) | 0.23 | 0.40 | 0.37 | 3.50 | 1.19 | |
| FAC-IDEAL (R = 3) | 0.22 | 0.42 | 0.36 | 3.58 | 1.25 | |
| Olive oil | NMR | 0.29 | 0.26 | 0.45 | 2.91 | 0.78 |
| FAC-IDEAL (Ref) | 0.29 | 0.28 | 0.44 | 2.96 | 0.83 | |
| FAC-IDEAL (R = 3) | 0.29 | 0.29 | 0.42 | 3.01 | 0.87 | |
| Vegetable oil | NMR | 0.27 | 0.62 | 0.11 | 4.05 | 1.86 |
| FAC-IDEAL (Ref) | 0.26 | 0.61 | 0.13 | 4.05 | 1.83 | |
| FAC-IDEAL (R = 3) | 0.26 | 0.65 | 0.10 | 4.18 | 1.94 | |
| In vivo | ||||||
| Axillary adipose tissue | NMR | 0.36 ± 0.04 | 0.39 ± 0.07 | 0.25 ± 0.04 | 3.10 ± 0.29 | 1.18 ± 0.17 |
| FAC-IDEAL (Ref) | 0.37 ± 0.07 | 0.45 ± 0.03 | 0.18 ± 0.03 | 3.34 ± 0.25 | 1.37 ± 0.13 | |
| FAC-IDEAL (R = 3) | 0.38 ± 0.06 | 0.43 ± 0.03 | 0.19 ± 0.03 | 3.16 ± 0.22 | 1.29 ± 0.11 |
- CS-DICT, compressed-sensing/dictionary; FAC-IDEAL, fatty acid composition–iterative decomposition with echo asymmetry and least-squares; MUFA, monounsaturated fatty acid; PUD, polyunsaturated degree; PUFA, polyunsaturated fatty acid; SFA, saturated fatty acids; UD, unsaturated degree.
3.3 EAT FAC mapping, EAT volume, and myocardial perfusion reserve in EPL-treated mice fed HFHSD
Figure 8A shows example EAT SFA and UD maps acquired using a prospectively rate 3 accelerated multi-echo GRE sequence, reconstructed using CS-DICT, and mapped using FAC-IDEAL for an untreated HFHSD mouse and an EPL-treated HFHSD mouse, demonstrating a reduction of SFAs and increase UD with EPL treatment. Figure 8B, 8C summarizes the results from both groups of mice using both fully sampled and rate 3 accelerated CS-DICT images. In EPL-treated versus untreated HFHSD mice (6 weeks of diet or diet and drug), the EAT SFA fraction was significantly reduced (0.26 ± 0.09 vs. 0.41 ± 0.07, P < 0.01, fully sampled; 0.27 ± 0.09 vs. 0.39 ± 0.07, P < 0.05, accelerated). UD was significantly increased (4.49 ± 0.42 vs. 3.44 ± 0.53, P < 0.01, fully sampled; 4.37 ± 0.32 vs. 3.69 ± 0.58, P < 0.05, accelerated). In addition, EAT volume was reduced in EPL-treated versus untreated mice (11.4 ± 0.7 mg vs. 8.1 ± 0.6 mg, P < 0.01). PUFA, MUFA, and PUD results (Supporting Information Table S1), as well as Bland–Altman analysis comparing rate 3 accelerated and fully sampled EAT FAC mapping (Supporting Information Figure S1), are provided in the supplemental data. The PUFA, MUFA, and PUD results also support the finding that EPL treatment promotes a shift toward increasing EAT unsaturation compared to untreated HFHSD mice.
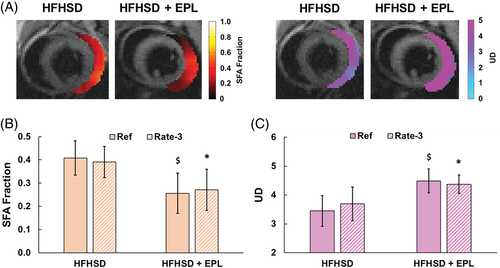
(A) Example FAC-IDEAL SFA and UD maps from rate 3 accelerated CS-DICT reconstructed images in untreated (HFHSD) and EPL-treated (HFHSD + EPL) mice showing a shift toward reduced SFAs and an increased UD in EPL-treated mice. EPL significantly altered the EAT FAC as (B) SFAs were significantly reduced, and (C) UD was significantly elevated after 6 weeks of HFHSD compared to untreated mice fed HFHSD (n = 10/group). There were no significant differences in the SFA and UD estimates when comparing FAC-IDEAL of fully sampled (Ref) and rate 3 accelerated CS-DICT images. *P < 0.05 versus HFHSD. $P < 0.01 versus HFHSD. EPL, eplerenone; HFHSD, high-fat high-sucrose diet.
Figure 9A shows rest and adenosine-stress myocardial perfusion results at baseline and 6 weeks post-diet in both groups of mice measured using ASL. Stress perfusion trended lower than baseline in both untreated and EPL-treated mice 6 weeks after initiating HFHSD, but the reduction was not statistically significant. Figure 9B shows that MPR was reduced at 6 weeks post-diet compared to baseline (before HFHSD) in untreated (1.61 ± 0.17 vs. 2.09 ± 0.22, P < 0.01) and EPL-treated mice (1.83 ± 0.15 vs. 2.06 ± 0.19, P < 0.05), and MPR was improved post-diet in EPL-treated versus untreated mice (1.83 ± 0.15 vs. 1.61 ± 0.17, P < 0.05), indicating that EPL improves coronary microvascular function in mice fed HFHSD.

(A) Rest and adenosine-stress myocardial perfusion and (B) MPR measurements in untreated and EPL-treated mice at baseline and 6 weeks post-diet (n = 8/group). *P < 0.01 versus rest. $P < 0.01 versus HFHSD baseline. #P < 0.05 versus HFHSD + EPL baseline and P < 0.05 versus HFHSD 6 weeks. MPR, myocardial perfusion reserve.
4 DISCUSSION
To the best of our knowledge, the present results represent the first application of FAC MRI to epicardial adipose tissue, the first demonstration of undersampling/acceleration applied to FAC MRI, and the first use of MRI to show that a drug shifts the FAC of adipose tissue to achieve a reduction of SFAs and increases in UD. Based on the knowledge that SFAs are proinflammatory, FAC MRI to quantify a reduction in SFAs and an increase in UD may represent a new imaging biomarker for detecting proinflammatory versus anti-inflammatory EAT. Further, our finding that EPL treatment shifts the EAT FAC toward reduced SFAs and higher UD, and that these effects are associated with an improvement in coronary microvascular function as measured by adenosine MPR, suggest that these MRI methods may probe the EAT as it functions as a transducer of metabolic inflammation to the coronary microvessels.
4.1 Accelerated FAC imaging
Because FAC MRI of EAT is time consuming (e.g., requiring ∼25 min using an unaccelerated protocol for mouse imaging), we investigated acceleration using undersampling with randomness and image reconstruction using CS-DICT. Using a rate 3 undersampled sequence, the FAC MRI scan time was reduced from ∼25 min to ∼8 min while maintaining high SSM and low RMSE. Whereas the present sequence used Cartesian sampling, in the future an undersampled radial k-space trajectory could potentially further shorten the scan time. Furthermore, although we chose to use a double-echo sequence with flyback gradients, another possible choice would be a 3-echo sequence with bipolar readout gradients. However, this approach would likely require an additional phase correction. We chose the flyback approach for simplicity.
The specific undersampling pattern and CS-DICT framework used in this study were extensions of methods from Liu et al.31 with modifications. First, Liu et al. used the same undersampling mask for each echo because blip gradients can induce phase errors and inaccurate model estimations; however, their sampling pattern did not provide incoherence along the TE dimension. With 2 echoes per acquisition, we did not encounter significant problems related to the phase errors described by Liu et al.; thus, we varied the undersampling pattern along the TE dimension, facilitating the exploitation of sparsity in that dimension. Second, because Liu's work involved fat fraction imaging and not FAC imaging, their dictionary consisted of 3 parameters (fat fraction, ψ, and ) rather than the 6 needed for FAC (F1, F2, F3, F4, ψ, and ). Accordingly, Liu et al. required just 1 element in α and 1 round of OMP, whereas we used 4 elements in α and 4 rounds of OMP. Also, for parameter mapping, Liu et al. performed a final round of OMP, whereas we applied FAC-IDEAL after the CS-DICT reconstruction due to the fairly coarse step sizes of our dictionary.
One limitation of the present study is that we did not develop autocalibration methods to compute sensitivity maps because our protocol involved the acquisition of additional fully sampled images from which we could generate sensitivity maps. In the future, we will develop autocalibration methods to overcome this limitation. A limitation of CS-DICT was that the reconstruction time for 1 dataset was approximately 10 min (using a system with a 3.4 GHz Intel[R]i7 CPU and 24 GB RAM), where the most computationally expensive step was OMP. Strategies such as K-singular value decomposition to condense the dictionary and reduce computation times could help address this issue.44
4.2 FAC MRI optimization
In our study, the Cramér-Rao analysis showed low FAC parameter variances using 10 echoes; an echo spacing of 0.3 ms; and an initial TE of 2.0 ms, which was the shortest TE possible using a pixel bandwidth of 390 Hz/pixel and the default RF excitation pulse. These parameters led to an echo train length of 2.7 ms, which is shorter than the 6.5 ms recommended by Berglund at 7 T.22 However, B0 inhomogeneity due to heart–lung interfaces at 7 T36 precludes the use of TEs longer than approximately 5 ms for cardiac imaging in mice because they lead to signal loss and image distortion in GRE images. The echo train length that we used of 2.7 ms facilitated both good-quality GRE images and low FAC variances. In the future, a shorter RF pulse could be used.
In this study, we acquired data using a uniform echo spacing. Prior studies using Cramer-Rao bounds for T1 and T2 mapping showed that the optimal sampling scheme yielded a distribution concentrated at certain points rather than uniform sampling.45, 46 A nonuniform sampling pattern could potentially be more optimal for FAC MRI with the caveat that TEs would also need to be optimized to prevent spectral aliasing, and such methods may be investigated in the future.
4.3 Validation
FAC-IDEAL estimates of all parameters (SFA, PUFA, MUFA, UD, and PUD) agreed closely with NMR spectroscopy for sesame, olive, and vegetable oil. For axillary adipose tissue, FAC-IDEAL estimates of SFA and UD agreed closely with NMR spectroscopy; however, the agreement with NMR spectroscopy for PUFAs, MUFAs, and PUD was not as well correlated. Specifically, PUFAs were overestimated by 15%–24%; MUFAs were underestimated 20%–30%; and PUD was overestimated 8%–21%. One potential explanation for the discrepancies may be PUFA-to-MUFA oxidation during the interim between euthanization, EAT extraction, and NMR spectroscopy.47
Although we used FAC MRI to measure SFA and UD values of 0.41 and 3.44, respectively, in the EAT of mice fed a HFHSD, using FAC MRI others have measured SFA and UD values of 0.41 and 2.72 and 0.43 and 2.53 in subcutaneous adipose tissue and visceral adipose tissue, respectively, in obese male patients.24 In visceral adipose tissue of mice fed a high-fat diet, these values were 0.37 and 2.44.27 Compared to other fat depots, our EAT data show good agreement for SFA, but UD values in EAT were higher. This may be related to the heart's use of EAT as a reservoir of fatty acids for ATP generation with a preference toward unsaturated fatty acids.48 We also measured significant differences in PUFA fractions, MUFA fractions, and PUD in EAT versus other fat depots. Specifically, our estimates of PUFAs and PUD were higher, and MUFAs were lower compared to the other depots (Supporting Information Table S1). One possible explanation to the discrepancy is that our measurements of PUFA and MUFA in the EAT contain errors related to the FAC-IDEAL methodology. There may be a significant amount of unsaturated free fatty acids without a corresponding triglyceride backbone in EAT48 that leads to an overestimation of PUFAs using FAC-IDEAL.49 A second limitation to the FAC-IDEAL model is that, although it accounts for triglyceride fatty acid chains with 0, 1, or 2 double bonds, fatty acid chains with more than 2 double bonds, which should not be neglected in adipose tissue,50, 51 would manifest as an overestimated F4 value corresponding to incorrectly high PUFA and low MUFA value. At present, we have higher confidence in our FAC-MRI estimates of SFA and UD for the in vivo assessment of EAT in mice, and lower confidence in the measurements of EAT PUFA, MUFA, and PUD. For SFA and UD, our phantom and in vivo axillary adipose tissue data show close agreement with NMR spectroscopy, and the values are similar to in vivo values in other adipose tissue depots as reported by others. Understanding why estimates of EAT PUFA, MUFA, and PUD disagree with other adipose depots warrants further investigation in the future.
4.4 Role of EAT in coronary microvascular dysfunction
In obese mice treated with EPL, we measured a reduction in EAT volume, a shift in EAT FAC toward greater unsaturation with decreased SFAs and an increased UD, and an improvement in adenosine MPR, reflecting improved coronary microvascular function. Various studies have linked proinflammatory EAT to the development of cardiovascular diseases including coronary microvascular disease and heart failure with preserved ejection fraction.3, 52-54 In addition, mineralocorticoid receptor activation drives adipose tissue inflammation55, 56 whereas mineralocorticoid receptor antagonism has shown promise to reduce adipose inflammation in obesity.33, 57 In this study, we also measured a reduced EAT volume in EPL-treated mice consistent with prior studies in high-fat diet fed mice.32, 33 The role of SFAs to promote adipogenesis58 and macrophage polarization through TLR4 signaling16(p4); the capacity of UFAs in limiting adipose cell and tissue size58; and the correlation between EAT volume, inflammation, and risk of developing cardiovascular diseases1 are all well documented. Together, these results support the hypotheses that (a) a highly saturated EAT can adversely influence the coronary vasculature potentially by promoting EAT hypertrophy and acting as a transducer of metabolic inflammation, and (b) the SFA fraction and degree of unsaturation of EAT may represent biomarkers and potential therapeutic targets for the treatment of coronary microvascular disease.
There were some additional limitations to our study. FAC-IDEAL was validated in oil phantoms as well as axillary adipose tissue but not in EAT. Validation of EAT using NMR spectroscopy, gas chromatography, or mass spectrometry could further substantiate our results; however, the very small volume of EAT in mice (10–15 mg) prevented our ability to make these measurements. In the future, we also plan to do experiments to associate EAT FAC with macrophage markers and cytokine arrays.
5 CONCLUSION
Rate 3 accelerated FAC MRI enables quantification of the EAT SFA and UD in mice with acquisition times of approximately 8 min per slice. The acceleration methods we employed should apply to any adipose tissue depot. Our results demonstrate that these methods can detect shifts in EAT FAC toward presumably anti-inflammatory states with certain drug treatments, and that the shift is associated with improvements in coronary microvascular function. Future work toward mapping EAT FAC in human subjects may build upon the methods and results that we presented.
ACKNOWLEDGMENT
We thank R. Jack Roy for his expertise in small animal MRI and Dr. Jeffrey Ellena for his expertise in NMR spectroscopy. We also acknowledge support from the UVA Center for Engineering in Medicine.
FUNDING INFORMATION
Supported by the National Institute of Health (NIH) National Institute of Biomedical Imaging and Bioengineering (NIBIB) grant R01 EB001763; National Heart, Lung, and Blood Institute (NHLBI) grant R01 HL162872; and the US-Israel Binational Science Foundation grant BSF2017200
Open Research
DATA AVAILABILITY
All scripts and data are available upon request of the corresponding author.


