Correcting for imaging gradients–related bias of T2 relaxation times at high-resolution MRI
Natalie Bnaiahu and Noam Omer contributed equally to this work.
Funding information: Israel Science Foundation, Grant/Award Number: 2009/17
Click here for author-reader discussions
Abstract
Purpose
High-resolution animal imaging is an integral part of preclinical drug development and the investigation of diseases' pathophysiology. Quantitative mapping of T2 relaxation times (qT2) is a valuable tool for both preclinical and research applications, providing high sensitivity to subtle tissue pathologies. High-resolution T2 mapping, however, suffers from severe underestimation of T2 values due to molecular diffusion. This affects both single-echo and multi-echo spin echo (SSE and MESE), on top of the well-known contamination of MESE signals by stimulated echoes, and especially on high-field and preclinical scanners in which high imaging gradients are used in comparison to clinical scanners.
Methods
Diffusion bias due to imaging gradients was analyzed by quantifying the effective b-value for each coherence pathway in SSE and MESE protocols, and incorporating this information in a joint T2-diffusion reconstruction algorithm. Validation was done on phantoms and in vivo mouse brain using a 9.4T and a 7T MRI scanner.
Results
Underestimation of T2 values due to strong imaging gradients can reach up to 70%, depending on scan parameters and on the sample's diffusion coefficient. The algorithm presented here produced T2 values that agreed with reference spectroscopic measurements, were reproducible across scan settings, and reduced the average bias of T2 values from −33.5 ± 20.5% to −0.1 ± 3.6%.
Conclusions
A new joint T2-diffusion reconstruction algorithm is able to negate imaging gradient–related underestimation of T2 values, leading to reliable mapping of T2 values at high resolutions.
1 INTRODUCTION
To date, MRI's T2 relaxation time is used in a mostly qualitative manner (ie, via T2-weighted imaging). Quantitative assessment of this parameter (qT2) has been shown to be useful, such as for promoting early detection,1, 2 differentiating disease states,3 saving invasive procedures,4 and generally providing more accurate depiction of tissues' state and viability.5, 6 A few specific applications include the use of qT2 for cancer research,3, 7, 8 musculoskeletal imaging,4, 5, 9, 10 diagnosis of ischemic stroke,2, 11 assessment of cognitive impairment in neurodegenerative diseases,12, 13 diabetes,14 cardiac pathology,4 as well as its higher sensitivity for detecting pathology in tissues that appear healthy in conventional radiologic reading.6, 15-17
Preclinical animal studies done on high-resolution MRI scanners are very common for studying healthy and pathological processes.7, 14, 18-22 These studies precede clinical trials (often referred to as bench to bedside) and constitute an essential stage for drug discovery. Mapping T2 values using single spin-echo (SSE or Hahn echo) or multi-echo spin-echo (MESE or Carr-Purcell-Meiboom-Gill) protocols, however, is highly challenging due to the long scan times of SSE, and the strong contamination of MESE signals by stimulated and indirect echoes21 (pulse diagrams are shown in Supporting Information Figure S1). These are inherent to MESE protocols and result from the use of imperfect refocusing RF pulses that, instead of applying perfect 180° refocusing, impart a range of flip angles across the slice profile, instigating a myriad of coherence pathways (CPs) that make up the final signal. The other two factors that affect T2 mapping are exchange between different magnetic environments and diffusion (jointly termed as non-dipolar terms).23 The contribution of both factors vary between MESE and SSE protocols, resulting in different T2 values. Apart from depending on the magnetic field variation within each voxel, these effects depend on the TE in SSE and on the echo spacing and the number of refocusing pulses in MESE.
These problems are further exacerbated when imaging small FOVs at high spatial resolutions due to inadvertent encoding of molecular diffusion caused by the use of strong imaging gradients. This spurious diffusion decay will be different for each CP, leading to a complex underestimation of T2 values, which depend on the protocol timing diagram and the experimental parameters such as in-plane resolution, FOV, slice thickness, or the acquisition bandwidth.
Diffusion bias of MESE protocols has been traditionally overlooked in imaging applications, with some focus given to its influence on SSE protocols. In 1961, Woessner showed theoretical calculations of diffusion decay caused by one-dimensional constant gradient over four echoes.22 In 1990, Neeman formulated a theoretical derivation for the effect of diffusion in a volumetric SSE protocol,24 followed by a study by Goelman et al, who incorporated the two effects of stimulated echoes and diffusion weighting when performing spectroscopic SE (ie, Carr-Purcell-Meiboom-Gill) scans with background gradient.25 More recently, Weigel et al added anisotropic diffusion to the extended phase graph algorithm, which describes coherence state generated by an arbitrary refocusing angles.26 Additional work by Oakden et al demonstrated and characterized the diffusion-related underestimation of T2 values in imaging MESE protocols.27
In this work we present a comprehensive analysis of SSE and MESE signal bias that is related to imaging gradients, while accounting for both the stimulated echoes and diffusion weighting that affect MESE protocols. The presented analysis does not correct the biases caused by non-dipolar effects, and which are governed by the tissue composition. These include water exchange between subvoxel compartments and diffusion in areas where the magnetic field change is caused by local variability in magnetic susceptibility. To that end, a comprehensive signal model was developed, incorporating the imperfect refocusing slice profiles, T2 relaxation, and imaging-related attenuation. A separate solution was formulated for each CP based on the local ADC value, while incorporating all relevant scan parameters. We show that the bias due to imaging gradients can severely impair the accuracy of T2 mapping, and that this bias can be compensated for, producing accurate T2 maps that are reproducible across scanners and scan settings. Validations of the new algorithm are presented for phantoms and in vivo mice brains on a horizontal 7T and a vertical 9.4T preclinical scanner.
2 THEORY
2.1 Conventional mapping of T2 relaxation times
2.2 Modeling the effect of diffusion on SSE and MESE signals
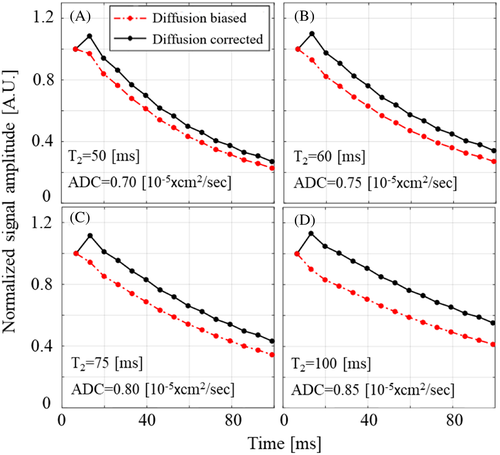
During MESE and SSE protocols, imaging gradients are applied in three directions: readout, phase encoding, and slice selection. High-resolution imaging involves the use of high-power magnetic field gradients, leading to substantial attenuation of the signals due to inadvertent encoding of molecular diffusion. The magnitude of these gradients is determined by the experimental parameter, such as slice thickness, voxel size, FOV, acquisition bandwidth (BWacq), and TE, where high-resolution scans require stronger gradients. The effect is, moreover, cumulative, meaning that as TEs become longer (on SSE) and the echo train progresses (on MESE), the diffusion-related decay increases, causing further underestimation of T2 values. Examples for the diffusion weighting caused by imaging gradients in a MESE protocol are shown in Figure 1 for several diffusivity regimes that match mice brains at 7 T.
2.3 The diffusion correction algorithm
The diffusion correction procedure was performed in three parts starting by mapping all CPs in a given protocol, calculating each CP's effective b-value, followed by combining the diffusion-related and T2-related decays into an extended EMC dictionary. The input to the algorithm consisted of SSE or MESE data and an ADC map, calculated from a standard DTI scan.
Step III: Calculating the effective b-value of each coherence pathway. Each CP has a unique evolution pattern, seeing as it “spends” part of the time along the transverse XY plane where it is affected by T2 and diffusion related decay, and part of the time along the longitudinal direction where it undergoes T1 relaxation. As a result, each CP will accumulate a different diffusion encoding. By fully tracking the temporal evolution of each CP, we calculated its effective b-value and corresponding diffusion-related decay as a function of the series of GRO, GPE, and GSS gradient pulses. Although GRO and GSS remain constant for all k-space lines, GPE changes between lines, having a somewhat complex effect on each x-y location. This gradient, however, is also the weakest of the three channels, causing a relatively small diffusion encoding. The PE gradient amplitude was therefore set to a weighted average of all PE gradient pulses.
The calculation was repeated for each location along the slice profile, and per ADC(x,y,z) value. To alleviate the computational burden of this procedure, we first identified a limited number of ADC values existing in the assayed tissue (typically 0.6, 0.7, …, 1.6 mm2/s) and performed the analysis only for this discretized set of values.
Step IV: Calculating the overall gradients-related diffusion decay per TE. The diffusion-related signal decay was calculated by first summing the subset of CPs that contribute to each TE, followed by summing the relative contribution of each location along the slice profile according to Equation (5).
Step V: Integration of the gradients-related diffusion decay into the EMC model. The EMC algorithm is based on matching experimental signals to a simulated dictionary of T2 decay curves .28 To account for diffusion, each dictionary entry was multiplied by the diffusion-related decay at each TE. Practically, this resulted in a series of dictionaries, each corresponding to a different ADC value . The choice to account for diffusion effects by multiplying the theoretical dictionary by a decay factor (0 … 1), instead of dividing the experimental signal by the same factor, was done due to the fact that a multiplication operation is much more stable than a division, which might lead to divergence of the solution at late TEs where the diffusion-related decay factor might be close to zero.
Step VI: Fitting experimental signals to the diffusion-corrected EMC dictionary. In the last step, the experimental signals from each voxel were fitted to the diffusion-corrected EMC dictionary. The ADC value at each location was determined from the DTI scan, and then used to choose the correct EMC dictionary.
3 METHODS
3.1 Sample preparation
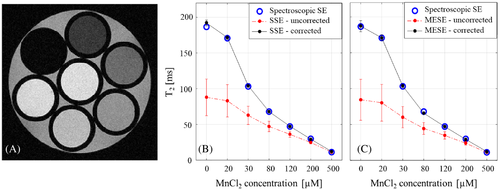
An imaging phantom was prepared using seven 3-mm NMR tubes. First, tubes were filled with distilled water doped with MnCl2 at concentrations of 0.5, 0.2, 0.12, 0.08, 0.05, 0.03 and 0.02 mM, producing a physiological range of T2 values (higher MnCl2 concentration induces shorter T2 values). The seven tubes were then grouped together and inserted into a single 10-mm NMR tube (see Figure 2A).
3.2 Magnetic resonance imaging scans
Phantoms scans were performed on a 9.4T vertical scanner (Bruker Biospin), using a transceiver 1H 10-mm coil at constant temperature of 25°C. Scanner was equipped with a three-channel gradient system with maximal power of 300 and maximal slew rate of 66 . Reference T2 values were estimated using a spectroscopic SE scan. This is a nonimaging MR protocol consisting of a 90° pulse, followed by a 180° pulse, and acquisition at increasing TEs of 5, 10, 15, 20, 25, 30, 40, 50, 70, 90, 110, 140, 170, 200, 250, and 300 ms. The pulse sequence diagram is shown in Supporting Information Figure S1. A series of DTI scans with four b-values = 0, 250, 500, 1000 (s/mm2) was used to estimate the diffusion coefficient of each MnCl2 tube (voxel size = 150 × 150 μm2, δ = 2 ms, Δ = 30 ms, slice thickness = 0.8 mm, acquisition bandwidth = 300 kHz, Naverages = 2, TR = 3500 ms). The DTI slices were aligned perpendicular to the scanner's bore to ensure that diffusion is encoded along the physical x, y, and z directions. Next, SSE and MESE imaging data were collected using different spatial resolutions, TEs, slice thicknesses, TRs, matrix sizes, and FOVs as delineated in Table 1. Remaining parameters were Naverages = 2, NEchoes = 40 (SSE: {8, 16,…, 320 ms}, MESE: {8, 16,…, 320},{10, 20,…, 400}, and {12, 24,…, 480} ms). To avoid T1 effects in the MnCl2 phantom experiments, a long TR of 6000 ms was used.
| Scan No. | Matrix size | FOV (cm) | BW (kHz) | TR (s) | TE (ms) | Slice thickness (mm) | Slice gap (%) |
|---|---|---|---|---|---|---|---|
| SSE scan parameters | |||||||
| 1–4 | 128, 96, 140, 192 | 1 | 50 | 6 | 8 | 1 | 0 |
| 5 | 128 | 1.5 | 50 | 6 | 8 | 1 | 0 |
| 6 | 96 | 2 | 50 | 6 | 8 | 1 | 0 |
| 7–8 | 128 | 1 | 50 | 6 | 8 | 0.5, 2 | 0 |
| 9–10 | 128 | 1 | 75, 35 | 6 | 8 | 1 | 0 |
| MESE scan parameters | |||||||
| 1–4 | 128, 96, 140, 192 | 1 | 50 | 6 | 8 | 1 | 0 |
| 5 | 128 | 1.5 | 50 | 6 | 8 | 1 | 0 |
| 6 | 96 | 2 | 50 | 6 | 8 | 1 | 0 |
| 7–9 | 128 | 1 | 50 | 6 | 8 | 0.3, 0.5, 2 | 0 |
| 10–11 | 128 | 1 | 75, 35 | 6 | 8 | 1 | 0 |
| 12–14 | 128 | 1 | 50 | 6 | 8 | 1 | 0 |
| 15–17 | 128 | 1 | 50 | 6 | 8 | 1 | 20, 50, 100 |
| 18–19 | 128 | 1 | 50 | 6 | 10, 12 | 1 | 0 |
| 20–22 | 128 | 1 | 50 | 2, 3, 10 | 8 | 1 | 0 |
In vivo scans of a mouse brain were performed on a Bruker 7T horizontal scanner (Bruker Biospin) using an 86-mm 1H transceiver coil at a constant temperature of 25°C. Scanner was equipped with a three-channel gradient system with maximal power of 200 and maximal slew rate of 66 . Mouse was handled according to the Guide for the Care and Use of Laboratory Animals published by the National Research Council, and under the guidelines of Tel Aviv University's ethics committee. Scans included DTI (same parameters as detailed in the phantom scans) and a series of MSME scans with varying in voxel sizes (64 × 64 × 800, 80 × 80 × 800, 100 × 100 × 800, 125 × 125 × 800, 150 × 150 × 800, 125 × 125 × 300, and 200 × 200 × 300 μm3). Remaining MESE parameters were (echo spacing = 9 ms, NEchoes = 20, slice thickness = 0.8 mm, acquisition bandwidth = 50 kHz, Naverages = 2, and TR = 3000 ms). Automatic shimming was performed before each scan.
3.3 Data postprocessing
Spectroscopic SE data were fitted to a standard exponentially decaying signal model, providing reference T2 values. The SSE images from each TE were corrected for diffusion bias using the suggested algorithm (single CP, as no stimulated echoes affect this protocol), followed by fitting to an exponentially decaying model. The MESE T2 values were generated using the diffusion-corrected EMC algorithm.
Regions of interest (ROIs) were marked at the center of each tube in the phantom T2 maps, and mean ± SD of T2 values were estimated within each 3-mm tube. In vivo brain images were segmented to assess T2 values at three representative ROIs: the cortex, the corpus callosum (CC), and the hippocampus (HIPP). The ADC values were estimated per ROI from the DTI scans and incorporated into the EMC algorithm to produce unbiased T2 maps.
3.4 Test–retest analysis of diffusion-corrected MESE T2 values
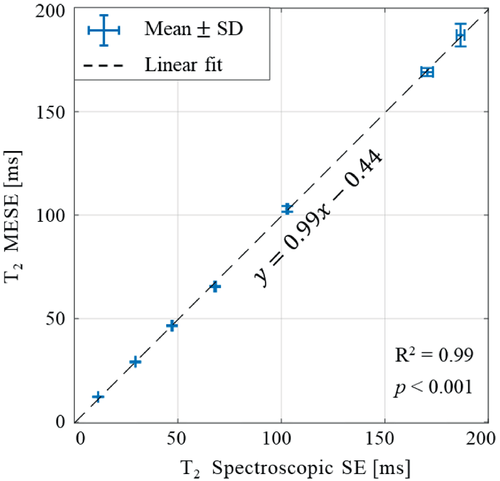
Interscan variability of the diffusion-corrected T2 values was evaluated by performing 16 repeated MESE scans of the MnCl2 phantom shown in Figure 2A, and using the parameter set given in Table 1 (MESE scan no. 5). Mean, SD, and coefficient of variation across repeated scans were calculated for each tube. Values were then compared against reference values derived using the nonselective spectroscopic SE scan.
4 RESULTS
4.1 Diffusion-corrected quantification of T2 values of MnCl2 phantom
The same diffusion coefficient of 2.29 × 10⁻⁵ (cm2/s) resulted for all seven MnCl2 tubes, corresponding to water in 25°C. Corrected and uncorrected MESE T2 values across different experimental TEs are presented in Table 2 vis-à-vis spectroscopic SE reference values. A significant decrease in measurement error is seen for the diffusion-corrected values, reducing the average error from −28.9 ± 17.7 ms to −0.3 ± 3.0 ms (across all TEs and tubes). Diffusion correction produced higher relative error only for the shortest T2 values (500 μM concentration). This high error, however, results from the small baseline T2 values and reflects a negligible absolute error of less than 1 ms. Similar results were obtained across other ranges of experimental parameters including refocusing flip angles, acquisition bandwidths, and refocusing RF pulse shapes (see Supporting Information Tables S1–S3, respectively). A dramatic improvement in the accuracy of T2 values was obtained for all assayed parameters, with an average reduction of the fitting error from −27.6 ± 26.5 ms to 1.0 ± 2.7 ms across refocusing flip angles, from −30.9 ± 17.8 ms to −0.1 ± 4.0 ms across acquisition bandwidths, and from −35.1 ± 24.8 ms to −0.7 ± 4.0 ms across different refocusing RF pulse shapes. A consistent increase in the error of uncorrected values was observed for longer T2 values. This pattern emerged for all tested parameters (Table 2, Supporting Information Tables S1–S3) and results from the accumulation of diffusion bias for longer echo trains and TEs, leading to relative errors of up to 70%. To demonstrate how much of the bias is due to imaging gradients, effective b-values at representative TEs are shown for two pairs of SSE and MESE protocols that were acquired with the same scan settings. The table shows increasing values (ie, greater signal attenuation due to diffusion) with increasing TEs (see Supporting Information Table S4).
| Spectroscopic SE (no imaging) | MESE (imaging) | ||||||||||
|---|---|---|---|---|---|---|---|---|---|---|---|
| MnCl2 | TE = {5, 10,…,300}a ms | TE 8 ms | TE 10 ms | TE 12 ms | |||||||
| Conc. [μM] | T2 (ms) | SD (ms) | T2 (ms) | SD (ms) | Error (%) | T2 (ms) | SD (ms) | Error (%) | T2 (ms) | SD (ms) | Error [%] |
| Postdiffusion correction | |||||||||||
| 500 | 11.5 | 0.0 | 12.3 | 0.7 | 6.5 | 12.1 | 0.8 | 4.9 | 12.3 | 1.1 | 7.0 |
| 200 | 29.5 | 0.1 | 29.3 | 0.8 | −0.5 | 29.1 | 0.9 | −1.4 | 29.2 | 1.0 | −1.0 |
| 120 | 47.2 | 0.3 | 46.6 | 1.3 | −1.2 | 46.8 | 1.5 | −0.7 | 47.1 | 1.7 | −0.2 |
| 80 | 68.0 | 0.4 | 65.9 | 1.8 | −3.2 | 65.1 | 1.7 | −4.3 | 65.4 | 1.8 | −3.9 |
| 50 | 102.9 | 0.4 | 103.8 | 2.9 | 0.8 | 101.8 | 2.7 | −1.1 | 101.9 | 2.9 | −1.0 |
| 30 | 170.5 | 2.8 | 169.0 | 7.9 | −0.9 | 167.5 | 6.8 | −1.7 | 169.0 | 6.5 | −0.9 |
| 20 | 186.6 | 1.9 | 188.1 | 7.4 | 0.8 | 181.8 | 6.3 | −2.6 | 184.7 | 6.7 | −1.1 |
| Prediffusion correction | |||||||||||
| 500 | 11.5 | 0.0 | 11.3 | 0.7 | −2.1 | 11.0 | 0.8 | −4.8 | 11.7 | 1.0 | 1.1 |
| 200 | 29.5 | 0.1 | 24.3 | 0.8 | −17.6 | 24.1 | 1.1 | −18.3 | 26.3 | 1.2 | −10.6 |
| 120 | 47.2 | 0.3 | 35.9 | 1.3 | −23.9 | 34.6 | 2.2 | −26.7 | 40.5 | 2.4 | −14.2 |
| 80 | 68.0 | 0.4 | 46.2 | 1.8 | −32.1 | 44.3 | 3.7 | −34.9 | 53.4 | 3.4 | −21.6 |
| 50 | 102.9 | 0.4 | 61.6 | 2.9 | −40.1 | 59.5 | 6.5 | −42.2 | 76.1 | 6.6 | −26.1 |
| 30 | 170.5 | 2.8 | 81.7 | 7.9 | −52.1 | 76.3 | 13.1 | −55.2 | 109.0 | 14.2 | −36.1 |
| 20 | 186.6 | 1.9 | 83.9 | 7.4 | −55.0 | 81.6 | 21.8 | −56.3 | 115.0 | 22.5 | −38.4 |
- a Spectroscopic SE TEs are indicated in the “MRI scans” section.
Figure 2 illustrates the effectiveness of the diffusion correction for SSE and MESE data. The error bars in both panels indicate the distribution of values across different spatial resolutions, slice thicknesses, and acquisition bandwidths (see Table 1), highlighting the capability of the diffusion-corrected EMC algorithm to not only remove diffusion related bias, but also to provide T2 values that are more stable across different scan settings.
Figure 3 presents two examples for the dependency of measures T2 values on the in-plane resolution and slice thickness before and after diffusion correction (for baseline T2 = 102.9 ms as determined by spectroscopic SE). The level of diffusion encoding increases for smaller voxel sizes due to the use of stronger imaging gradients, which lead to higher relative error. The diffusion-corrected EMC algorithm provides more accurate values and higher stability across spatial resolutions, with a negligible variability across in-plane resolutions and slice thicknesses. Test–retest analysis of MESE values is shown in Figure 4 vis-à-vis reference values, derived using a nonselective spectroscopic SE protocol. Diffusion-corrected values were in almost perfect agreement with reference values (R2 = 0.99, p < 0.001) and exhibited low interscan variability, reflecting an average coefficient of variation of 1.2% across 16 repeated scans.

4.2 In vivo quantification of diffusion-corrected T2 values in a mouse brain
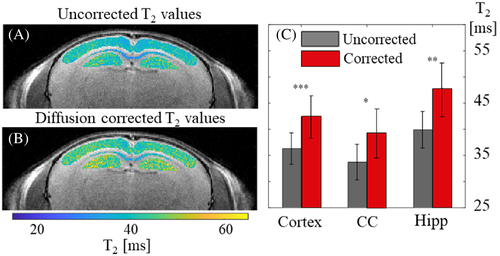
The diffusion coefficients measured along the three physical directions (Dx, Dy, Dz) in the mouse brain were (5.9 × 10⁻⁶, 5.5 × 10⁻⁶, 6.6 × 10⁻⁶ cm2/s) for the cortex; (9.2 × 10⁻⁶, 4.2 × 10⁻⁶, 6.7 × 10⁻⁶ cm2/s) for the CC; and (5.7 × 10⁻⁶, 5.5 × 10⁻⁶, 6.6 × 10⁻⁶ cm2/s) in the HIPP. Figure 5 illustrates the diffusion-related underestimation of T2 values across the three brain regions with respect to the corrected values (voxel size 64 × 64 × 800 μm3). A statistically significant change in T2 values was observed following correction for the three brain ROIs, demonstrating the significant bias caused by the spurious diffusion encoding.
The effect of using different experimental parameter values is exemplified in Figure 6, comparing the T2 values in the three assayed ROIs before and after diffusion correction, and for two scan resolutions: a high in-plane resolution (125 × 125 × 800 μm3) and a thin slice (200 × 200 × 300 μm3). Analyzing the difference in uncorrected T2 values between the two scan resolutions produced statistically significant differences within all three ROIs (p-values < 0.01 for all ROIs). This undesired variability across scan settings was removed following diffusion correction in the CC and HIPP with p-values = 0.36 and 0.13, respectively. Cortex T2 values were also much similar across the two spatial resolutions following diffusion correction, although they remained statistically different (44.35 ± 2.29 vs. 42.42 ± 4.11 ms) in spite of the large overlap between the two values. This results from the inherent variability within this large region and the relatively large number of voxels (N = 347).
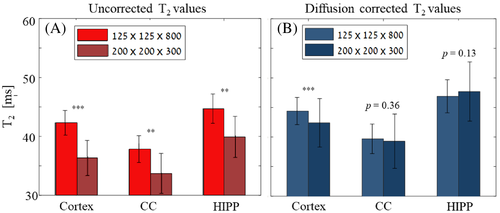
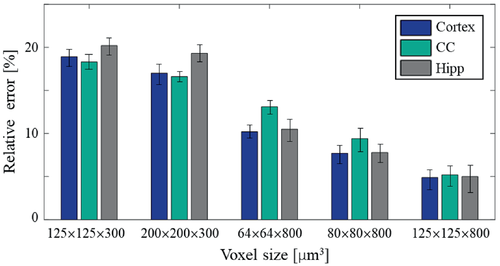
Figure 7 complements this result by showing the percent error between original and corrected T2 values across five different voxel sizes. Diffusion-related errors increased with smaller in-plane resolutions (125 × 125 ➔ 80 × 80 ➔ 64 × 64 μm2) for a fixed slice thickness. An even more pronounced increase of the error occurred when shifting between slice thicknesses of 800 μm to 300 μm, confirming that most of the undesired diffusion encoding results from gradient pulses along the slice dimension (ie, the slice selective and crusher gradients). Scans using thin slices exhibited the highest error in the HIPP and smallest in the CC (left two voxel sizes in Figure 7). In contrast, high in-plane resolution scans displayed the most extensive error in the CC (growing larger as resolution increased), and the smallest error in the cortex (right three voxel sizes in Figure 7). The reason for this lies in tissues' ADC values: The HIPP had the highest ADC along the slice-selective (z) direction, resulting in higher sensitivity to the large z-gradients used to achieve thinner slices. The CC, on the other hand, had a higher ADC along the readout (x) direction, leading to higher sensitivity to changes in in-plane resolutions and to the strength of the readout gradients.
5 DISCUSSION
Quantitative mapping of T2 relaxation times is biased by molecular diffusion due to dipolar and non-dipolar effects (the latter is governed by exchange and diffusion), magnetic susceptibility (derived from the tissue composition and orientation), and imaging gradients. The current study presents an algorithm for compensating the latter of these mechanisms, which has a significant effect on the MRI signal when performing high-resolution imaging due to the use of strong imaging gradients. This gradients-related bias leads to inadvertent encoding of molecular diffusion, which varies in intensity for different experimental parameters including in-plane resolutions, slice thicknesses, acquisition bandwidth, TEs, and RF pulse shapes. Changes in these parameters within a MESE scan will give rise to different evolution of coherence-pathways, while also changing the effective diffusion encoding (b-value) imparted by the imaging gradients. One approach to overcome this bias is to work in a regime where minimal diffusion encoding takes place, such as avoid very thin slices, high in-plane resolutions, or reduce the pre-/post-refocusing RF crusher gradients. These solutions, however, are quite limiting and might not be practical for many studies. The algorithm proposed herein addressed the diffusion-related bias by incorporating its effect into the analysis of each and every coherence pathway comprising MESE signals. Results show that this extensive diffusion-related bias can be reduced from up to 70% error, to a level that can be attributed to natural interscan variability. This was, for example, demonstrated in the in vivo results where a statistically significant difference was observed across different scan settings (voxel sizes) before correction, whereas significantly reduced difference was observed after diffusion correction.
Unlike phantoms that exhibit a homogenous microstructure and thus suffer from diffusion-related bias only due to imaging gradients, our in vivo data were also biased by non-dipolar effects originating from microscopic magnetic field gradients caused by variations in magnetic susceptibility or inter-compartmental exchange.23 Because these biases were not compensated for, the reported T2 values in Figures 5-7 reflect the correction of only the imaging gradients bias, while other effects remain the same. Further attention should be given to T2 anisotropy (another factor that can bias the measured T2 value in ordered structures). In the white matter, for example, this mechanism was shown to reduce the T2 values of fibers perpendicular to the direction of the magnetic field.34 The proposed technique does not compensate for this mechanism.
Because the proposed method corrects T2 bias based on the local diffusion coefficient, we have limited the in vivo analysis (Figures 5-7) to three representative regions. Voxel-wise analysis of the entire brain will require mapping the ADC values of the entire brain, accurate registration between EPI (diffusion) and MESE (T2) data, and an expansion of the EMC dictionary to cover the range of diffusion coefficients that exist within the tissue. This will require extensive computation power, a different implementation of the presented algorithm, and is left for future work.
Both the phantom and the in vivo mouse brain scans showed that the spatial resolution, and specifically the slice thickness, has the strongest effect on the spurious diffusion encoding. Accordingly, thin slices showed higher signal loss due to diffusion in comparison to thicker slices—even when high in-plane resolutions were used. This is primarily due to the relatively strong slice-selective gradient strengths associated with very thin slices and the strong diffusion encoding caused by the pair of crusher gradients surrounding each SE refocusing pulse. Another reason is the fact that the thinner the slice the farther is the slice profile from a perfect rectangle, leading to additional loss of coherence as a larger percent of the slice undergoes imperfect refocusing. In our experiments, the narrowest slice thickness was 300 μm. In vivo studies can reach slices as thin as 100 μm, where much higher bias in T2 values is expected. Another important factor is the echo spacing (TE). The dependency on this parameter, however, is untrivial, as reflected by the uncorrected values in Table 2, where increasing the TE from 8 to 10 ms increases the effect of diffusion decay, while a further increase from 10 to 12 ms decreases this effect. This behavior can be attributed to the typical reduction in crusher gradients' power when using longer TEs, and secondly, to the complex interplay between the TE and the relative fractions of longitudinal versus transverse magnetizations. The balance between these two components, moreover, changes after the application of each refocusing pulse, leading to a nontrivial dependency on TE. Finally, diffusion-related bias will also depend on the tissue's intrinsic ADC value, as was shown in the in vivo results that required adjustment of the algorithm to the local diffusion coefficient.
The effect of molecular diffusion is cumulative in time, and therefore increases for long TEs and long echo trains. As a result, a higher bias is expected for longer T2 values. This different bias of short and long T2 components may introduce errors in multicomponent analysis techniques that aim to estimate the relative fraction of different subvoxel compartments.35-39 This is, for example, important when calculating the myelin water fraction parameter used in many studies of neurodegenerative diseases. Still, even samples with relatively short T2 values can suffer from a significant underestimation of tens of percent in T2 values for thin slices (see Supporting Information Table S1 and Figure 3). This effect does not skip SSE protocols, which, although used in many cases as reference technique, also suffer from significant bias due to imaging gradients (Figure 2). This leaves nonselective spectroscopic SE protocols as the preferred reference technique, notwithstanding residual bias due to non-dipolar effects. These depend on the main field (B0) variations, on the TE, and on inhomogeneities of the transmit (B1+) field, which can perturb the refocusing flip angles. In this study we used SSE as reference technique and compared it with imaging MESE and SSE protocols. These protocols are biased differently than spectroscopic SE by non-dipolar effects, yet these are negligible in homogeneous phantoms and therefore justify our selection.
The usefulness of quantitative MRI depends, among other things, on the ability to deliver the same values across different scanners and scan settings. Variabilities can result from the use of different experimental parameters, different RF coils, or different implementations of the acquisition protocols, including the choice of RF pulse shape; the strength, location, and polarity of the crusher gradients; and the location of the readout pre-phasing gradient (before or after the refocusing RF pulse). The diffusion-corrected EMC algorithm is immune to these changes, as it incorporates the protocol timing diagram and exact experimental parameter values into its signal model.28, 29
6 CONCLUSIONS
Accurate mapping of T2 relaxation times at high resolutions requires us to compensate for diffusion-related signal bias, which would otherwise lead to significant underestimation of fitted values. This spurious bias will also impair multi-T2 component analysis, such as the calculation of myelin water fractions, and may generally affect the quantification of other MR parameters such as relaxation times and magnetization transfer ratio (when using slice-selective protocols). Considering the increased use of high-field scanners for drug discovery, and the constant rise in scan resolutions, effects such as the diffusion bias discussed herein will become more and more prominent. The diffusion-corrected EMC algorithm addresses this problem directly, to accurately characterize and negate its effects. Another key feature of the algorithm is its ability to produce values that are invariant across scanners and scan settings, thereby facilitating longitudinal and multicenter studies. Finally, the presented algorithm may also be relevant when imagining small organs using high-field human scanners (eg, in whole-body 7T and 10.5T scanners), whose utility for research and clinical uses is continuously increasing.
The current implementation can be further improved by expanding the analysis of the tissue's diffusion properties to more advanced models including q-space analysis, intravoxel incoherent motion analysis, and the consideration of non-Gaussian diffusion models. These will be particularly important when applying multicomponent subvoxel analysis techniques.


