Gradient-echo-train-based sub-millisecond periodic event encoded dynamic imaging with random (k, t)-space undersampling: k-t get-SPEEDI
Funding information:
National Institutes of Health, Grant/Award Numbers: 5R01EB026716, 1S10RR028898
*The work was presented in part at the 29th Annual Meeting of the ISMRM in 2021 (Abstract No. 0834).
Click here for author-reader discussions
Abstract
Purpose
The gradient-echo-train-based Sub-millisecond Periodic Event Encoded Dynamic Imaging (get-SPEEDI) technique provides ultrahigh temporal resolutions (∼0.6 ms) for detecting rapid physiological activities, but its practical adoption can be hampered by long scan times. This study aimed at developing a more efficient variant of get-SPEEDI for reducing the scan time without degrading temporal resolution or image quality.
Methods
The proposed pulse sequence, named k-t get-SPEEDI, accelerated get-SPEEDI acquisition by undersampling the k-space phase-encoding lines semi-randomly. At each time frame, k-space was fully sampled in the central region whereas randomly undersampled in the outer regions. A time-series of images was reconstructed using an algorithm based on the joint partial separability and sparsity constraints. To demonstrate the performance of k-t get-SPEEDI, images of human aortic valve opening and closing were acquired with 0.6-ms temporal resolution and compared with those from conventional get-SPEEDI.
Results
k-t get-SPEEDI achieved a 2-fold scan time reduction over the conventional get-SPEEDI (from ∼6 to ∼3 min), while achieving comparable SNRs and contrast-to-noise ratio (CNRs) for visualizing the dynamic process of aortic valve: SNR/CNR 70/38 vs. 73/39 in the k-t and conventional get-SPEEDI scans, respectively. The time courses of aortic valve area also matched well between these two sequences with a correlation coefficient of 0.86.
Conclusions
The k-t get-SPEEDI pulse sequence was able to half the scan time without compromising the image quality and ultrahigh temporal resolution. Additional scan time reduction may also be possible, facilitating in vivo adoptions of SPEEDI techniques.
1 INTRODUCTION
Despite advances in fast MRI techniques,1, 2 the temporal resolution of MRI is typically limited to tens of milliseconds or longer nowadays for most pulse sequences to acquire an image. To resolve dynamic processes of rapid physiological activities and/or physical processes, new MRI acquisition techniques that provide temporal resolutions at millisecond level began to emerge in recent years.3-6 One of these techniques is Sub-millisecond Periodic Event Encoded Dynamic Imaging (SPEEDI),4 which has been successfully applied to measuring rapid electric current changes in a phantom with a 0.2 ms temporal resolution,4 and used for visualizing the ultrafast dynamic process of human aortic valve opening and closing with a temporal resolution of 0.6 ms.5 These ultrahigh temporal resolutions suggest new opportunities of using SPEEDI to detect transient evolutions of cyclic physical and physiological phenomena.
In SPEEDI, a cyclic event is time-locked to a free induction decay (fid-SPEEDI)4 or a gradient echo train (get-SPEEDI).5 By using phase-encoding only (such as in fid-SPEEDI) or a combination of phase- and frequency-encoding (such as in get-SPEEDI), each point in the FID or each echo in the gradient-echo train corresponds to a distinctive k-space matrix. A collection of the k-space matrices across multiple time points in the FID or gradient-echo train can capture the dynamic process with an ultra-high temporal resolution. To complete k-space sampling in 2D fid-SPEEDI, the event must be repeated Nx × Ny times, where Nx and Ny are the number of phase-encoded k-space data points in a 2D k-space raster. Although the acquisition efficiency can be improved by using compressed sensing,4 conventional SPEEDI experiments typically require a rather long scan time because of the need for multiple repetitions of the event. Compared to fid-SPEEDI, get-SPEEDI can drastically decrease the required event repetitions. Although get-SPEEDI can provide sufficient spatial and temporal resolutions for visualizing dynamic processes of fast physiological activities, its acquisition speed, however, remains inadequate for many demanding in vivo applications. For example, in aortic valve imaging using get-SPEEDI, the subject needs to perform approximately 8-10 breath-holds (160 heart beats) over a period of ∼6 min to acquire dynamic images with 80 phase-encodings at a single slice location.5 Such a long scan time imposes physiological burdens to the subject and negatively affects the subject's compliance, limiting the practical adoption of get-SPEEDI in a clinical setting. Hence, to extend in vivo applications of SPEEDI techniques, it is necessary to reduce the number of event cycles and consequently the scan time.
Sparse sampling in k-space is a robust method for scan time reduction, as demonstrated in many applications.7 In particular, image acceleration techniques based on spatiotemporal partial separability8 fit naturally to get-SPEEDI as they have demonstrated great efficacy in Cartesian imaging that samples k-space line by line. Furthermore, get-SPEEDI is mainly used in spatiotemporal imaging studies to acquire time series of dynamic processes. k-space undersampling and image reconstruction methods using partial separability can accelerate spatiotemporal imaging without a significant loss of image quality, and therefore, provide an attractive solution for acquisition of time series with high spatiotemporal resolutions.9, 10 The aim of this study is to illustrate that the sparse sampling technique based on spatiotemporal partial separability can be adopted in get-SPEEDI to improve its acquisition efficiency. In this study, we demonstrate an accelerated variant of get-SPEEDI, named k-t get-SPEEDI, to reduce the scan time by using random undersampling in k-space and time domain (i.e., [k, t]-space), followed by image reconstruction with the joint constraints of partial separability and sparsity (PS-Sparse).10 This approach allows fewer phase-encoding lines to be acquired at a given time frame without compromising the spatial resolution. Through this k-space unsampling technique, we expect k-t get-SPEEDI to effectively reduce the scan time and therefore, overcome the major drawback of the get-SPEEDI technique, substantially enhancing its practical applications. In this paper, we present the pulse sequence design of k-t get-SPEEDI, describe the image reconstruction method, and illustrate improved time efficiency of k-t get-SPEEDI for visualizing the rapid opening-closing process of the human aortic valve, in comparison with conventional get-SPEEDI.
2 METHODS
2.1 Pulse sequence design
As shown in Figure 1A, a k-t get-SPEEDI sequence was built on get-SPEEDI5 where a train of gradient echoes was used. The echo train acquisition was triggered by a periodic event (e.g., electrocardiogram [ECG]) with a time delay τ. The data acquired at different echoes during the echo-train readout were distributed into separate k-space matrices. Multiple echo trains were acquired during an event trigger to form M time blocks (TBs), where M is the number of echo trains. Each TB contains L (L is the echo train length [ETL]) k-space matrices and the time interval between 2 adjacent k-space matrices is determined by the echo spacing (esp). Because the esp is typically shorter than 1 ms, the temporal resolution of get-SPEEDI can reach the level of sub-millisecond, which allows for resolving ultrafast cyclic events.
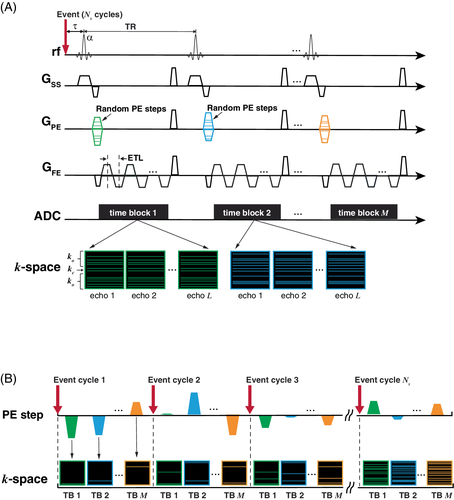
Assuming the image acquisition matrix = Np in the phase-encoding (PE) direction, then the event needs to repeat Np cycles to complete a conventional get-SPEEDI scan.5 Therefore, the total image acquisition time = Np × M × TR, where TR is the repetition time. To reduce the scan time, a random (k, t)-space undersampling scheme10 was implemented in the k-t get-SPEEDI sequence. Compared to get-SPEEDI, the initial PE gradients (i.e., PE steps) used for acquiring the multiple gradient-echo trains in an event cycle were not constant, but randomly varied with different TBs in k-t get-SPEEDI (Figure 1A). Furthermore, the number of PE steps required for reconstructing an echo image was reduced from Np to Ns by undersampling k-space, corresponding to an acceleration factor of R = . The k-space data of one image were divided into a central (kc) and an outer (ko) k-space regions (Figure 1A). The Nc PE lines in kc were fully sampled, whereas the ko region was randomly undersampled with (Ns − Nc) lines. The echo-train images in a given TB shared the same k-space sampling pattern, and the patterns of ko were randomized across different TBs. During the scan, the PE steps corresponding to the sampled k-space lines of an image were played out in a random order in different event cycles, leading to randomly and sparsely filled k-space raster in the outer region (Figure 1B). By using this random PE and sparse k-space sampling strategy, the image acquisition was completed after Ns event cycles. Therefore, k-t get-SPEEDI was able to reduce the number of event cycles and scan time by a factor of R.
2.2 Image reconstruction for sparsely sampled (k, t)-space data
The PS-Sparse image reconstruction for k-t get-SPEEDI consisted of the following 3 steps (Figure 2): (1) The k-space matrices at the same echo index were extracted from all the TBs to create L k-space time series, each of which included M time points; (2) The echo k-space time series were separately reconstructed with the PS-Sparse algorithm; (3) One complete image time series was obtained by aligning the echo time series in the time order relative to the event trigger.

2.3 Experiments on human subjects
For demonstration and comparison, both get-SPEEDI and k-t get-SPEEDI scans were performed on healthy subjects to visualize the rapid opening and closing process of aortic valve. The human study was approved by the institutional review board and performed with written informed consent.
2.3.1 Image acquisition
All scans were carried out on a 3 T GE Discovery MR750 scanner (General Electric Healthcare, Waukesha, WI) with a 32-channel phased-array cardiac coil. To determine a proper imaging plane through the aortic valve, a series of breath-hold localization scans were performed, including scout images and cine balanced steady-state free precession images with 2-, 3-, and 4-chamber and short-axis views. The balanced steady-state free precession images were acquired with FOV = 38 × 22 cm, slice thickness = 8 mm, acquisition matrix = 216 × 224, TR/TE = 3.3/1.3 ms, flip angle = 50°, acceleration factor = 2, and 18 views per segment. To visualize the opening and closing process of the aortic valve, an image plane orthogonal to the outflow tract of the aorta was selected based on the 3-chamber view balanced steady-state free precession images.11
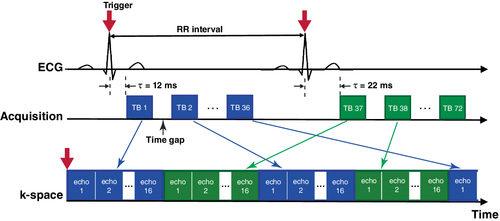
Both get-SPEEDI and k-t get-SPEEDI pulse sequences were applied to the image plane of aortic valve. The acquisition matrix size was 80 × 118 (Np = 80) in the get-SPEEDI scan. The k-t get-SPEEDI scan used Ns = 40 and Nc = 6 to achieve an acceleration factor of 2. The other imaging parameters common to the 2 scans were: TR/TE = 20/8.8 ms, flip angle = 10°, FOV = 24 × 24 cm, slice thickness = 8 mm, ETL (L) = 16, and esp = 0.6 ms. As described in the previous study,5 ECG trigger was used to synchronize the sequences, and the image acquisition was triggered at the peak of the ECG R-wave. To adequately and efficiently cover the time span of the aortic valve opening and closing, an “interleaved multi-phase” acquisition mode was used to fill in the time gaps between TBs (Figure 3). Two ECG trigger delays (12 and 22 ms, respectively) were set in the scan with 36 cardiac phases for each trigger delay, corresponding to M = 72. The get-SPEEDI/k-t get-SPEEDI needed 160/80 heart beats and 8/4 breath-holds to complete the image acquisition. The total scan time including the preparation time between breath-holds was ∼6/3 min, which represented a 2-fold scan time reduction by using k-t get-SPEEDI.
2.3.2 Data analysis
Before image reconstruction, phase correction was applied to the raw k-space data acquired in the conventional get-SPEEDI and k-t get-SPEEDI scans using the commercial algorithm included in Orchestra Software Development Kit (General Electric Healthcare, Waukesha, WI). No additional issues related to eddy currents were observed in the k-t get-SPEEDI compared to the conventional get-SPEEDI scan. The phase-corrected k-space data were subsequently reconstructed offline to produce images with size = 128 × 128 using custom MATLAB (The MathWorks, Natick, MA) scripts. The get-SPEEDI images were obtained from individual coil channels with fast Fourier transform followed by a sum-of-squares combination. The PS-Sparse method was used to reconstruct the k-t get-SPEEDI images using the model order = 8 and = 2.5 × 10⁻³. A total of 1152 (= L × M) image time frames was generated from each scan with a temporal resolution of 0.6 ms.
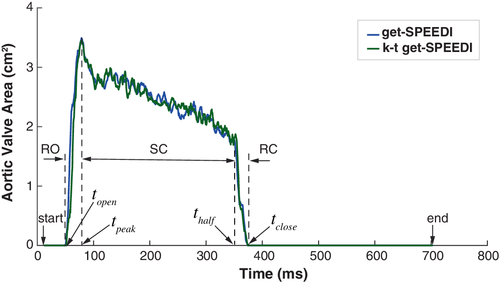
To evaluate the image quality of k-t get-SPEEDI for visualizing dynamic changes of the aortic valve, the image containing the aortic valve was segmented from the time series using a semiautomatic method, in which the initial contour of aortic valve was manually drawn and then refined by a contour detection algorithm.12 The area of aortic valve (AVA) was calculated at each time point to create the time course of AVA. The opening and closing process of aortic valve can be divided into 3 phases based on the AVA time course: rapid opening (RO), slow closing (SC), and rapid closing (RC).5 To facilitate the description of the 3 phases, the following 4 timing parameters were defined: the time when AVA began to rise from 0 (topen), reached to the maximum AVA (tpeak), decreased to half of the maximum AVA (thalf) and to 0 (tclose). The time windows of RO, SC, and RC were topen − tpeak, tpeak – thalf, thalf – tclose, respectively. To assess the accuracy of k-t get-SPEEDI in detecting the dynamics of the aortic valve (i.e., from topen to tclose), the AVA time course over the same time range was also obtained from the get-SPEEDI scan, followed by computing Pearson's correlation coefficient between the AVA time courses of k-t get-SPEEDI and get-SPEEDI. The corresponding SNR of aortic valve and its contrast-to-noise ratio (CNR) to the right atrium were also obtained by using the signal in a region-of-interest in the background to represent noise.13, 14 The standard deviation of noise was 1.53σ where σ is the measured standard deviation of the background intensity and the factor 1.53 corrects for the Rayleigh distribution of background intensity in magnitude images.15, 16 The SNR and CNR values were averaged over the time series during topen – tclose and compared between k-t get-SPEEDI and get-SPEEDI.
3 RESULTS
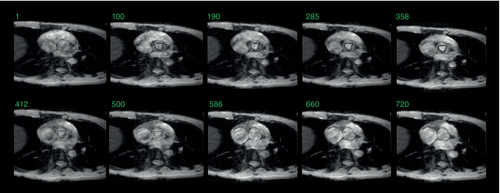
Figure 4A and B show the get-SPEEDI and k-t get-SPEEDI image time series, respectively. In both scans, the aortic valve opening and closing dynamics were well resolved at a temporal resolution of 0.6 ms. k-t get-SPEEDI provided similar image quality and identical temporal resolution while achieving a 2-fold scan time reduction. Slight “ghosting” artifacts were present outside the heart in the lower regions of some get-SPEEDI images (Figure 4A). In addition, moderate streaking artifacts were also observed on the right side of the images acquired with get-SPEEDI. These artifacts, however, were absent in the k-t get-SPEEDI scan (Figure 4B). The artifacts could be caused by inconsistencies between different k-space segments introduced by the respiratory motion.17

The AVA time courses from the get-SPEEDI and k-t get-SPEEDI scans are illustrated in Figure 5A. It can be seen that the time course of k-t get-SPEEDI agreed well with that of get-SPEEDI. The aortic valve dynamics also showed similar timing parameters in the 2 scans (Table 1). The 3 phases of the aortic valve opening-closing process were clearly visible in the AVA time courses: the RO phase started at about 53 ms after the R-wave peak and reached the maximum opening area (AVA ≈ 3.5 cm2) at ∼80 ms (peak time). The aortic valve experienced the SO phase thereafter until ∼353 ms, and then completely closed within 16 ms at the RC phase. During this dynamic process, the AVA time course of k-t get-SPEEDI was highly correlated with that of get-SPEEDI (correlation coefficient = 0.86). The average SNR/CNR of aorta during the aortic valve dynamic process in the get-SPEEDI scan was 73 ± 12/39 ± 9, and decreased by only ∼4%/3% in the k-t get-SPEEDI scan (SNR/CNR = 70 ± 15/38 ± 12). These measurements further support the observation that k-t get-SPEEDI was able to provide comparable image quality as get-SPEEDI.
| Scan | topen | tpeak | thalf | tclose | TRO | TSC | TRC | Ttotal |
|---|---|---|---|---|---|---|---|---|
| get-SPEEDI | 53.4 | 79.8 | 353.4 | 369.0 | 26.4 | 273.6 | 15.6 | 315.6 |
| k-t get-SPEEDI | 54.6 | 76.2 | 355.8 | 367.8 | 21.6 | 279.6 | 12.0 | 313.2 |
- Note: TRO, TSC, TRC are the durations of rapid opening, slow closing, and rapid closing phases, respectively. Ttotal is the total duration of the aortic valve opening and closing process.
4 DISCUSSION
In this study, we developed a more time efficient variant of get-SPEEDI pulse sequence—k-t get-SPEEDI—by integrating a (k, t)-space undersampling technique with a PS-Sparse reconstruction algorithm. Using k-t get-SPEEDI, we were able to reduce the number of event cycles, and consequently the scan time, by 2-fold. The sparsely sampled k-space data in k-t get-SPEEDI were reconstructed with the PS-Sparse algorithm to produce unaliased images. As demonstrated in the human aortic valve imaging experiments, the accelerated k-t get-SPEEDI and the conventional get-SPEEDI produced comparable image quality for visualizing the temporal characteristics of aortic valve dynamics at a temporal resolution of 0.6 ms. Therefore, higher acquisition efficiency was achieved without loss of image quality. This demonstration suggests a viable way to overcome a major limitation (i.e., long scan times) of SPEEDI techniques for in vivo applications, particularly those involving human subjects.
Through (k, t)-space undersampling that halved the scan time, the subjects only needed to perform 4-5 breath-holds during the k-t get-SPEEDI scan compared to 8-10 breath-holds in the conventional get-SPEEDI scan. The 2-fold reduction in the number of breath-holds substantially eased the physiological burden on the subjects and improved their compliance. In addition, the scan time reduction suppressed the inconsistency in breath-hold and the resulting respiratory artifacts (Figure 4), facilitating clinical adoption of get-SPEEDI techniques.
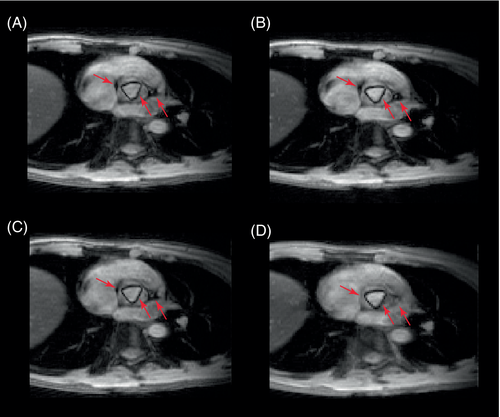
The PS-Sparse reconstruction method recovers full-size images from undersampled k-space data based on the spatial and temporal correlation properties of a time series.10 The abundant temporal sampling points (i.e., TBs) in SPEEDI allows for accelerating image acquisition through k-space sparse sampling and PS-Sparse reconstruction. In the k-t get-SPEEDI experiment for visualizing rapid aortic valve opening and closing, we used a conservative acceleration factor (R) of 2 to half the scan time, which resulted in an excellent image quality. The k-t get-SPEEDI sequence also supports a higher R. When R = 3 was attempted in the aortic valve experiments, however, the SNR and CNR of k-t get-SPEEDI images (Figure 6) decreased by 37% and 39%, respectively, relative to get-SPEEDI. This substantial degradation in image quality requires further investigation. Theoretically, it is possible to improve the image quality at higher R values when a larger number of TBs (M) is available. The maximally allowed M value is determined by the RR interval of the heartbeat (Figure 3), so M could not be substantially increased in the aortic valve imaging experiment. This limited our ability to further reduce the scan time in this study. Nonetheless, it is worth mentioning that a number of alternative reconstruction methods have been developed for accelerated spatiotemporal imaging techniques based on low-rank models and machine learning,18 such as blind compressive sensing,19 low-rank plus sparse matrix decomposition model,20 and model-based deep learning.21 These methods have demonstrated robust performance in imaging dynamic process of physiological activity. They can be potentially used to accelerate the image acquisition of get-SPEEDI with higher acceleration factors (R > 2) without degrading the image quality. Potential application of these alternative methods to get-SPEEDI should be investigated in future studies.
The PS-Sparse-based image reconstruction for k-t get-SPEEDI requires the number of reconstructed time frames be larger than the model order,10 (i.e., M > P). Moreover, the total duration of all the TBs (= M × esp) cannot exceed that of the entire physiological process under study. Therefore, to use the PS-Sparse algorithm, the total duration of physiological process must be longer than P × esp. In this study, P was set to 8 and esp was ∼10 ms, so the duration of aortic valve opening and closing process (∼300 ms) met the aforementioned duration requirement. It should be noted that the dynamic process of a physiological activity is usually composed of multiple phases. For example, the aortic valve opening and closing process includes RO, SC, and RC phases. An individual phase can be as short as ∼10 ms, but the entire physiological process may last hundreds of milliseconds. The image reconstruction algorithm of k-t get-SPEEDI imposes the duration requirement on the entire physiological activity, not on a phase in the dynamic process. In addition to the aortic valve dynamics demonstrated in the current study, k-t get-SPEEDI may be potentially used for imaging other electrophysiological activities (e.g., visual and auditory evoked potentials).22 These electrophysiological processes consist of multiple response peaks (phases) and last ∼500 ms or longer,22 which adequately satisfies the requirement of k-t get-SPEEDI on the total duration of a physiological process. Nonetheless, k-t get-SPEEDI may not be applicable to an electrophysiological process consisting of only 1 ultrashort event. For instance, the signal of a single action potential associated with neuron firing lasts for only ∼5 ms.23 Such a signal is too short for k-t get-SPEEDI to be used.
A key step of the PS-Sparse reconstruction algorithm is to solve the optimization problem constrained by the spatial and temporal priors (Equation [4]). The regularization parameter specifies the weight of the spatiotemporal priors relative to the fitting errors. The choice of value impacts the solution to this optimization problem and consequently the quality of reconstructed images. A number of methods, such as L-curve, generalized cross-validation, and discrepancy principle-based methods, have been proposed for optimal selection of regularization parameters,24 but those methods are often very time consuming. To address this issue, we used a pre-determined value (= 2.5 × 10⁻³) in our study. The value was determined by using simulated k-t get-SPEEDI data that was created by undersampling (with R = 2) the k-space data from a conventional get-SPEEDI scan. The simulated data was reconstructed with different values and the conventional get-SPEEDI images provided a ground truth for evaluating the quality of reconstructed k-t get-SPEEDI images. Both visual inspection of the reconstruction results and L-curve analysis24 were used to determine the optimal choice of . Further refinement of the optimization method is warranted to make it data-adaptive, thereby enhancing the robustness of image reconstruction for k-t get-SPEEDI.
In k-t get-SPEEDI, all the PE lines in the central k-space region (kc) were acquired at every time frame, whereas the outer k-space regions (ko) were randomly undersampled. The number of sampled PE lines in kc (i.e., Nc) was set to 6 in this study. Because the bases of temporal subspace of time series are derived from the kc data,10 in principle, temporal changes of image can be more accurately captured by sampling a larger kc (i.e., using a larger Nc value). An increase in Nc leads to reduction of samples in ko to maintain the same acceleration factor. In turn, a highly undersampled ko may result in spatial blurring in reconstructed images. Therefore, the choice of Nc needs to balance the accuracies in characterizing dynamic changes and spatial distributions of image signals. Obviously, an optimal Nc value depends on the complexity of signal changes in the time domain and can vary in different applications. In addition to Nc = 6, we also acquired k-t get-SPEEDI images with Nc = 4, 8, and 12 at the same acceleration factor (= 2). There were no appreciable variations in image quality when Nc was set to 4-8, but the edges between the aortic valve and the neighboring tissues became blurry in the images at Nc = 12, compared to those at the smaller Nc values (Figure 7). As demonstrated in Figures 4 and 5, the temporal evolution of aortic valve was detected in the k-t get-SPEEDI images with Nc = 6 and the SNR and CNR of the aortic valve reached similar levels as in the fully sampled get-SPEEDI images. This indicates that Nc = 6 was a reasonable chocie for aortic valve imaging, but an optimal Nc value must be individually determined depending on specific applications.
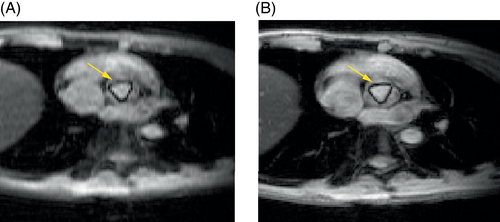
k-t get-SPEEDI is an accelerated acquisition technique based on the partially separable functions (PSF) model.9, 10 The present study focused on demonstrating that the PSF-based undersampling technique can achieve the same spatiotemporal resolution with a shorter scan time compared to the full k-space sampling used in conventional get-SPEEDI. In addition to scan time reduction, PSF-based techniques can also provide better image quality.9, 10 If the same scan time and temporal resolution are used in the conventional and PSF-based imaging, then the PSF-based imaging is expected to provide a higher image spatial resolution (i.e., a sharper image), which will offer a better image quality for visualizing and differentiating anatomic structures. To illustrate this possibility, we conducted an additional aortic valve imaging experiment with a fixed scan time (∼3 min). In the experiment, the subjects performed the same number of breath-holds (4 breath-holds) during both the conventional and the k-t get-SPEEDI scans. The acquisition matrix was decreased to 40 in the PE direction (Np = 40) in the conventional get-SPEEDI scan to match the scan time with that of k-t get-SPEEDI. As shown in Figure 8, k-t get-SPEEDI produced a sharper image than conventional get-SPEEDI. The aortic valve can be more clearly visualized and differentiated from the surrounding tissues in the k-t get-SPEEDI image.
In this study, the PS-Sparse method was chosen to reconstruct the undersampled k-space data. In addition to PS-Sparse, other methods may also be integrated into get-SPEEDI for reconstructing undersampled k-space data. Examples include conjugate gradient SENSE (CG-SENSE)25 and ESPIRiT.26 We evaluated the quality of aortic valve images reconstructed using CG-SENSE and ESPIRiT with an effective acceleration factor (R) of 1.8 (data not shown) and compared the results with those from PS-Sparse with R = 2. PS-Sparse produced sharper edges around the aortic valve than CG-SENSE or ESPIRiT, resulting in improved differentiation of the aortic valve from the surrounding tissues.
In some applications, if the tissue region to be investigated occupies only a small portion of the FOV, such as the case of the aortic valve in the chest, the image can be acquired by using a 2D RF pulse to excite a reduced FOV over the region-of-interest.27-31 Because the reduced FOV technique requires fewer PE steps to fully sample k-space, it can be used to accelerate get-SPEEDI image acquisition. A previous study30 has shown that the scan time of get-SPEEDI can be shortened by ∼32% in the aortic valve experiment with the reduced FOV strategy. The k-t get-SPEEDI proposed in this study only modifies the selection of PE steps, and its implementation does not rely on new RF pulse design. Therefore, the reduced FOV technique can be integrated into the k-t get-SPEEDI pulse sequence. With such combination, the scan time would be reduced further from what has been demonstrated in the present study.
In conclusion, k-t get-SPEEDI provides a viable way to reduce the scan time of get-SPEEDI by using the (k, t)-space random undersampling and PS-Sparse reconstruction method without compromising the temporal resolution and image quality. By addressing the issue of lengthy scan times in SPEEDI techniques, k-t get-SPEEDI is expected to substantially remove a main obstacle to practical adoption of SPEEDI-type techniques for studying ultrafast, periodic physiological and physical processes with a sub-millisecond temporal resolution.
ACKNOWLEDGMENTS
This work was supported in part by the National Institutes of Health (grant numbers, 5R01EB026716 and 1S10RR028898). The content is solely the responsibility of the authors and does not necessarily represent the official views of the National Institutes of Health. We are grateful to Drs. M. Muge Karaman and Kezhou Wang, and Guangyu Dan for helpful discussions.
Open Research
DATA AVAILABILITY STATEMENT
The MATLAB code used for the image reconstruction and analysis can be downloaded at https://github.com/uic-cmrr-3t/k-t-get-SPEEDI. The get-SPEEDI and k-t get-SPEEDI images acquired in this study will be available on direct request to the corresponding author, subject to local IRB and other regulations.


