Development of a novel 10-echo multi-contrast sequence based on EPIK to deliver simultaneous quantification of T2 and T2* with application to oxygen extraction fraction
Click here for author-reader discussions
Abstract
Purpose
The simultaneous quantification of T2 and T2* maps based on fast sequences for combined GE and SE acquisition has rekindled research and clinical interest by offering a wide range of attractive applications, e.g., dynamic tracking of oxygen extraction fraction (OEF). However, previously published methods based on EPI-readouts have been hindered by resolution and the number of acquired echoes.
Methods
This work presents a novel 10-echo GE-SE EPIK (EPI with keyhole) sequence for the rapid quantification of T2'. T2/T2* maps from the GE-SE EPIK sequence were validated using three phantoms and 15 volunteers at 3T. The incorporation of a sliding window approach, combined with the full sampling of the k-space center inherent to EPIK, enables a high effective temporal resolution. That is, for an eight-slice breath-hold experiment, a temporal sampling rate of eight reconstructed slices per 1.1 s.
Results
In comparison with repeated single-echo SE, multi-echo GE, and spectroscopy methods, the GE-SE EPIK sequence shows good agreement in quantifying T2/T2* values, while the gray matter/white matter separation yielded the expected contrast differentiation. The OEF was calculated with a view to an initial application with clinical relevance, producing results comparable to those in the literature and with good sensitivity in breath-hold experiments.
Conclusions
GE-SE EPIK provides increased resolution and more echoes, including two SEs, than comparable sequences. Moreover, GE-SE EPIK achieves this within an acquisition time of 57 s for 20 slices (matrix size = 128×128; FOV = 24 cm) and with a reasonably short TE for the final echo (114 ms). The sequence can dynamically track OEF changes in a breath-hold experiment.
1 INTRODUCTION
The combined acquisition of gradient echo (GE) and spin echo (SE) data offers potential benefits in a wide range of applications and is also advantageous in perfusion and fMRI studies, where it can be used to calculate cerebral blood volume (CBV), cerebral blood flow (CBF), and oxygen extraction fraction (OEF), potentially aiding the interpretation of various pathological and physiological effects. This is particularly relevant in the investigation of tumor heterogeneity, for example, brain tumors1. Furthermore, dynamic susceptibility contrast (DSC) MRI also benefits from the simultaneous acquisition of GE and SE data2 as it allows the different sensitivities of GE and SE to the vessel size to be exploited3.
It has been shown that T2', rapidly accessed via simultaneous T2 and T2* acquisition, is directly related to OEF4. OEF is a particularly useful parameter for the characterization of brain metabolism and physiology in different brain states, such as a loss of cerebral perfusion pressure5, for the prediction of subsequent stroke occurrence in patients with cerebrovascular disease3 and to reflect the perfusion state in acute ischemic stroke6, 7. Moreover, combining OEF with CBF data can provide access to the cerebral metabolic rate of oxygen consumption (CMRO2), giving insight into the energy consumption of neuronal activities8. As the current gold standard for OEF is O15-PET, an invasive measurement using radioactive isotopes, alternative MRI-based methods for OEF computation are very attractive. As such, the application to OEF is the focus of this manuscript.
The versatility of combined GE and SE methodology has been demonstrated in various approaches, based on a wide range of sequence implementations, and differing in the readout (single- or multiple-line acquisition), spatial resolution, number and type of echoes used. Further details relating to the most relevant of these studies can be found in Supporting Information Appendix S1.1, which is available online.
EPI outperforms single-line acquisitions in terms of acquisition time (TA) and temporal resolution, making it the current method of choice for fast imaging sequences. The matrix size used in such approaches is usually around 64×64 up to 96×96, whereby most sequences are based on five-echo implementations. Although two implementations9, 10 provided higher resolutions (128 ×128/220×220), they suffered from a small number of echoes (two/five), as well as relatively large TE of the SE (98/138 ms).
With the exception of MASAGE-IEPI11, to date, no other EPI-based sequence acquires a second SE. MASAGE-IEPI takes advantage of small SE TEs as they dispense with initial GE data to directly apply the refocusing pulse after excitation. However, MASAGE-IEPI has a low spatial resolution based on a matrix size of 64×64, and it was only applied on animal scanners. Conversely, EPI readouts in multi-echo implementations often lead to long echo-times for late echoes (e.g., 130–150 ms), resulting in a loss of SNR and a long TR, which in turn reduces the number of slices that can be covered in a given TR. To overcome these limitations, Shah et al. proposed EPIK (EPI with keyhole)12, 13, which was validated at 1.5T/3T14, 15.
To exploit EPIK, this work details the further development of five-echo GE-SE EPIK to acquire 10 GESE echoes (i.e., 2 GEs, 6 with mixed GESE contrast, and 2 SEs) for the simultaneous quantification of T2 and T2*. It is shown that the novel 10-echo GE-SE EPIK sequence outperforms previously published sequences regarding resolution and the number and timing of echoes. The first echoes provide a comparable or even shorter TE than sequences in the literature and, at the same time, the sequence is expanded with additional echoes with higher resolution. The resulting 10-echo sequence includes a second SE for enhanced contrast information and is based on a matrix size of 128×128 yielding a nominal spatial resolution of 1.9×1.9 mm2. It enables acquisitions with greater brain coverage and with acceptable TE ranges (<114 ms) at 3T, especially for the early echoes.
Compared to standard single-shot EPI with the same spatial resolution, a major advantage of EPIK is the higher effective temporal resolution because of a unique keyhole and data sharing in peripheral k-space. In contrast to multi-shot EPI, EPIK ensures a more robust acquisition of temporal signals by sampling central k-space, including the zero line of k-space, in each shot. That is, shot-to-shot instabilities are significantly reduced in EPIK compared to multi-shot EPI16, 17. Nevertheless, note that the sliding window technique can also be employed in multi-shot EPI. Additionally, unlike multi-shot EPI, EPIK samples a center of k-space in each shot, i.e., a major fraction of the k-space energy. The strength of the proposed method is in measuring the dynamic time course of relaxation times and OEF. The dynamic nature of such measurements has been shown to provide information of potential clinical interest; DSC methods make use of a dynamic T2/T2* time course to characterize blood flow and volume18. On the other hand, repeatedly measured OEF19 is useful for studying dynamic processes in brain activation.
GE-SE EPIK was verified at 3T by comparing T2 and T2* maps from phantom and in vivo data to those from reference methods. Moreover, as an initial proof-of-principle application to dynamically track an OEF time course after a modulation, GE-SE EPIK was applied in a breath-hold experiment.
2 METHODS
2.1 Sequence implementation
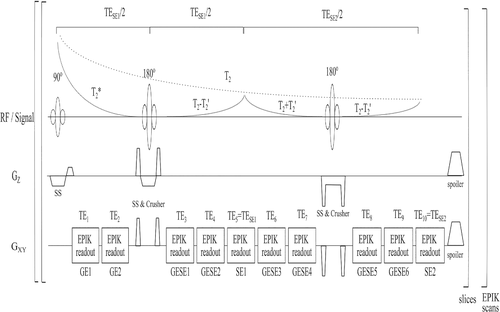
Figure 1 presents the 10-echo GE-SE EPIK sequence, including the expected signal decay and timings. All EPIK readouts were implemented with a matrix size of 128×128, giving a nominal resolution of 1.9×1.9×3 mm3 for a FOV of 24×24 cm2. An EPIK multi-shot factor of 14 with 16 keyhole lines and a GRAPPA20 factor of two was used. The k-space data reconstruction was based on a sliding window technique to ensure that the k-space line-sharing for sparse regions from consecutive data sets is continuously updated. The achievable TEs with corresponding echo types were as follows: 10(GE)/20(GE)/37(GESE)/47(GESE)/57(SE)/67(GESE)/77(GESE)/94(GESE)/104(GESE)/114(SE) ms. Further details are given in the figure caption.As the previously published GE-SE sequences based on EPI readouts mostly had a matrix size of 96×96 with one pure SE, we also implemented our 10-echo approach using a matrix size of 96×96, leading to an in-plane resolution of 2.5×2.5×3 mm3. Further details on the sequence parameters are included in the Appendix S1.2.
All measurements were performed using a 3T PRISMA (Siemens, Erlangen, Germany) with a 20-channel receiver coil; the body coil was used for transmission.
2.2 Sequence comparison
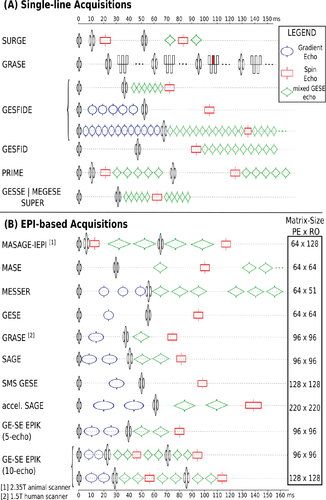
Figure 2 shows a comparison of the previously published sequences based on the simultaneous acquisition of GE and SE with two EPIK variants. The time scale on the horizontal axis aids identification of the type and timing of the implemented echoes. Here, 10-echo GE-SE EPIK is compared with EPI-based readout methods. The matrix sizes reported in the previous literature are generally 96×96 and 220×220 at maximum. This 220×220 sequence9 only acquired one pure SE at a FOV of 220 mm and a TA of 4 min. Conversely, our method is shown to be superior in terms of the combination of matrix size and the number of echoes and their TEs, i.e., 10 echoes, including two pure SEs, can be acquired with a matrix size of 128×128. Both the 96×96 and 128×128 matrix sizes offer the highest number of echoes compared to previous sequences and have the shortest TE for the first SE of all the published EPI-based sequences that contain at least one initial pure GE.
2.3 Phantom acquisition
Three single-compartment spherical phantoms were produced as described in the Appendix S1.3. Phantom measurements were conducted with four slices at a resolution of 1.9×1.9×3 mm3 and with an in-plane FOV of 24×24 cm2. Reference acquisitions for T2* were performed with a multi-echo (64) gradient-echo sequence (mGE)21 employing bipolar readout. The employed TEs ranged from 2.90 to 89.94 ms, with echo spacing of 1.38 ms and TR = 1200 ms with flip angle (FA) = 75°. Reference T2 maps were calculated using four measurements from a single-echo SE sequence (sSE), obtained at TEs of 10/35/60/85 ms, respectively, with TR = 4500 ms, FA = 90° and a 180° refocusing pulse for every SE. GE-SE EPIK with a matrix size of 128×128 was applied with the above-mentioned settings and TR = 1000 ms and FA = 90°.
Spectroscopy measurements based on a single-voxel spin-echo sequence were performed. Each spectroscopy measurement consisted of 50 averages with TR = 5 s. Six TEs were acquired for each phantom: from 30 ms with equal steps to twice the expected T2 range (80/100/180 ms for the respective three phantoms). For each phantom, four different volumes of interest (10×10×10/20×20×20/30×30×30/40×40×40 mm3), placed in the phantom center, were acquired.
2.4 In vivo acquisition
Fifteen healthy volunteers (25–52 y, six females) were recruited for this study. Written informed consent was obtained from each participant prior to the study. Ethical approval (226/09) was covered by the local ethics committee.
The acquisition protocol acquired GE-SE EPIK, mGE and repeated sSE sequences with the same settings as for the phantom measurement but with 20 slices and the following TR: GE-SE-EPIK = 2800 ms / mGE = 2000 ms/sSE = 4500 ms. This led to TA of 57 s, 4:36 min and four times 7:18 min, respectively.
To compare GE-SE EPIK images for the two spatial resolutions, a male volunteer was measured with a protocol consisting of GE-SE EPIK sequences with a matrix size of 96×96 and 128×128, each with the same number of slices20 and TR (2800 ms) as above.
Breath-hold experiments were performed on three healthy volunteers, acquiring GE-SE EPIK data in six consecutive blocks, each consisting of 50 repetitions, leading to a TA = 60 s for eight slices with TR = 1100 ms and a FA = 75°. The volunteers were instructed to breathe during the first block of 1 min, followed by 1 min of breath-holding on inspiration; this procedure was repeated twice more.
1 Fitting
To obtain relaxation time maps, the following analysis was performed on the images reconstructed from the acquired data.
Here, TESE1 and TESE2 are the TEs of both spin echoes, respectively. R2 and R2* are the relaxation rates, which are inversely related to the TRs T2 and T2*. δ and Δ are additional fitting parameters intended to correct for the effect of imperfect refocusing pulses. The mean values of δ and Δ obtained for phantom data were 1.10 and 1.16, respectively, whereas the mean values for in vivo data were found to be 1.08 and 1.09, respectively.
The NLSQ approach can provide map quantifications of a single slice in below 30 s on a standard laptop (32 GB RAM; Core i7 4600 M CPU @2.90 GHz, Intel, USA).
Fat and skull were excluded by using software developed in-house to set a manual threshold on the original GE-SE EPIK image at TE = 10 ms. The largest connected cluster of voxels with non-zero values was then chosen as the ROI.
To aid gray matter (GM) and white matter (WM) ROI analysis, the images from the reference acquisitions were co-registered with SPM12 to GE-SE EPIK. Subsequently, segmentation for WM and GM masks was performed as follows. Brain masks were computed with the help of the brain tissue probability maps obtained from a standard SPM algorithm applied to the SE reference image at TE = 10 ms. Probability thresholds of 0.9 for GM and 0.98 for WM were used. For the GM mask, a further condition was applied to excluded voxels with reduced T2 due to partial volume effects: a cutoff at the mean whole-brain T2 value such that only voxels with a T2 value larger than the mean T2 of the whole-brain region in both GE-SE EPIK and reference maps were considered.
2 Spectroscopy
Spectroscopy data were Fourier transformed and frequency shifted to extract the frequency peak area as a function of TE. A mono-exponential fit for T2 was applied, and the four different volume of interest measurements were averaged for a final T2. Additionally, an exponential fit for T2* was applied directly to the FID of each single TE data of the 10×10×10 mm3 volume of interest. The smallest voxel size was chosen for the T2* measurement to reduce the influence of the more pronounced dephasing across larger voxels, which would compromise the T2* results. The final T2* was averaged from the six acquired TEs. The minimum mean square error (MMSE) was calculated from the standard deviations from the single fits for both relaxation times.
3 Oxygen extraction fraction
Data from breath-hold experiments were analyzed as described above by fitting T2/T2* to compute a mean OEF value for each slice at each of the 300 time points. To characterize the OEF changes, the slope of the OEF-time envelope was computed by a linear fit, separately for each block.
3 RESULTS
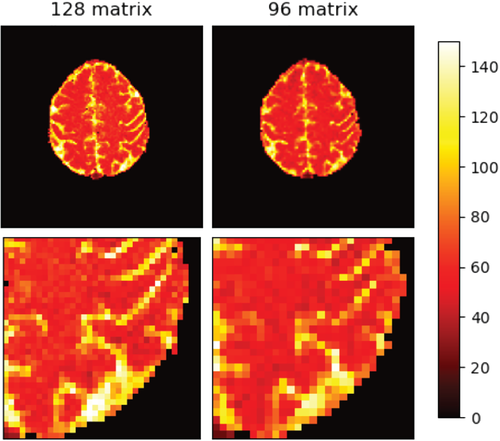
Figure 3 provides a visual comparison between the 96×96 and 128×128 matrix, showing in vivo T2 maps derived from GE-SE EPIK based on both matrix sizes. The resolution improvements are particularly visible in the zoomed areas of the image. The following results are all based on the higher resolution GE-SE EPIK implementation with a matrix size of 128×128.
3.1 Phantom
Phantom results for the carrageenan phantoms are depicted in Figure 4. T2 and T2* maps derived from GE-SE EPIK and the reference methods are shown for one exemplary slice of all three phantoms, including a difference plot on a 20% scale (Figure 4A). A mean value comparison of T2* and T2 between GE-SE EPIK, reference methods and spectroscopy is shown in Figure 4B, while 2D histograms of all acquired phantoms are presented separately for T2 and T2* in Figure 4C. The mean values for each phantom and the relaxation parameter with standard deviation obtained from the GE-SE EPIK method are given as: T2(I) = 44.82±2.35 ms, T2(II) = 54.12±3.24 ms, T2(III) = 89.97±5.19 ms, T2*(I) = 42.43±2.97 ms, T2*(II) = 51.54±3.95 ms, (III) = 84.01±5.24 ms – where I, II, and III indicate the different phantoms. T2 results with MMSE from spectroscopy measurements are given as 43.98(0.06)/54.43(0.05)/87.90(0.07) ms, respectively. The corresponding T2* results are 41.83(0.04)/52.13(0.05)/83.20(0.10) ms. Both are in good agreement with mean values from the imaging protocol. All values are summarized in Table 1.
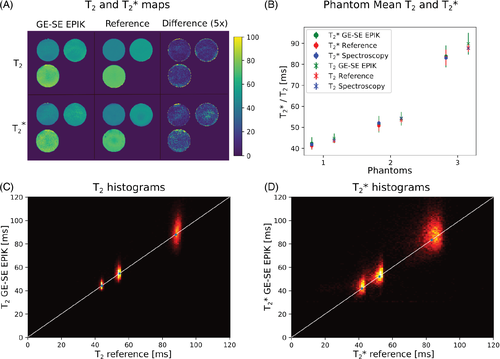
| Phantom mean (SD) | T2* [ms] | T2 [ms] | ||||
|---|---|---|---|---|---|---|
| Phantom 1 | Phantom 2 | Phantom 3 | Phantom 1 | Phantom 2 | Phantom 3 | |
| GE-SE EPIK | 42.43 (2.97) | 51.54 (3.95) | 84.01 (5.24) | 44.82 (2.35) | 54.12 (3.24) | 89.97 (5.19) |
| Reference | 41.19 (1.64) | 50.80 (2.59) | 83.43 (3.80) | 43.41 (0.73) | 53.51 (1.27) | 88.07 (1.99) |
| Spectroscopy | 41.83 (0.04) | 52.13 (0.05) | 83.20 (0.10) | 43.98 (0.06) | 54.43 (0.05) | 87.90 (0.07) |
| In vivo mean (Std) | T2* [ms] | T2 [ms] | ||||
|---|---|---|---|---|---|---|
| Whole brain | WM | GM | Whole brain | WM | GM | |
| GE-SE EPIK | 50.14 (9.28) | 50.03 (7.23) | 55.14 (8.87) | 60.53 (7.77) | 59.61 (6.06) | 67.58 (5.57) |
| Reference | 47.75 (8.91) | 47.62 (6.18) | 53.92 (8.23) | 59.86 (8.22) | 58.68 (5.05) | 69.45 (6.32) |
| Literature | 50.0 (5.6)26 | 55.7 (8.7)26 | 62 (4)27 | 67 (7)27 | ||
3.2 In vivo
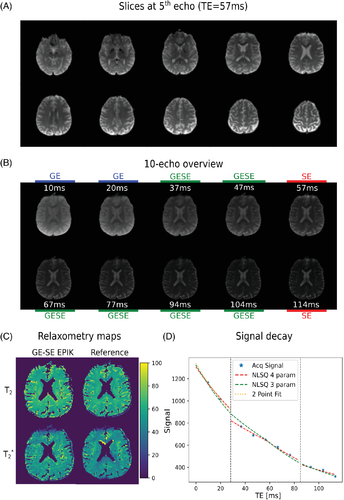
The GE-SE EPIK sequence yielded artifact-free images for all slice locations (Figure 5A) while also depicting the expected contrast evolution through the echo series (Figure 5B). Exemplary T2 and T2* maps derived from both the GE-SE EPIK method and the reference methods are shown in Figure 5C. A representative single-voxel signal decay is presented in Figure 5D. To underline the significance of δ, fitting results are also shown with and without its inclusion as an additional fitting parameter. The inclusion of δ yielded a δ value of 1.09.
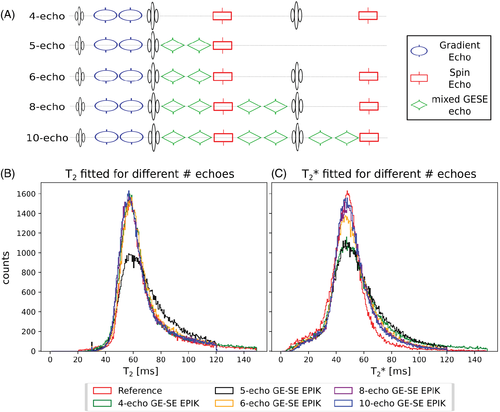
To validate the benefits of including 10 echoes in the sequence implementation over fewer echo versions, a comparison of fits using a reduced number of echoes was performed. The in vivo results are depicted in Figure 6, where the different fitting options are shown, including a four-, five-, six-, and eight-echo version; the data were extracted from the fully acquired 10-echo GE-SE EPIK dataset. While the five-echo version only includes a single SE, comparable to the implementation of SAGE or five-echo GE-SE EPIK, the remaining options account for different numbers of mixed GE-SE echoes. The resulting T2 distributions clearly demonstrate the benefit of including a second SE as the FWHM improves significantly. In terms of T2*, the mean value accuracy is unaffected by the number of fitted echoes, while the FWHM suggests the 8- and 10-echo versions are most precise. The FWHM results are summarized in the figure caption.
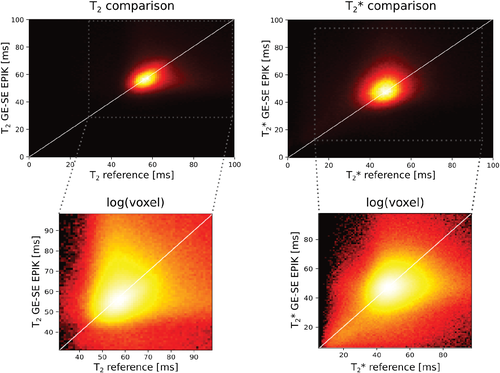
The mean T2* and T2 values with SD for whole-brain data from all 15 subjects are summarized in Table 1 for the reference and GE-SE EPIK results. The segmented WM and GM values, averaged over all 15 volunteers, are also given and compared to the literature values26, 27. Figure 7 shows the distributions of T2 and T2* for the whole brain from all volunteers in the form of 2D histograms to enable a direct comparison between GE-SE EPIK and the respective reference methods; the selected regions from the plots are zoomed and plotted using a log-scale of the voxel number. The mean whole-brain T2 value from GE-SE EPIK is 58.23±7.31 ms and 59.32±7.42 ms from the sSE reference. Based on the GE-SE EPIK data, the average T2 is 67.58±5.57 ms for GM, while WM yielded 59.61±6.06 ms. The mean whole-brain T2* values from GE-SE EPIK and the mGE reference were found to be 49.76±8.58 ms and 47.79±8.19 ms, respectively. The average T2* was 55.14±8.87 ms in GM and 50.32±7.23 ms in WM. All values are summarized in Table 1. Figure 8 presents scatter plots and Bland–Altman plots for the mean T2 and T2* values from the whole population (Figure 8A-D) as well as for representative voxels of a single subject (Figure 8E-H).
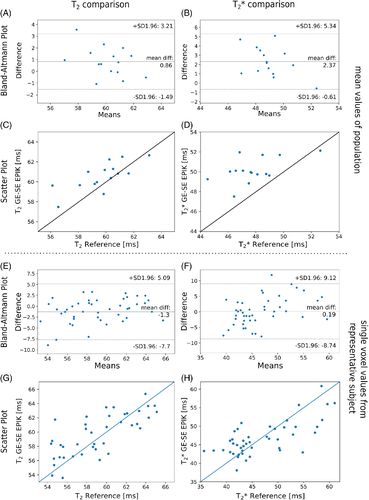
3.3 Oxygen extraction fraction
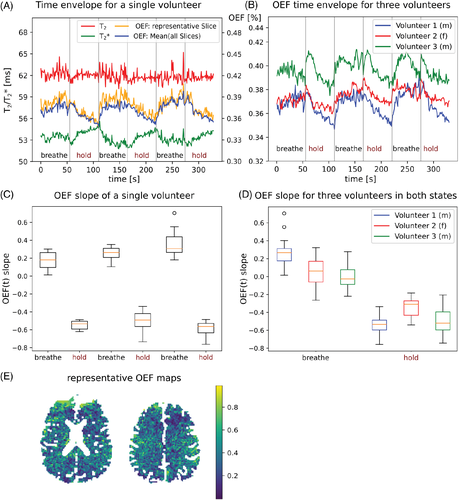
Oxygen extraction fraction values during a breath-hold experiment consisting of three breath-hold blocks are shown in Figure 9. The time envelope of mean OEF shows a decreasing OEF during breath-hold, followed by recovery during normal breathing. To quantify the OEF changes in the two different states, the slope was fitted by a linear function, where a significant difference between both states is observed (Figure 9C,D). The dynamic OEF time course is plotted together with the corresponding T2/T2* time courses in Figure 9A. OEF maps for two different slices are presented in Figure 9E; the mean OEF value for whole-brain data in the baseline state yields 0.37.
4 DISCUSSION
4.1 Relaxometry quantification
Having shown how the inclusion of 10 echoes benefits precision (Figure 4), the results depicted in Figures 5-7 demonstrate that GE-SE EPIK yields mean T2 and T2* values for phantom and in vivo data that are in good agreement with the respective reference methods. A successful spectroscopic validation of T2* and T2 for phantom data was observed. Moreover, in vivo T2* results agree with reported literature values at 3T, while the literature covers a broader range for T2 values, depending on the used method, with those from sSE methods27 matching the GE-SE EPIK values. Despite a longer TA, repeated single SE measurements were chosen as the reference method as literature results indicate that multi-SE acquisitions, especially CPMG schemes, trend towards an overestimation of T228 by up to a factor of 1.529 due to stimulated echo (STE) contributions. Moreover, it has been shown that in a biological system, the expected value of T2 depends on how it is measured, irrespective of STE contributions, with a well-characterized dependence on the inter-echo spacing. Thus, any comparison with a “gold standard” should aim to match this parameter as closely as possible. Internal consistency between GE-SE EPIK and reference methods was obtained from three phantom acquisitions and a study group of 15 volunteers. As expected, GM/WM segmentation was shown to yield the expected contrast, and the mean WM and GM values obtained from GE-SE EPIK agree well with the literature for T2*26 and T227, 30.
Nevertheless, for an accurate and robust quantification of simultaneous T2 and T2*, several sources of potential errors need to be considered:
A crucial parameter for a successful relaxometry quantification is the refocusing efficiency as a slice profile mismatch was found to effectively diminish the SE signal31 However, due to a good agreement between T2* and T2 values from GE-SE EPIK, reference methods and literature, the described effect is only expected to have a minor or negligible influence. Correction for the effects of B1+ inhomogeneities requires careful consideration. Although B1+ correction was not included here, preliminary results from two randomly selected subjects showed that B1+ inhomogeneities did not significantly influence relaxometry or OEF accuracy – with or without B1+ correction. That is to say, a difference of less than 0.2% between the mean T2/T2* values of both approaches was found. However, generally, the refocusing efficiency, as well as B1+ inhomogeneities, warrant careful consideration when designing experimental protocols in which comparability and reproducibility with measurements at different scanners or other sites are of importance.
Moreover, partial volume effects, which are more pronounced for larger voxel sizes, require consideration. Although our approach increases the spatial resolution compared to previous GE-SE sequences, thereby reducing partial volume effects, they are not totally eliminated.
Physiological motion may disrupt the steady-state signal, which in turn reduces the MR signal32. However, it is anticipated that the incorporation of motion detection and correction modules such as navigator methods33 or camera-based systems34 could potentially resolve such issues.
Diffusion effects could lead to a potential signal loss, while susceptibility inhomogeneities could also introduce static field inhomogeneities, which are both expected to be more prominent for in vivo data than in the solid phantoms. In addition, although our method assumes that the pure T2* and T2 signal decays mono-exponentially, intra-voxel inhomogeneities could lead to non-exponential FID decay in certain voxels35, causing T2* to be underestimated. For our sequence implementation, partial volume effects and larger dephasing due to the large voxel size were indeed expected, but no significant deviation from mono-exponential decay was observed.
4.2 OEF application
Based on the successful validation of T2 and T2* values from GE-SE EPIK, OEF values were computed and were found to be in agreement with reported literature values and showed good sensitivity to changes during breath-hold experiments. The following paragraph will outline the difficulties of OEF quantification regarding different available methods such as MR and PET.
OEF baseline results in the literature were reported as 0.3519 and 0.4136 for MRI methods, while two PET studies reported a mean OEF value of 0.36–0.3937 and 0.4438. The estimated values from our results are in good agreement.
The current gold standard for OEF quantification is O15-PET. While an assessment of the oxygenation information by non-invasive MR techniques is favorable, a direct comparison between both modalities needs careful consideration. An overview of general considerations for MR and PET-based OEF methods can be found in the Supporting Information Appendix S1.4.
The physiological dependencies of OEF results obtained by the approach based on Equation (3), especially the venous blood volume fraction, play an important role and need to be carefully chosen or even experimentally evaluated for individual measurements. In this study, λ was assumed to be constant over the whole breath-hold experiment. In future studies, a direct measure of λ would be beneficial to account for possible changes between the baseline state and breath-holding. Further limitations of the proposed method lie in the accuracy of R2'. First, it is known that R2* can be diminished by dephasing effects. However, here these were reduced by employing a higher-order shimming (third) prior to each acquisition. Second, partial volume effects lead to CSF inclusion, resulting in an overestimation of R2' and OEF. Furthermore, while a consistent and optimal choice of the FA, i.e., 90°, would have reduced the likelihood of unintended effects, quantification results from a phantom study show the choice of a reduced FA of 75° is not expected to influence the quantification performance. The underlying model from He et al.22 assumes a random vessel orientation which may be violated in voxels with large vessels. While the linear exponential decay in Equations (1) and (3) is an assumption of the long timescale defined by 1.5•tc22, it is noted that the signal contributions from extracellular space and intravascular blood relax quickly. The proposed sequence has an echo spacing of 10 and 20 ms around the SEs, which is in agreement with the critical limit of 1.5•tc = 9.4–12.5 ms calculated by assuming mean OEF values between 0.37–0.50 a priori.
Overall, it is evident that careful evaluation of the measurement parameters and study settings prior to using either MRI or O15-PET is necessary, as the resulting OEF quantification depends on several factors described above. While the advantages of MRI methods have made them more promising for OEF quantification39-41, only a few methods have been compared directly to PET results. The review from Fan et al.42 also underlines a residual bias between PET and MRI OEF, while the physiological state is expected to have a significant influence on absolute OEF values.
OEF is directly related to CMRO2 via Fick's principle (CMRO2 = Ca•CBF•OEF), where Ca can be assumed as the constant arterial oxygen content. Thus, the simultaneous quantification of OEF and CBF, as it is enabled by DSC methods with GE-SE acquisitions18, can provide an estimation of CMRO2. While absolute OEF maps in resting healthy subjects are largely uniform, CBF and CMRO2 have been observed to show regional variations43. Thus, the direct relation between OEF and CBF offers valuable information about brain metabolism. As the dynamic time course is sensitive to metabolic changes, e.g., decreasing arterial O2 during long breath-holds, the strength of the OEF slope during breath-hold and the following recovery during normal breathing may reflect the status of brain health and oxygen supply. Its interpretation will become more meaningful when CBV/CBF is directly measured in combination with OEF. The use of Equation (3) for OEF calculation assumes an arterial oxygen saturation (SO2) of 100%. However, although this holds true under normal conditions, in the scope of clinical evaluations, a direct measurement of SO2, e.g., with a pulse oximeter, is recommended to correct for any possible deviations. Details on the implications of SO2 on the presented OEF results are given in the Supporting Information Appendix S1.5.
Furthermore, the CBV quantification has been shown to yield higher values in PET measurements compared to MRI. An animal study44 compared CBV values from DSC-MRI with O15-CO2 PET, leading to 2.5 times higher PET values. Thus, MRI may provide different sensitivity to smaller vessels than PET. Moreover, arterial blood volume (CBVa) and blood flow (CBF) measured by arterial spin labeling MRI showed moderate correlation with values derived by O15-PET. MR-derived values were underestimated by 30% and 73%, respectively, in comparison to PET-derived values45.
Observing such bias between PET and MRI based OEF/CBV quantification highlights the need for a careful evaluation and interpretation. Future studies will assess both methodologies simultaneously using hybrid PET-MRI. This will reduce scan time and radiation dose while offering a direct comparison for acquisitions of the same physiological state. It is anticipated that the newer generation of hybrid MR-PET hardware will also shed further light on this issue. Moreover, an individual estimation of λ for each volunteer would improve the OEF accuracy and sensitivity.
So far, when comparing absolute OEF values between our method and reported MR and PET literature, good agreement has been observed, and, moreover, a good sensitivity of OEF values was observed for challenge-related changes during breath-hold experiments. The decreasing OEF during breath-hold is explained as the arterial CO2 increases while arterial O2 decreases. The increased blood flow during short breath-holds results in increased oxygen delivery to the brain and thus a decrease in OEF46.
4.3 Sequence implementation
The current GE-SE EPIK implementation can be adjusted to accommodate commonly used slice/time configurations for accurately tracking physiological changes (e.g., CBV/OEF). Previously published sequences that claim clinical applicability used a TR between 1 and 2 s with 10–15 slices, while five to seven echoes were acquired with matrix sizes between 64×64 and 96×96 (spatial resolution of 3.8/2.7 mm for a common FOV of 240 mm). Our 10-echo GE-SE EPIK sequence implementation can provide 11 slices with a temporal resolution of 1500 ms and a TA of 32 s for a resolution of 1.9×1.9×3 mm3. Thus, our method can achieve clinical relevance in terms of temporal resolution while providing improvements in the spatial resolution and the number of acquired echoes with reasonable low TEs (10/20/37/47/57/67/77/94/104/114 ms) compared to previous methods. Even the first two TEs, attributed to pure GEs, are shorter than most previous published sequences; although the SAGE sequence47 delivered shorter TEs (4.9/14 ms), this was achieved at the expense of halved matrix size (64×64) compared to GE-SE EPIK. Further SAGE publications2, 48 show a shorter first TE (8.3 ms), suffering from lower resolution (96×96 matrix), while the second TE was already larger than that for GE-SE EPIK.
Investigations of higher resolutions will be of interest. Matrix sizes of up to 192×192 are possible by maintaining the same keyhole coverage fraction and number of readout lines per shot of the current implementation to prevent a significant TE increase. However, a larger parallel imaging acceleration and partial Fourier incorporation will become necessary, although an increased readout bandwidth and SNR issues may compromise the image performance. Incorporating a multi-band feature will enable the acquisition of more slices in the same TA. A closer evaluation will be the focus of ongoing work in order to make a sequence available with a resolution of up to 1.25 mm.
5 CONCLUSIONS
This work introduces a novel 10-echo GE-SE EPIK sequence for the simultaneous quantification of T2 and T2*. The sequence can acquire 20 slices within a minute while also providing information from 10 acquired echoes. The sequence overcomes limitations in resolution and number of echoes with reasonably TEs as reported in previously published sequences based on simultaneous GE and SE acquisition and, importantly, includes a second SE. A matrix size of 128×128 was implemented while maintaining a reasonably low TE for all echoes at 3T. T2 and T2* quantification was validated on phantom and in vivo data by comparison with reference methods, showing good internal consistency. In addition, the T2 and T2* quantification methods agreed well with spectroscopy measurements for three carrageenan phantoms. GM and WM T2 and T2* values match the literature well, and the consistency of the approach was demonstrated in a study on 15 healthy volunteers. OEF computation was performed and showed good sensitivity to challenge related changes between normal breathing and breath-holding in three volunteers.
Having established the benefits of the sequence, our focus is now on its usability in a clinical context as well as on future work to further improve the sequence in terms of resolution and speed. Following further development, the sequence is also expected to be well-suited for use in brain tumor patients, enabling the identification and characterization of tumor heterogeneity within a minute.
ACKNOWLEDGEMENTS
We thank our colleagues, the MTAs and the organizational team of the INM-4. Special thanks are given to Dennis Thomas and Michael Schöneck for help with the phantom production and Claire Rick for English proofreading.
Open Research
DATA AVAILABILITY STATEMENT
The original in vivo data can be shared by submitting a request to the corresponding author (N. Jon Shah: [email protected] ) under a formal data-sharing agreement. The sharing is based on the consent of the subject whose data are to be shared; these subjects will be informed beforehand.


