Cardio-respiratory motion-corrected 3D cardiac water-fat MRI using model-based image reconstruction
Click here for author-reader discussions
Abstract
Purpose
Myocardial fat infiltrations are associated with a range of cardiomyopathies. The purpose of this study was to perform cardio-respiratory motion-correction for model-based water-fat separation to image fatty infiltrations of the heart in a free-breathing, non-cardiac-triggered high-resolution 3D MRI acquisition.
Methods
Data were acquired in nine patients using a free-breathing, non-cardiac-triggered high-resolution 3D Dixon gradient-echo sequence and radial phase encoding trajectory. Motion correction was combined with a model-based water-fat reconstruction approach. Respiratory and cardiac motion models were estimated using a dual-mode registration algorithm incorporating both motion-resolved water and fat information. Qualitative comparisons of fat structures were made between 2D clinical routine reference scans and reformatted 3D motion-corrected images. To evaluate the effect of motion correction the local sharpness of epicardial fat structures was analyzed for motion-averaged and motion-corrected fat images.
Results
The reformatted 3D motion-corrected reconstructions yielded qualitatively comparable fat structures and fat structure sharpness in the heart as the standard 2D breath-hold. Respiratory motion correction improved the local sharpness on average by 32% ± 24% with maximum improvements of 81% and cardiac motion correction increased the sharpness further by another 15% ± 11% with maximum increases of 31%. One patient showed a fat infiltration in the myocardium and cardio-respiratory motion correction was able to improve its visualization in 3D.
Conclusion
The 3D water-fat separated cardiac images were acquired during free-breathing and in a clinically feasible and predictable scan time. Compared to a motion-averaged reconstruction an increase in sharpness of fat structures by 51% ± 27% using the presented motion correction approach was observed for nine patients.
1 INTRODUCTION
Adipose tissue can infiltrate the myocardium, which is associated with a range of ischemic and non-ischemic cardiomyopathies.1 These include chronic myocardial infarction (MI), muscular dystrophy (MD), dilated cardiomyopathy (DCM), or arrhythmogenic right ventricular cardiomyopathies (ARVC).2-6 It was reported that fatty metaplasia in MI and MD is possibly related to arrhythmia and could influence the prognosis of DCM.7-9 Cardiac MRI can non-invasively characterize chemical tissue components in the heart.10 Fat can be visualized by suppressing the water signal (spectral suppression). The difference in resonance frequencies (chemical shift) between the water and fat signal also allows their separation using acquisitions at different echo times (Dixon imaging).10 In cardiac applications, fat is usually suppressed using spectral fat suppression methods; however, multi-echo water-fat separation techniques have several advantages. Imaging fat with a positive contrast mitigates any errors due to incomplete suppression experienced with spectral methods.11, 12 Also, acquiring multiple echoes allows accounting for B0 field inhomogeneities in the reconstruction.13, 14 Separation techniques are also able to resolve ambiguities in late gadolinium enhancement (LGE) imaging: fatty infiltrations can be mistaken as fibrotic tissue in T1-weighted sequences because both have a low post-contrast T1 value.12 Furthermore, chemical shift artifact induced misregistrations between water and fat can be suppressed in multi-point water-fat imaging.15, 16
For water-fat separation, images are typically reconstructed at different echo times and then separated into water and fat images. Model-based water-fat reconstruction on the other hand obtains water and fat maps directly from the acquired multi-echo k-space data. This has the advantage that the regularization can be applied to the water and fat images directly rather than on the intermediate individual-echo images. This ensures that the obtained fat and water images are consistent with the obtained k-space data. This model-based approach has been combined with compressed sensing regularization17 and with XD-GRASP for motion-resolved imaging applications in the abdomen.18, 19
In clinical routine water-fat imaging is performed by acquiring multiple 2D slices with a high in-plane resolution but a large slice thickness of 4–8 mm. One or multiple breath-holds are typically required to cover the heart leading to misalignment of the slices and posing a challenge to the patient. Imaging is routinely performed as cine,20 resolving the cardiac motion or is electrocardiograph (ECG) triggered to mid-diastole to mitigate motion artifacts caused by the heartbeat.
Fat infiltration in the heart can be very small and irregularly distributed in the myocardium. Therefore, it can be poorly resolved or even missed with multi-slice 2D imaging. High-resolution 3D water-fat imaging has been proposed to alleviate this problem,21 but the main challenges remain the long scan time and respiration- and heartbeat-induced motion artifacts. These can be reduced using gating and triggering, respectively.4, 22-25 Respiratory motion-corrected image reconstruction (MCIR)26 has been proposed for water-fat imaging,27, 28 but cardiac triggering still reduces scan efficiency and can lead to scan times that are longer than clinically feasible.
The purpose of this study was to perform cardio-respiratory motion-correction for model-based water-fat separation to image fatty infiltrations of the heart in a free-breathing, non-cardiac-triggered high-resolution 3D MRI acquisition. The data acquisition is performed after the injection of a bolus of contrast agent with a non-triggered and free-breathing gradient-echo Dixon sequence which covers the whole heart using a radial phase encoding (RPE) trajectory.29 Images are reconstructed with a regularized model-based water-fat framework. Respiratory and cardiac motion is estimated from the data based on synergistic non-rigid registration using both water and fat images. While other methods rely on the final reconstruction on resolving the motion19, 30-32 this work aims to correct for it. To resolve the motion only a fraction of the data are used for each frame and strong regularization is required to ensure that undersampling artifacts are suppressed. In this work, the computed patient-specific motion models are combined with all acquired data and incorporated into the encoding model to reconstruct a single cardio-respiratory motion state to minimize motion artifacts and improve the accuracy of fat visualization.
The model-based reconstruction is validated on data acquired from nine patients using clinical 2D images as a reference. The effect of cardio-respiratory motion correction (MoCo) on adipose cardiac tissue is assessed with a local edge sharpness metric applied to the reconstructed fat images.
2 METHODS
In the following, two developments are described: first, to perform MCIR the incorporation of motion models into a model-based water-fat reconstruction framework is presented. Secondly, to extract the motion models required for MCIR, the application of a synergistic registration algorithm to water-fat separated and motion-resolved images is described.
2.1 Overview image reconstruction workflow
A schematic overview of the reconstruction workflow used is given in Figure 1. Several image reconstruction and motion estimation steps are performed where each of the steps incorporates information obtained in the previous ones.
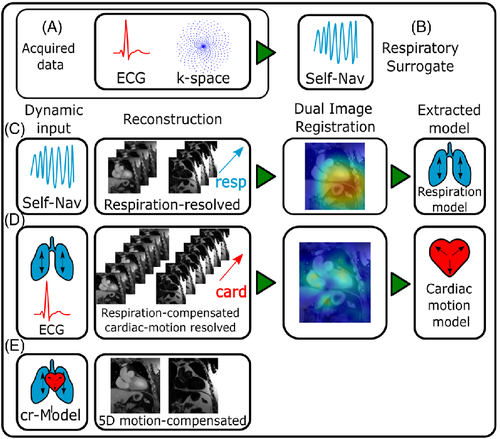
The surrogate signals necessary for relating the data to the individual motion states are available in the form of an ECG for cardiac motion (Figure 1A) or a self-navigator, which is extracted from the acquired k-space data for respiration (Figure 1B). Data are either binned based on the cardiac phase or respiratory amplitude.
The respiratory self-navigator was obtained from the data itself. The readouts at the phase encoding point ky = kz = 0 are extracted and Fourier transformed along the readout yielding a time-resolved projection of the 3D image volume onto the foot-head axis. The temporal resolution of this navigator depends on the time intervals in which the phase encoding point ky = kz = 0 is sampled, which in this work yielded a resolution of 48*TR = 394 ms.
From these data, the respiratory surrogate signal is extracted using principal component analysis (PCA) over the readout- and receiver channel dimension where the component with the largest singular value was selected as the respiratory signal. Subsequently, it was interpolated to the resolution of TR using a spline interpolation.
Coil sensitivity profiles were estimated from the acquired data33 and no coil calibration scan was required.
For the estimation and correction of motion, a two-step strategy is applied. Both respiratory and cardiac motion-resolved images are reconstructed, and the 4D motion is estimated for both motion modes individually. First, the data are reconstructed resolving the respiratory motion, followed by a registration step extracting a respiratory motion model (Figure 1C). Subsequently, this respiration model is included in the reconstruction of cardiac-resolved images, followed again by registration to model the cardiac motion (Figure 1D). The images underlying the cardiac motion estimation are, however, already corrected for respiratory motion. Cardio-respiratory motion is then generated by combining the two individual motion modes by concatenation of cardiac and respiratory motion to yield both cardiac and respiratory motion-corrected and water-fat separated images (Figure 1E). Details on the individual steps are described in the following.
All reconstructions were performed using a custom implementation in MATLAB (The Mathworks, Natick, MA) and Python.34
2.2 Motion-resolved model-based water-fat separated image reconstruction
A reconstruction using this approach and cost function and data acquisition with a stack-of-stars trajectory has previously been proposed as XD-GRASP.18, 19, 30 In this work, however, the sampling of non-cartesian data points is not performed in the readout direction but the phase-encoding direction instead.
The field off-resonance map used in the forward model was computed using the three individual echoes using a dedicated region-growing algorithm14 before the reconstruction and kept constant concerning the optimization afterward.
2.3 Motion-corrected model-based water-fat separated Image reconstruction
2.4 Synergistic registration
2.5 Combination of cardiac and respiratory motion correction
To perform simultaneous cardiac and respiratory motion correction, the data are double binned such that the motion index is comprised of a respiratory and cardiac motion state: . As the motion transformation is not estimated on double-binned reconstructed images, but the cardiac motion is only estimated in end-exhale to apply both motion models at the same time, the cardiac motion model must be transformed from the end-exhale motion state into the other respiratory motion states by concatenation of respiratory and cardiac motion transform: .
This ensures that the correction of the heartbeat is moved to the individual respiratory motion states. This combination of motion modes is possible if the respiratory motion is an affine transformation in the regions where the heartbeat is corrected. This can be assumed to be true for the central region of the thorax where the heart executes a respiratory-induced combination of translation and rotation.
2.6 Parameters in image reconstruction workflow
In a first step, the respiratory self-navigator is extracted and used to bin the data into Nresp = 6 respiratory motion states based on respiratory amplitude with a 10% overlap between adjacent bins. This yielded an undersampling factor of three for respiratory reconstruction. Binning for respiration (as well as cardiac motion later) was performed by adaptively choosing the bin width, such that all bins contain the same amount of data points to ensure a similar undersampling artifact level upon reconstruction. The binned data are reconstructed into water and fat content using a TV and TVT regularization strength of and . The resulting image series are subsequently registered using the dual water-fat registration defined in Equation (2) with (w, ΔB, ) = (0.7, 8, 0) yielding motion fields that describe the respiratory motion model. In a second step, the data are binned into Ncard = 12 cardiac motion states based on cardiac phase using the ECG signal. For cardiac binning, a 0% overlap between adjacent bins was used. This yielded an undersampling factor of 6 for the cardiac reconstruction. The resulting data are reconstructed into water and fat modes using a regularization strength of =0.025 and =0.05 while simultaneously applying the previously generated respiration model for respiratory MoCo. The resulting image series resolves the heartbeat motion, and each image itself is already free of artifacts caused by respiration. The image registration with (w, ΔB, ) = (0.5, 2, 2*10−3) was applied to determine the cardiac motion fields. Eventually, both motion models were combined into a cardio-respiratory motion model and applied to reconstruct a single, motion-free fat and water separated image. Finally, three reconstructions were compared: the motion-averaged (AVG), respiratory-corrected, cardiac-averaged (r-MCIR), and the cardio-respiratory corrected (cr-MCIR). Each was reconstructed with =0.015 (as there is only one reconstructed, motion-corrected image TVT regularization cannot be performed, i.e.
2.7 Trajectory
Sampling k-space using a radial phase encoding (RPE) trajectory has been proposed before and used in several cardiac imaging applications.29, 39, 40 An RPE trajectory performs parallel, cartesian readouts that are arranged in a non-cartesian pattern in the phase-encoding plane of k-space.
For this work, a novel trajectory was implemented, which aims to generate a phase encoding sampling scheme more suitable for compressed sensing applications. It should have a uniform and random distribution after the data are binned into cardiac or respiratory motion states, but at the same time provide ideal coverage of the phase encoding plane when all sampled data points are used in an MCIR. Since the readouts are parallel and cartesian samples the subsequent analysis considers phase encoding points only.
We present a phase encoding sampling strategy for RPE that decouples radial and angular undersampling for the arrangement of the phase encoding points. The resulting trajectory is shown in Figure 2.
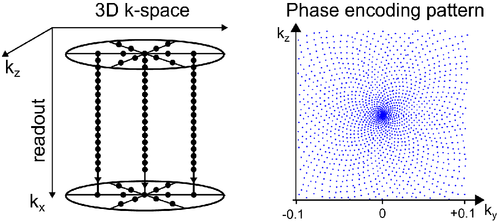
Where is the golden ratio and mod the modulo operator on floating-point numbers. This angle-dependent shift applies the principle of golden-ratio increments previously used in the angular direction for radial-readout41 or RPE sampling39 to the radial direction. Hence, the points are arranged on infinitely interleaved circles where no two points have the same distance to the center of the phase encoding plane. However, as the readout in the center point of the ky-kz-plane, which is required for robust motion binning and self-navigation, is shifted away from its position at ky = kz = 0, the readout of the first radial point of each angle (nr = -Nr/2) is used to acquire ky = kz = 0. This yields a pattern in the phase encoding plane of the arrangement of sunflower seeds. This pattern was previously generated with a spiral readout.42
During the acquisition, this decouples the notion of the radial FOV from the radial sampling distance an undersampling of the radial direction by a factor of Fr can be compensated by an angular oversampling by a factor of , i.e., while . The gaps in the radial direction are automatically filled by the additional angles, leaving the sampling pattern invariant. The temporal order of the sampling and the generation of the pattern are shown in Supporting Information Videos S1–S3, which are available online, for an example trajectory of Nr = 64, and .
This particular pattern is only generated using a radial shift as above for linear angle increments . However, in this work, a golden-angle increment was used: . Assuming a homogenous angular distribution after sampling all angles with the same pattern can be generated by reordering the shift according to , where is the permutation that sorts the sampled angles into a linearly increasing order and accounts for the direction of the shift.
2.8 Data acquisition
Nine patients were scanned on a 1.5T Siemens Avanto using a 32-channel cardiac phased coil array. Patients included in the study were suffering from myocarditis or muscular dystrophy. The study was conducted in accordance with the Declaration of Helsinki, each patient provided informed written consent.
Data were acquired with a 3D three-echo Dixon (TR = 8.,2 ms, TE = 2.90 ms, 4.48 ms, 6.06 ms, α = 15°, acquisition time [TA] = 13:26 min) FLASH sequence. The reconstructed FOV in each direction was 288 mm at a 1.5 mm isotropic resolution, covering the entire thorax. Fourier encoding was performed with the readout ( along the head-foot direction and for the directions using the sunflower trajectory as described above The radial direction was undersampled by Fr = 4 and a total of 2048 different phase encoding angles were sampled.
Data acquisition was carried out during free breathing without cardiac triggering. Patients' ECG signals were recorded. Each patient was given a T1 contrast agent for clinical reasons before the data acquisition (0.2 mmol/kg ProHance, except for patient 9, 0.15 mmol/kg Regadenoson).
Water-fat separated images were acquired in two-, three-, and four-chamber views using a standard ECG-triggered 2D Cartesian acquisition scheme in three patients. The proposed 3D acquisition was then reformatted to these orientations and compared.
Additional, a qualitative assessment was performed regarding a retrospectively gated reconstruction. To this end, data from the three cardiac motion frames with the largest motion and the end-inhale phase were excluded and the resulting reconstructions were compared qualitatively to using all acquired data.
2.9 Computation of local image sharpness
To assess the effect of motion correction on the image quality, the sharpness of small structures in the fat images was evaluated.43-46 An example for one patient in one view is depicted in Supporting Information Figure S1. To this end, the fat images were reformatted to two- and four-chamber view and a Canny edge detection algorithm was applied to the reformatted fat images to generate the local magnitude of the image edges. Two fat structures from each view were marked with a curve of length l. Both the edge magnitude and the image magnitude were subsequently extracted along this curve in a 10-pixel corridor, yielding a patch of size l x 10 whose central line is the marked curve. The extracted patches for both image and edge values were averaged along the direction of the curve and the maximum was computed over the width of the patch, yielding the values (img) and (edg) for the image and edge information respectively. Finally, the edge sharpness was defined as This sharpness score was evaluated for four different locations each yielding the score , two locations in two-chamber and two- in four-chamber view. Exemplary locations for one patient are depicted in Figure 8. For each patient, the sharpness score was the average sharpness over all four locations.
Additionally, a comparison of the image sharpness between the 2D ECG-triggered reference images and reformatted 3D AVG and cr-MCIR reconstructions was performed for the patients in which the reference was available(patients 1, 2, and 3).
3 RESULTS
3.1 Qualitative evaluation of water-fat reconstructions
Motion-resolved reconstructions for two patients are displayed in Figure 3. For both patients, water and fat images in end-exhale, end-inhale, diastole and systole are displayed. One patient is shown in sagittal and one in coronal view to highlight the 3D isotropic resolution of the acquired data.
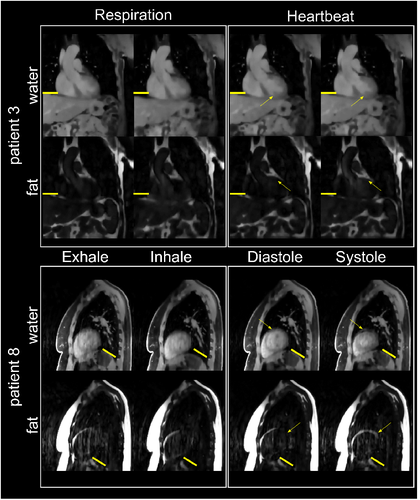
For both patients, changes in the anatomy due to respiratory motion are visible in water and fat reconstructions. In the cardiac-resolved images, the respiration has been corrected as indicated by the position of the liver and diaphragm. For patient 8, the contraction of the heart from the diastolic to systolic phase is visible both in water and fat images.
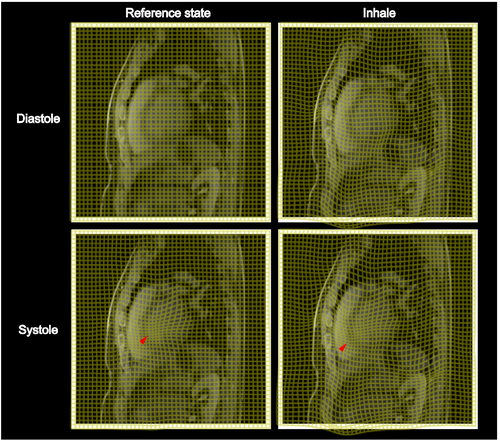
In Figure 4, the effect of the estimated motion fields for example patient is shown as coordinate transformations from exhale to inhale for respiration and diastole to systole for cardiac motion. The motion transformations do not show non-physical properties such as overlapping coordinate lines and are well-regularized. The successful transport of the cardiac motion along the path defined by the respiratory motion can be seen in the combined cardio-respiratory motion field.
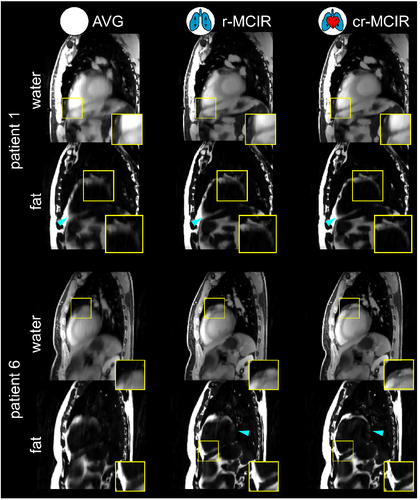
Motion-corrected images for two patients are shown in Figure 5. Both fat and water images are shown for AVG, r-MCIR, and cr-MCIR from left to right. Regions, where improvements in the fat structure are visible, are depicted in a separately zoomed-in square. Cyan arrows indicate additional locations where motion-blurring in the epicardial fat structures is visibly reduced by the application of the proposed motion-corrected image reconstruction. Patient 1 shows a reduction of motion blurring after the application of the respiratory model, especially in the abdominal region. Motion blurring due to the heartbeat can be further reduced by an additional application of the cardiac motion model in both epicardial fat structures as well as for the coronary vessel. Patient 6 shows very strong blurring in the motion-averaged case, of which the abdominal fat and the structure at the apex could be improved with respiratory MoCo. Cardiac MoCo could further improve the basal fat structure. A similar improvement can be also seen in the complimentary water image where the coronary arteries become visible using cr-MCIR. In addition to a reduction in blurring also respiratory motion artifacts in the ventricle are reduced with MoCo.
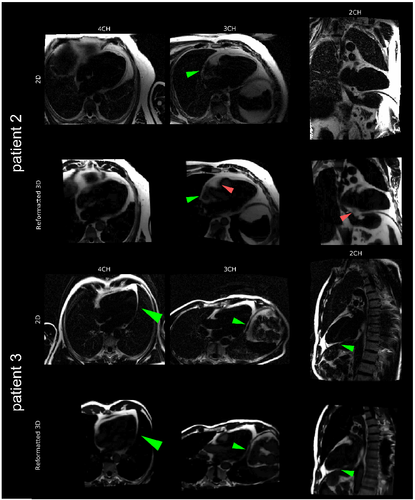
A comparison between 2D clinical acquisitions in two-, three-, and four-chamber view and 3D fat cr-MCIR reconstructions reformatted to the same views are displayed for two patients in Figure 6. The depiction of fat structures acquired is comparable between both scans. Nevertheless, it is important to note that the 2D data were acquired during a breath-hold using cardiac triggering and hence might show a different motion state than cr-MCIR.
Supporting Information Figure S3 shows the effect of retrospective motion gating in one example patient. It can be seen that the exclusion of data with large motion amplitudes increases the visibility of fine structures for AVG and r-MCIR reconstruction, however, not for cr-MCIR. This, however, is accompanied by a loss in overall image quality as fewer data were available for the reconstruction. Different levels in undersampling artifacts between AVG gated and (c)r-MCIR images are likely to occur since the reconstructed k-space is not oversampled after gating and motion-correction can potentially increase undersampling artifacts.26 Furthermore, a comparison between AVG, AVG-gated and cr-MCIR in two-chamber view is depicted for three patients in Supporting Information Figure S4. While for one patient gating was very effective in removing most of the motion-artifacts, the patients showed residual motion artifacts in the AVG gated reconstructions. In contrast, motion correction was able to remove more motion-artifacts in all three patients than gating.
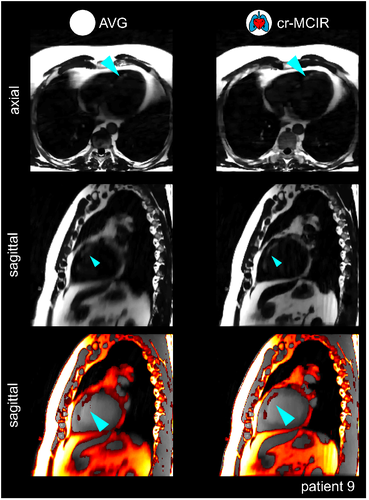
A patient with fat-infiltration in the septum is displayed in Figure 7. The reconstructed fat images are displayed in axial and sagittal views for both AVG and cr-MCIR. It can be observed that MoCo led to an improved depiction of the fat in the sagittal view. The sagittal slice shows the fine structure of the fat infiltration strongly blurred for the AVG reconstruction. In addition, many motion-artifacts make it difficult to identify these small structures. The proposed cr-MCIR reduced motion artifacts and blurring and strongly improved the visibility of the fat infiltration. This can also be seen in a water-fat overlay of the sagittal slice.
3.2 Quantitative evaluation of image sharpness
A quantitative assessment of the fat structure sharpness is displayed in Figure 8. On the left, the locations where the sharpness is evaluated are shown for patient 4 on cr-MCIR fat images. On the right, the values of are displayed for AVG, r-MCIR, and cr-MCIR. The distributions show an increase in sharpness for the inclusion of each motion type. The increase in sharpness due to cardiac motion correction is smaller compared to respiratory motion correction.
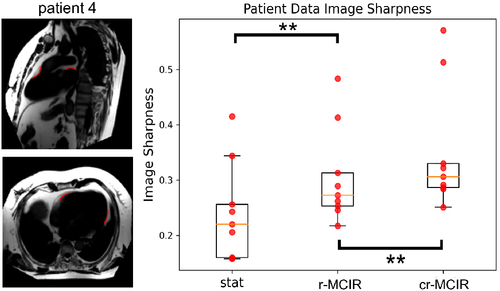
A comprehensive overview of the measured values is given in Table 1. The effect of r-MCIR leads to an increase in fat structure for every patient, with improvements ranging between 1% and 81% with 32% ± 24% on average. The effect of additional cardiac MoCo is highly patient-specific. For some patients, it can further improve by 31% for other patients it does not lead to any further improvement. On average cardiac MoCo increase by 15% ± 11%.
| Patient alias | Stat | Resp | Dual | ΔResp (%) | ΔCard (%) | ΔDual (%) |
|---|---|---|---|---|---|---|
| 1 | 0.22 | 0.25 | 0.33 | 15 | 30 | 50 |
| 2 | 0.16 | 0.26 | 0.29 | 65 | 9 | 81 |
| 3 | 0.16 | 0.22 | 0.28 | 38 | 31 | 80 |
| 4 | 0.26 | 0.31 | 0.32 | 22 | 3 | 26 |
| 5 | 0.24 | 0.25 | 0.25 | 1 | 2 | 3 |
| 6 | 0.34 | 0.41 | 0.51 | 20 | 24 | 49 |
| 7 | 0.21 | 0.27 | 0.29 | 32 | 7 | 42 |
| 8 | 0.42 | 0.48 | 0.57 | 16 | 18 | 37 |
| 9 | 0.16 | 0.29 | 0.31 | 81 | 6 | 92 |
| Mean | 0.24 (8) | 0.31 (8) | 0.35 (11) | 32 (24)* | 15 (11)* | 51 (27)* |
- Note: ΔResp is the increase of ∑ for resp MCIR relative to Stat, ΔCard is the increase of ∑ for dual MCIR relative to Resp, ΔDual is the increase of ∑ for dual MCIR relative to Stat.
- *p < 0.01.
The result of the statistical tests between AVG and r-MCIR of as well as cr-MCIR led to p-values prMCIR=0.008 and pcrMCIR = 0.008, also between r-MCIR and cr-MCIR the p-value was pcard = 0.008. This suggests that correcting for both the respiratory and the cardiac motion yields a significant improvement in the fat structure of the overall heart.
The quantitative comparison is presented in Supporting Information Figure S2. In this patient subset, the sharpness increases between AVG and cr-MCIR reconstructions on average by 38%, and the reference data shows an increased sharpness by 19% compared to the cr-MCIR reconstruction.
The effect of gating on the sharpness metric was assessed by comparing the sharpness metric of AVG, AVG-gated, and cr-MCIR. While gating increased the sharpness metric mean by 16% from AVG to AVG-gated, it was increased further by 25% in cr-MCIR (Supporting Information Figure S5).
4 DISCUSSION
In this work, we presented a model-based water-fat reconstruction with cardiac and respiratory motion correction.
With the presented reconstruction framework compressed sensing regularization could be successfully applied for motion-corrected image reconstruction of fat and water images. In Figure 3 two example reconstructions were presented that showed the motion-resolved reconstruction of Nresp = 6 and Ncard = 12 motion states. The TV and TVT regularization were able to suppress artifacts while at the same time preserving motion amplitudes.
The motion resolved images could then be used to estimate and subsequently correct for respiratory and cardiac motion. The image quality of both water and fat images was improved by reducing motion artifacts and blurring. This could be seen in both an improved delineation of epicardial fat structures, as well an improved depiction of coronary vessels and their surrounding fat structures.
While the scan time in this study with 13:26 min was still long, it was predictable and the same for every patient. The 2048 sampled phase encoding angles yielded a net phase encoding oversampling of 67%. The oversampling was deemed necessary to ensure sufficient image quality.
A reduction to 0% oversampling could reduce the acquisition time to 8 min, which could be achieved by appropriate changes to the regularization parameters in the reconstruction. A retrospective undersampling analysis could not be performed. As the ideal temporal ordering of the sampled trajectory is computed based on the number of sampled angles retrospective discarding around 70% of the sampled point leaves large gaps in k-space. Analysis of the reconstructions at a reduced scan time would require new acquisitions. In this study, we used a three-echo Dixon acquisition to ensure a field inhomogeneity map without the appearance of water-fat swaps.14 Scan time could be further reduced when using a two-point method.28
The data for this study were acquired after the injection of a T1 contrast agent resulting in a good contrast between myocardium and blood which is beneficial for the estimation of cardiac motion. Yet, due to the positive contrast of fat and the use of both water and fat information in the motion estimation the cardiac motion of the fat could also potentially be accurately measured without a contrast agent, which would require further studies.
Quantitatively the improvements of cardiac fat structures were analyzed by computing a local edge sharpness metric for epicardial fat structures. The data showed a large improvement of 32% ± 24% of the selected epicardial fat structures when including a respiratory motion model in the reconstruction process. Cardiac motion modeling further increased by an additional 15% ± 11%. Statistical tests showed that both respiratory and cardiac (p < 0.01) MoCo led to a statistically significant increase in sharpness . The increase in is highly patient dependent, especially for cardiac motion (Figure 8 and Table 1). This effect is expected as cardiac motion is much more patient-specific than respiratory motion. The impact of cardiac motion modeling depends on how long the systolic phase is relative to the whole cardiac cycle and how strongly the heart contracts during systole.
Residual motion artifacts could be observed for the reformatted 2D cr-MCIR reconstructions. A quantitative comparison with ECG-triggered 2D images acquired during breath-hold (2D BH) in three patients showed a higher sharpness by 19% for the 2D BH in this patient subset. However, this comparison is challenging as the respiratory motion state can differ between the reformatted 3D and the 2D reconstructions. Detailed quantification of residual motion artifacts would require more datasets with available 2D BH. The residual artifacts can be due to residual intra-bin blurring or an inaccurately estimated motion model. As no ground-truth motion is available the accuracy of the estimated motion models cannot be computed. To assess whether the motion models with the largest motion amplitudes are inaccurate and impairing the reconstructions, retrospective motion gating was applied to the AVG, r-MCIR and cr-MCIR reconstructions, leaving out the motion with the largest amplitudes (systole, and end-inhale). A qualitative comparison between gated and un-gated reconstructions for one patient is displayed in Supporting Information Figure S3. Gating reduces motion blurring of the AVG and r-MCIR reconstruction, however, not for the cr-MCIR. This suggests that the motion models can accurately describe also the motion with large amplitudes in systole and end-inhale. This is also supported by Supporting Information Figure S4 where the comparison between AVG, AVG-gated and cr-MCIR for three patients shows that the level of remaining motion-artifacts after gating is very patient-dependent while the patient-specific motion models can correct for motion artifacts present in the data. Also, the data presented in Supporting Information Figure S5 show that while gating of the extreme motion states does improve the image sharpness metric on average by 16% from AVG to AVG-gated, the application of cr-MCIR can further increase the average sharpness metric by 25% from AVG-gated to cr-MCIR reconstructions.
The presented motion-correction approach only considers spatially smooth transformations on the scale of the spline distance ΔB, which is further increased depending on the regularization weight ρ in Equation (2). The spline distance was ΔB = 2 voxel for cardiac and ΔB = 8 for respiration. Motion below this scale is smoothed out, and discontinuous motion elements could be wrongly displaced by the motion model.
Cardiac motion is more challenging to estimate than respiratory motion. While respiration is similar for most patients and occurs mainly in the head-foot direction, the heartbeat leads to much more complex motion patterns which are more difficult to distinguish from any residual image artifacts. Finding a single set of patient-independent parameters for the registrations yielding high-quality registrations is very challenging and could reduce the accuracy of the motion models. Adapting the registration to be more patient-specific could be supported by machine learning.47, 48 Further temporal regularization could be used during the registration to improve the accuracy of motion estimation.49-51 Also, machine-learning approaches could further improve the estimated motion quality.52
Also, residual flow artifacts can be seen e.g. in the aorta which cannot be compensated for using MCIR. They are also present after the exclusion of systolic phases in the reconstructions (see Supporting Information Figure S6).
The two-step approach of combining two 4D motion modes into a cardio-respiratory motion model relied on the assumption the transport of the cardiac motion fields into different respiratory states leaves the motion fields invariant. This is equivalent to the respiratory motion being affine in the region of the cardiac motion. As the respiratory motion of the heart is a combination of rotations and translations this is fulfilled. At the lung-ribcage interface, for example, this assumption would fail, however, at these positions the motion due to the heartbeat vanishes and no erroneous correction occurs.
Figure 7 shows the improvement in image quality and visualization of fat structures infiltrating the myocardial tissue. The displayed patient's fat image was strongly deteriorated by motion blurring and other motion artifacts and showed the largest improvement in fat structure sharpness for all patients using respiratory MoCo. In axial view both in AVG and cr-MCIR, the structure was visible; however, only after MoCo, the structure could be identified as a coherent infiltration permeating a large part of the cardiac tissue.
While work was aimed at imaging fine adipose structures in the heart, the motion-corrected reconstructions presented here could be also used to compute pixel-wise fat fraction maps, as well as the fat volume surrounding the heart.53
5 CONCLUSIONS
In this work, a cardio-respiratory motion-corrected and model-based water-fat separated image reconstruction framework were presented. The 3D high-resolution water-fat separated images could be acquired during free-breathing and in a clinically feasible and predictable scan time. The effectiveness of the motion-correction approach could be shown for nine patients.
ACKNOWLEDGMENTS
The authors acknowledge funding from the German Research Society (GRK 2260, BIOQIC).
CONFLICT OF INTEREST
None.


