Luteolin Protects Against Obese Sarcopenia in Mice with High-Fat Diet-Induced Obesity by Ameliorating Inflammation and Protein Degradation in Muscles
Abstract
Scope
Although sarcopenia is mainly caused by aging, sarcopenia due to obesity has become an emerging issue given the increase in obesity among people of various ages. There are studies on obesity or sarcopenia, our understanding of obesity-mediated sarcopenia is insufficient. Luteolin (LU) has exhibited antiobesity effects, but no studies have investigated the LU effects on antisarcopenia. This study therefore investigated the effects of LU on obese sarcopenia in mice with high-fat diet (HFD)-induced obesity.
Methods and results
To evaluate its inhibitory efficacy against obese sarcopenia, 5-week-old mice are fed an HFD supplemented with LU for 20 weeks. LU exerts suppressive effects on obesity, inflammation, and protein degradation in the HFD-fed obese mice. It also inhibits lipid infiltration into the muscle and decreases p38 activity and the mRNA expression of inflammatory factors, including TNF-α, Tlr2, Tlr4, MCP1, and MMP2, in the muscle. The suppression of muscle inflammation by LU leads to the inhibition of myostatin, FoxO, atrogin, and MuRF expression. These effects of LU affect inhibition of protein degradation and improvement of muscle function.
Conclusion
Here, it demonstrates that LU's antiobesity and antiinflammatory functionality affect inhibition of muscle protein degradation, and consequently, these interactions by LU exerts a protective effect against obese sarcopenia.
1 Introduction
Skeletal muscle is the most abundant tissue in vertebrates. In humans, skeletal muscles comprise ≈40% of the total body weight. Their primary role is to maintain skeletal structure and movement so that humans can perform essential daily activities.[1] Skeletal muscles also perform metabolic functions, including basal energy formation, thermogenesis, and oxygen consumption.[2] Muscle mass depends on the balance between protein synthesis and degradation and is sensitive to various pathologies, including cancer, heart disease, obesity, and aging.[3] Muscle mass loss resulting from disrupted homeostasis weakens the musculoskeletal system, interferes with daily movement, and results in functional limitations of the muscles.[4] Sarcopenia refers to the loss of skeletal muscle mass and function, which increases the risk of lack of mobility, disability, and mortality.[4] Over the next 30 years, regardless of diagnostic criteria, the prevalence of sarcopenia is expected to increase considerably and become a major public health problem.[5]
Although sarcopenia has previously been thought to occur naturally due to aging, recent studies have indicated that obesity and obesity-mediated factors may accelerate the pathogenesis of and exacerbate sarcopenia.[6] Obesity refers to an increase in the number and size of adipocytes, where proinflammatory macrophages and other immune cells accumulate and the production of various adipokines, cytokines, and chemokines is abnormally regulated.[7] Inflammatory responses caused by obesity are the main causes of metabolic syndromes, including diabetes, cardiovascular diseases, hypertension, and dyslipidemia.[8] Additionally, obesity increases the amount of ectopic lipid storage in skeletal muscles.[9] Excessive accumulation of intramuscular lipids and inflammation enhance the secretion of proinflammatory myokines, a phenomenon that further leads to muscle dysfunction by inducing β-oxidation and mitochondrial dysfunction.[9] These myokines mediate the development of obesity induced sarcopenia.[10] The term “obese sarcopenia” was coined to define the obesity-mediated pathological pathway.[6] Old age- and obesity-induced sarcopenia have both become significant issues as the obese population is increasing worldwide, regardless of age.
The biological function of dietary flavonoids has garnered much attention recently. Various pharmacological activities have been attributed to flavones, which comprise a class of flavonoids. Luteolin (LU), a representative flavone, is mainly present in vegetables, fruits, and medicinal plants, including parsley, peppermint, and celery seeds.[11] LU has exhibited antioxidant, antiinflammatory, antiallergy, antidiabetic, and antiobesity effects in various in vitro and in vivo models.[12, 13] However, among the numerous reports demonstrating the efficacy of LU treatment, few studies have investigated sarcopenia and/or obesity-mediated sarcopenia.
We previously showed that LU attenuates metabolic syndrome by inhibiting the steatosis, insulin resistance, and fibrosis of the liver and adipose tissue in mice with high-fat diet (HFD)-induced obesity.[13] Therefore, we hypothesized that LU inhibits obesity by ameliorating metabolic disorders and inflammation. In this study, we assessed the pathogenesis of obesity-induced sarcopenia in mice and investigated the effects of LU on this process.
2 Results
2.1 Luteolin Ameliorates Metabolic Parameters in Mice with HFD-Induced Obesity
We first investigated the effects of LU on metabolic parameters. The initial weight of each group and the final weight after the experimental diet are shown in Figure 1A. After 20 weeks, the body weights were significantly higher in the HFD group than in the normal diet (ND) group. The LU group had a significantly lower body compared to the HFD group (Figure 1A). This was also observed in terms of body weight gain (Figure 1B). There was no difference in energy intake between the LU group and HFD group (Figure 1C), but the food efficiency ratio of the LU group was significantly lower compared to the HFD group (Figure 1D). The mice fed an HFD developed a significant amount of visceral adipose tissue, including epididymal, perirenal, retroperitoneal, and mesenteric white adipose tissue (WAT), compared with the mice fed an ND. LU reduced the amount of perirenal and mesenteric WAT, thereby resulting in a significant reduction in visceral adipose tissue (Figure 1E). The morphological changes in the epididymal WAT in the ND, HFD, and LU groups are shown in Figure 1F. LU suppressed the HFD-induced increase in adipocyte size. The liver weight (Figure 1G) and hepatic lipid profiles (Figure 1H) were significantly higher in the HFD group than in the ND group. LU supplementation resulted in a dramatic reduction in liver weight compared with nontreated HFD group. The hepatic fatty acid (FA), triacylglyceride (TG), and cholesterol levels were significantly reduced in the LU group than in the HFD group. H&E staining confirmed that fat accumulation was significantly reduced in the livers of the LU group than in the HFD group (Figure 1I).
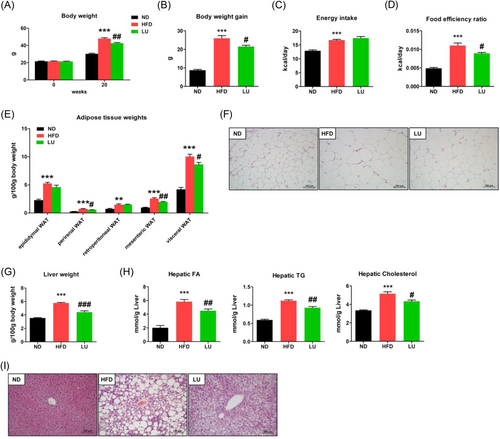
Table 1 shows the lipid concentrations of plasma obtained at the end of the experimental period. The plasma TG, TC, HDL-C, and non-HDL-C concentrations were significantly lower in the ND group than in the HFD group. The plasma TG, TC, non-HDL-C concentrations, and AI were significantly lower in the LU group than those in the HFD group, and there was no difference in the HDL-C concentration. HDL-C/TC ratio (HTR was significantly higher in the LU group than in the HFD group. The ApoA1 levels in the LU group were not significantly different from those in the HFD group, whereas the ApoB levels were significantly lower in the LU group. The ApoB/ApoA1 ratio, a predictive marker for arteriosclerosis and cardiovascular diseases, was significantly lower in the LU group than in the HFD group. These results suggest that the LU supplementation in the mice with HFD-induced obesity improved the overall blood lipid concentrations and normalized hepatic, adipose tissue, and systemic lipid profiles, which is consistent with previously reported findings.[13]
| Measurements | Experimental groups | ||
|---|---|---|---|
| ND | HFD | LU | |
| Free fatty acid [mol L−1] | 1.06 ± 0.04 | 1.10 ± 0.02 | 1.06 ± 0.03 |
| Triglyceride [mmol L−1] | 0.84 ± 0.07 | 1.09 ± 0.09* | 0.80 ± 0.06# |
| Total cholesterol [mmol L−1] | 3.86 ± 0.16 | 6.94 ± 0.20*** | 5.40 ± 0.25### |
| HDL-cholesterol [mmol L−1] | 1.56 ± 0.04 | 1.88 ± 0.04*** | 1.82 ± 0.05 |
| Non-HDL-cholesterol [mmol L−1] | 2.31 ± 0.13 | 5.09 ± 0.24*** | 3.75 ± 0.31## |
| HTR [%] | 39.40 ± 0.92 | 26.63 ± 1.58*** | 34.87 ± 1.51## |
| AI | 1.49 ± 0.06 | 2.72 ± 0.21*** | 1.97 ± 0.13## |
| Apo A1 [mg mL−1] | 0.29 ± 0.02 | 0.36 ± 0.02* | 0.34 ± 0.01 |
| Apo B [mg mL−1] | 0.21 ± 0.01 | 0.44 ± 0.04** | 0.27 ± 0.02## |
| Apo B/Apo A1 | 0.73 ± 0.03 | 1.22 ± 0.07*** | 0.80 ± 0.07## |
- Data are expressed as the mean ± SEM; Student's t-test, n = 8, *p < 0.05, **p < 0.01, ***p < 0.001 versus ND; #p < 0.05, ##p < 0.01, ###p < 0.001 versus HFD. ND (AIN-76), HFD (40% kcal from fat); LU, HFD + 0.01% LU. Non-HDL-cholesterol = (Total cholesterol) − (HDL-cholesterol); HTR, (HDL-cholesterol)/(Total cholesterol) × 100; AI = [(Total cholesterol) − (HDL-cholesterol)]/(HDL-cholesterol). AI, atherogenic index; Apo A1, apolipoprotein A1; Apo B, apolipoprotein B; HDL, high-density lipoprotein cholesterol; HFD, high-fat diet; HTR, HDL-C-to-TC ratio; LU, luteolin; ND, normal diet; SEM, standard error of the mean.
2.2 Luteolin Counteracts Fatty Acid Infiltration into Muscle in Mice with HFD-Induced Obesity
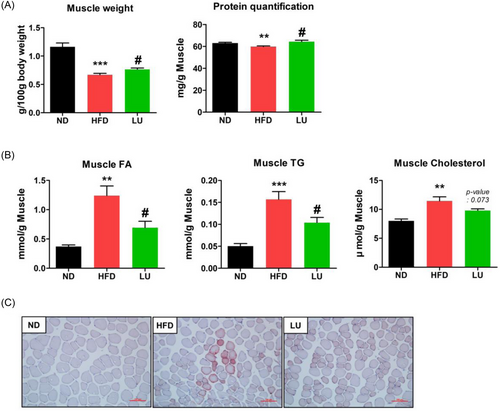
We investigated how the obesity-suppressive effect of LU affects muscle quality. LU restored muscle weight, which was reduced by the HFD. Additionally, LU significantly increased the amount of protein per muscle weight unit compared to the nontreated HFD group (Figure 2A). The FA, TG, and cholesterol levels in the muscle were significantly increased by the HFD. However, the FA and TG levels were significantly lower in the muscles of the LU group than in those of the HFD group (Figure 2B). These results were confirmed by the oil-red O (ORO) staining of the muscles (Figure 2C) and demonstrate that LU positively regulated the lipid profile in the muscle of the mice with HFD-induced obesity.
2.3 Luteolin Inhibits Obese Sarcopenia in Mice with HFD-Induced Obesity
Histological examination of the gastrocnemius muscle cross-sectional area showed that the HFD reduced the muscle fiber size and number (Figure 3A). However, the mean muscle fiber area and number were significantly higher in the LU group than in the HFD group. Grip strength was also significantly increased by 11.5% in the LU group compared with that in the HFD group (Figure 3B). The numerical value of this result was expressed as a simple grip strength unit excluding body weight, which means that the muscle force was increased by LU.
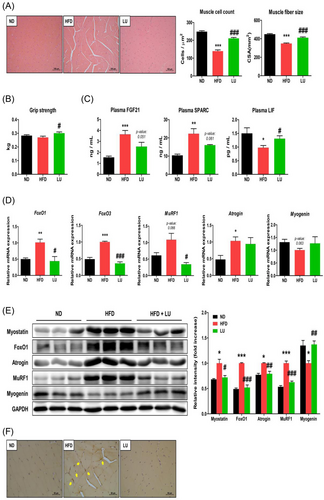
The plasma FGF21 and SPARC levels were significantly increased in the HFD group than in the ND group and were inhibited by LU (Figure 3C). LU restored the plasma LIF concentration (that had been reduced by the HFD) to a level comparable to that in the ND-fed mice (Figure 3C).
Next, we examined the effects of LU on the expression of key genes related to protein degradation and synthesis in the gastrocnemius muscle. The expression of the sarcopenia factors FoxO1, FoxO3, MuRF1, and atrogin was upregulated in the HFD group; their expression, except for that of atrogin, was downregulated to the level in the ND group in the LU group (Figure 3D). Similar to those shown in the RT-qPCR data, the protein levels of myostatin, FoxO1, atrogin, and MuRF1 were significantly increased in the HFD-fed mice but were suppressed by LU (Figure 3E). There was no difference in the mRNA expression of myogenin between the groups, but the protein expression, which was reduced by the HFD, was significantly restored by LU. Immunohistochemical analysis revealed faint myostatin expression in the muscle of the ND and LU groups and a stronger staining in the HFD group, which was consistent with the western blotting results (Figure 3F). LU therefore inhibits myotube atrophy and sarcopenia by regulating myokine secretion and inhibiting the expression of protein degradation factors in muscle tissue.
2.4 Luteolin Inhibits Inflammation in Mice with HFD-Induced Obesity
To investigate whether LU influences obesity-induced inflammation, we analyzed the mRNA expression of inflammatory factors in epididymal fat. The expression of Cd36, Ldlr, TNF-α, and Tlr2 was significantly increased in the HFD-fed mice and suppressed by LU (Supplementary Figure S1a). Compared with that in the ND group, the expression of Mmp2 and Mcp1 was also significantly increased in the HFD group, and LU suppressed their expression but not significantly. The expression of Adipoq, an antiinflammatory factor, was dramatically reduced by the HFD and increased by LU (Supplementary Figure S1a). MT staining confirmed the degree of inflammation and fibrosis in the epididymal fat; only the HFD group exhibited a distinct inflammatory reaction, which was not observed in the ND and LU groups (Supplementary Figure S1b).
We measured the plasma concentrations of various adipokines and found that the concentrations of the inflammatory factors, IL-6, TNF-α, MCP-1, and resistin in the HFD group were significantly higher than those in the ND group. The IL-6, MCP-1, and resistin concentrations were significantly reduced by LU (Figure 4A). Although there was not a significant difference between the groups, the plasma IFN-γ and IL-1β concentrations that were increased by the HFD were suppressed by LU. Some of these results were consistent with the mRNA expression of the inflammatory factors in the adipose tissue. The plasma level of leptin, which was rarely detected in the ND group, was high in the HFD group and inversely correlated with LU (Figure 4A). As for the level of IL-10, an antiinflammatory cytokine, there was not a significant difference between the groups, but the HFD group showed a decreasing tendency compared with the other two groups. Consistent with the RT-qPCR analysis of the epididymal fat, the plasma adiponectin concentrations decreased in the HFD-fed mice, and LU reversed this phenomenon (Figure 4A).
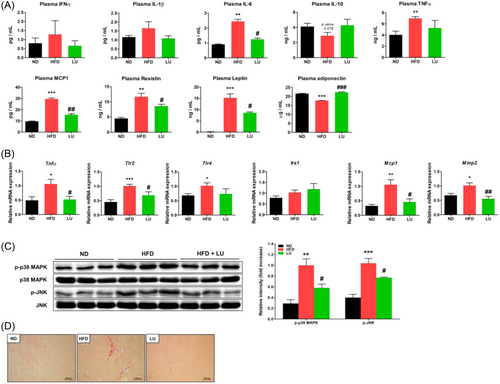
As obesity-related inflammation is one of the main causes of sarcopenia, we examined whether the inflammatory factors of the systemic and adipose tissues affected the muscles. The mRNA expression of TNF-α, Tlr2, Tlr4, Mcp1, and Mmp2 in the gastrocnemius muscle was significantly induced by the HFD. LU inhibited their expression, except for that of Tlr4 (Figure 4B). The activation (phosphorylation) of p38, MAPK, and JNK was substantially increased in the HFD group compared with that in the ND group, and it was prevented by LU (Figure 4C). Skeletal muscle fibrosis was confirmed using Sirius red staining. Compared with the muscles of the ND group, increased fibrosis was observed in the muscles of the HFD group, whereas those of the LU group presented little fibrosis (Figure 4D). LU therefore inhibited obesity-induced muscle inflammation, which may have contributed to the reduction in sarcopenia in the mice.
2.5 Luteolin Improves Muscle Function in Mice with HFD-Induced Obesity
Obesity-induced inflammation increases muscle inflammation and leads to sarcopenia. Therefore, we analyzed the effects of these phenomena on muscle function. The RT-qPCR results showed that the expression of Serca1 and Serca2, which increase muscle heat production and EE, in the gastrocnemius muscle of the LU group increased by 37% and 18%, respectively, compared with that in the HFD group (Figure 5A). Unlike Serca, Sln expression was increased by approximately two-fold by the HFD. In the LU group, Sln expression remained at a level similar to that in the ND group. Compared with the HFD group, the LU group showed significantly increased Pgc1α and Fndc5 expression in the gastrocnemius muscle (Figure 5B). The mRNA levels of Cs and Cpt1β in the gastrocnemius muscle were measured to confirm mitochondrial function and were increased in the LU group compared to those in the HFD group (Figure 5C).
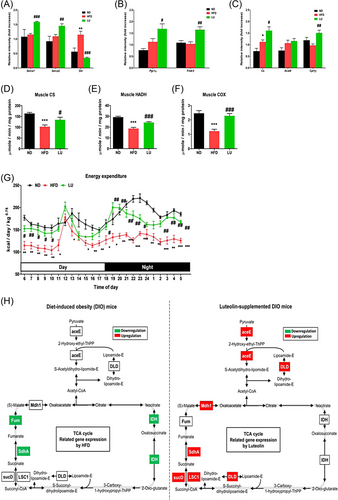
The Cs activity of the gastrocnemius muscle was significantly reduced in the HFD group compared to that in the ND group. This decrease was reversed by LU (Figure 5D). The HADH activity, which plays a catalytic role in mitochondrial FA oxidation, was also reduced by HFD and improved by LU (Figure 5E). The activity of COX—the terminal enzyme in the electron transport chain—was also increased by LU in the obese mice (Figure 5F). The LU group showed markedly higher EE during both day and night than the HFD group (Figure 5G), suggesting that the former expended more energy throughout the day than the latter.
The skeletal muscle microarray analysis revealed that LU upregulated the TCA cycle. As shown in Figure 5H, the expression of fumarase (Fum), succinate dehydrogenase A (SdhA), and isocitrate dehydrogenase (IDH) was downregulated in the HFD group compared with that in the ND group. However, the expression of the pyruvate dehydrogenase E1 component (aceE), dihydrolipoamide dehydrogenase (DLD), malate dehydrogenase 1 (Mdh1), SdhA, succinate-CoA ligase (GDP-forming) subunit alpha (LSC1), and succinyl-CoA synthetase subunit α (sucD) was upregulated in the LU group compared with that in the HFD group. LU therefore inhibited obesity-mediated inflammation and sarcopenia and improved muscle function in the mice with diet-induced obesity.
3 Discussion
Obese sarcopenia is not fully understood as it occurs via several interrelated mechanisms. Our results confirmed that LU prevented the development of obese sarcopenia by inhibiting protein degradation and attenuating metabolic disorders and inflammation that may occur due to the consumption of an HFD.
Consistent with the results of our previous study, we confirmed that body weight was reduced due to adipose tissue reduction in HFD-fed mice administered LU.[13] The fatty liver and plasma lipid profiles were ameliorated by LU—which was also shown in a previous report—thereby confirming that the mouse model of diet-induced obesity used in this experiment was reliable.[13]
The effects of a chronic HFD on muscle mass or function in rodents include the exacerbation of decreased muscle function and increased intramyocellular lipid accumulation. When the C57BL/6JLer mice were fed an HFD (36% kcal from fat), the weights of the soleus and extensor digitorum longus per body weight decreased, and protein degradation was increased, resulting in a decrease in the amount of protein per muscle weight.[14] Eshima et al. measured skeletal muscle contractility in C57BL/6J mice after 4 or 20 months of HFD feeding to determine whether obesity promotes muscle dysfunction during aging. Muscle contractility was reduced by the HFD, which was exacerbated in aged mice fed an HFD for 20 months; HFD also increased the intramyocellular lipid concentration.[15] After feeding our mice an HFD for 20 weeks, our findings were not different from those reported by Eshima et al. The muscle mass and intramuscular protein content decreased, and the lipid content increased. Additionally, the HFD reduced the amount and sizes of muscle fibers, thereby causing muscle atrophy and sarcopenia. We confirmed that LU reduced the amount of FAs and TGs in the muscles and contributed to the recovery of muscle mass and intramuscular protein that had been reduced by the HFD. These results may be indicative of ameliorated obesity by LU. Increased adiposity can stimulate FA infiltration into skeletal muscles, resulting in changes in the homeostasis of muscle protein synthesis.[16] Changes in lipid levels and/or muscle composition may contribute to muscle atrophy.[3] Bryner et al. showed that treatment with palmitate (0.5 mm), the most abundant circulating saturated FA, reduced the myotube diameter in experiments using C2C12 cells as a model system.[17] These results indicate that the plasma lipid-modulating effect of LU reduces FA infiltration into the muscle, which affects the inhibition of sarcopenia.
FGF21 is mainly secreted from the liver, adipose tissue, and skeletal muscle and acts on various tissues to regulate metabolic homeostasis. Lehtonen et al. considered an increase in serum FGF21 to be an indicator of myopathy caused by defects in mitochondrial translation.[18] Roh et al. reported that plasma FGF21 levels were not correlated with muscle mass but had a negative correlation with grip strength.[19] In our study, the plasma FGF21 levels were increased by the HFD and decreased by LU, that is, the FGF21 plasma concentration showed a negative correlation with muscle mass, grip strength, and mitochondrial function, which was consistent with the results reported by Lehtonen and Roh. SPARC (also known as osteonectin or BM-40) is found in bones, myoblasts, myotubes, and muscle fibers and plays pleiotropic roles, particularly by decreasing muscle mass and increasing adipogenesis. It is therefore important for regulating skeletal muscle progenitor cell function.[20] SPARC overexpression can inhibit muscle cell differentiation by reducing the expression of factors, such as including Pax7, Myf5, Myod, Mef2B, and myogenin that are essential for the process.[21] LIF, a pleiotropic member of the IL-6 family, is a myokine whose expression is mainly induced in response to exercise and plays an important role in muscle hypertrophy through the activation of cell proliferation.[22] When L6 cells were treated with LIF (1 ng mL−1), proliferation was enhanced for up to 24 h.[23] In our study, plasma SPARC levels were increased and LIF levels were decreased by the HFD, but the opposite trend was observed following LU supplementation. The positive change in myokine concentrations due to LU supplementation reflects the improvement of muscle cell proliferation, differentiation, and function, which were deteriorated by the HFD.
Skeletal muscle mass and strength maintenance are determined by the balance between muscle protein synthesis and degradation. We observed no difference in the expression of protein synthesis pathway factors among the ND, HFD, and LU groups administered an HFD (Supplementary Figure S2). This was possibly due to insulin resistance caused by obesity as the plasma insulin concentration increased in the HFD group. Conversely, the muscle cell differentiation that underlies skeletal muscle mass is a dynamic process that undergoes multiple stages from satellite cells, myoblasts, and myotubes to mature muscles.[24] Myogenin regulates the differentiation of myoblasts into myotubes, and its expression is downregulated in obesity and diabetes.[25] We found that the myogenin mRNA and protein levels were reduced by the HFD. LU could improve skeletal muscle cell differentiation by restoring myogenin expression. Among the various muscle atrophy pathways, the myostatin pathway negatively affects skeletal muscle development.[26] Myostatin signaling promotes protein degradation by increasing atrogin-1 and MuRF1 expression via FoxO1 and FoxO3.[27] In another pathway, myostatin activates the p38/MAPK signaling cascade, which leads to the activation of atrogin-1 and MuRF1 expression.[28] Both the mRNA and protein expression of myostatin are increased in muscle samples obtained from obese patients via biopsies. Myostatin-deficient mice have shown an increase of up to two-fold in skeletal muscle mass compared with wild-type mice.[29, 30] The expression of atrogin-1 and MuRF1, which are downstream factors of myostatin signaling, is increased not only in the muscles of old mice, but also in those of obese mice.[14] We demonstrated that LU attenuated obesity-induced protein degradation, indicating that the increase in myostatin, FoxO, atrogin-1, and MuRF1 expression was inhibited by LU in obese mice.
Lipid deposition in muscle cells promotes lipotoxicity, thereby exacerbating inflammation and mitochondrial dysfunction.[6] These phenomena influence each other through interactions and become a vicious cycle that impairs muscle regeneration and cell differentiation.[3] TNF-α and MCP-1 are representative proinflammatory factors that are positively correlated with obesity. Their mRNA expression is increased in the muscle tissue of mice with HFD-induced obesity.[30] LU significantly downregulated the mRNA expression of TNF-α and MCP1 in the muscles and plasma of obese mice. Elevated plasma leptin levels induce leptin resistance, a phenomenon that reduces FA oxidation in muscles, thereby contributing to ectopic fat deposition and quality loss in the muscles.[31] In contrast to leptin, adiponectin levels decrease in obesity, and weight loss due to exercise increases plasma adiponectin concentrations.[32] Adiponectin activation increases IL-10 and IL-1Ra production while decreasing TNF-α and IFN-γ production.[33] Recently, TNF-α was shown to directly impair adiponectin signaling, mitochondrial biosynthesis, and myogenesis in primary human myotubes.[34] Systemic resistin concentration was positively correlated with TNF-α and IL-6 levels; in particular, resistin expression in human skeletal muscle was significantly increased by IL-6 infusion.[35] We found that LU regulated the plasma concentrations of proinflammatory and antiinflammatory cytokines, suggesting that LU mediates the modulation of inflammatory responses that affect skeletal function. We also observed the expression of inflammatory receptors and their signals resulting from obesity-induced inflammation in the muscle. LU inhibited the phosphorylation of p38, MAPK, and JNK in the skeletal muscle and reduced the mRNA expression of TLR2 and TLR4.
Mitochondria are essential organelles for ATP production and regulate lipid and glucose metabolism in skeletal muscles.[36] Mitochondrial oxidase activity is reduced in muscle tissue in obesity and diabetes, and mitochondrial destruction is promoted during muscle atrophy.[37] As a metabolic mediator, PGC-1α plays an important role in regulating mitochondrial biosynthesis and oxidative function.[36] The activities of CS, HOAD, and COX, which are key enzymes in mitochondrial metabolism, are closely related to mitochondrial mass, complex activities, and respiration in skeletal muscle.[38] LU increased PGC-1α mRNA expression and CS, HOAD, and COX activities in the muscle and correspondingly increased energy consumption. Through a muscle tissue transcriptome analysis of the obese mice, we further showed that the factors involved in the TCA cycle were upregulated by LU.
4 Conclusions
There are reports that quercetin improves muscle quality by inhibiting adipogenesis in progenitor cells.[39, 40] Since the structures of LU and quercetin are very similar, the antiobesity effect of LU in muscle cells can also be expected. Future studies should therefore be conducted to elucidate the functions of LU in muscle cell differentiation and intramuscular signal regulation using human muscle-derived satellite cells or C2C12 cells. In this study, LU improved muscle mass and function by inhibiting protein degradation and alleviating lipid accumulation and inflammation in the adipose tissue, plasma, and muscle in vivo. The goal of treatments for obese sarcopenia is to preserve muscle mass, improve function, and reduce adipose tissue mass. Thus, our findings suggest that LU may be a useful dietary component to prevent obese sarcopenia.
5 Experimental Section
Animal Experimental Design
Four-week-old male C57BL/6J mice (n = 24, 17–18 g; Joongang Laboratory Animal, Republic of Korea) were housed individually and maintained under standard laboratory conditions (22 ± 2 °C; 12/12-h light/dark cycle) with ad libitum access to food and water. After being acclimatized for 1 week, the mice were randomly divided into three groups, (1) control group fed a normal diet (ND, n = 8, AIN-76), (2) negative control group fed an HFD (n = 8, AIN-76, 40% kcal from fat), and (3) treatment group fed an HFD with 0.01% LU (n = 8; JIAHERB, Xi'an, China). After 20 weeks, the mice were anesthetized with isoflurane (5 mg kg−1 of body weight; Baxter Inc., Deerfield, IL, USA) after 12 h of fasting and sacrificed. Blood was collected from the inferior vena cava to determine the plasma lipid profiles and hormone concentrations. The muscle, liver, and adipose tissues were removed, rinsed with physiological saline, weighed, immediately frozen in liquid nitrogen, and stored at −70 °C until analysis. The animal studies were performed using protocols approved by the Kyungpook National University Industry Foundation (Approval No. 2021-0005).
Lipid Profiles of Plasma and Hepatic and Muscle Tissues
Triglyceride (TG), total cholesterol (TC), and high-density lipoprotein cholesterol (HDL-C) levels were measured using commercial kits (Asan Pharm Co., Seoul, Republic of Korea). Plasma apolipoprotein (Apo) A1 and ApoB levels were determined using colorimetric sandwich ELISA kits (Abcam, Cambridge, UK), as per the manufacturer's instructions. Free fatty acid (FA) levels were measured using an NEFA enzymatic kit (Shinyang, Seoul, South Korea). The amount of non-HDL-C was calculated as follows: non-HDL-C = (TC) − (HDL-C). The HDL-C-to-TC ratio (HTR) was calculated as follows: HTR (%) = (HDL-C)/(TC) × 100. The atherogenic index (AI) was calculated as follows: AI = [(TC) − (HDL-C)]/(HDL-C). Muscle and hepatic lipids were extracted and evaluated using the same enzymatic kit used for the plasma analysis.
Plasma Hormones, Cytokines, and Myokines
The plasma adiponectin level was determined using mouse adiponectin/Acrp30 (R&D systemsTM, Minneapolis, MN, USA). The levels of plasma leptin, resistin, TNF-α, and MCP1 were measured using the MILLIPLEX® MAP Mouse metabolic hormone-expanded Multiplex kit (MMHE-44K, Merck, NJ, USA). Plasma cytokine (interferon [IFN]-γ, interleukin [IL]-1β, IL-6, and IL-10) and myokine (fibroblast growth factor 21 [FGF21], leukemia inhibitory factor [LIF], and secreted protein acidic and rich in cysteine [SPARC]) levels were measured using the MILLIPLEX MAP Mouse Th17 Multiplex (MTH17MAG-47K) and MILLIPLEX MAP Mouse Myokine Multiplex (MMYOMAG-74K) kits, respectively.
Muscle, Liver, and Adipose Tissue Morphology
The muscle, liver, and epididymal adipose tissue were removed from each mouse and fixed in 10% formalin for 24 h. All of the fixed tissues were processed for paraffin embedding, and 4 µm sections were prepared. For morphological analysis, the prepared tissue sections were stained with hematoxylin and eosin (H&E), Masson's trichrome (MT), Sirius red, and Oil Red O (ORO). For muscle tissue immunohistochemistry, antimyostatin antibodies (Invitrogen, Waltham, MA, USA) were diluted at 1:50. All of the stained areas were viewed using an optical microscope (Zeiss Axio Scope, Oberkochen, Germany) under 200× or 400× magnification.
Grip Strength
Grip strength was measured and evaluated using a digital force gauge (FGJN-20; Nidec Corp., Kyoto, Japan). After all the mice had adapted to the measuring device, the average maximum grip strength value was obtained by measuring the strength five times during week 19.
Energy Expenditure
Energy expenditure (EE) was measured using an indirect calorimeter (Oxylet; Panlab, Cornella, Spain). The mice were placed in individual chambers at 25 °C under a 12/12-h light/dark cycle and with free access to food and water. Whole-body O2 consumption (VO2) and CO2 production (VCO2) were recorded at 3-min intervals using a computer-assisted data acquisition program (Chart 5.2; AD Instrument, Sydney, Australia) for 24 h and used to derive the EE. EE was calculated using the following formula: EE (kcal day−1 kg−1 of body weight0.75) = VO2 × 1.44 × [3.815 + (1.232 × VO2/VCO2)].
Enzymatic Activity
Commercial ELISA kits were used to determine the activity levels of muscle citrate synthase (CS), β-hydroxyacyl coenzyme A dehydrogenase (HADH), and cyclooxygenase (COX) (MyBioSource Inc., San Diego, CA, USA).
Western Blotting
Muscle proteins were extracted using tissue protein extraction reagent (T-PER) (Fisher Scientific Inc., Hampton, NH, USA), which contained a protease and phosphatase inhibitor cocktail, and quantified using Bradford Dye Reagent (Bio-Rad Laboratories Inc., Hercules, CA, USA). Total protein (15–45 µg) was subjected to 10% SDS-PAGE, transferred to polyvinylidene fluoride membranes (Merck Millipore, Burlington, MA, USA), blocked with 5% skim milk, and incubated with primary antibodies overnight at 4 °C. The following primary antibodies were used: rabbit anti-GAPDH (1:1000; Cell Signaling Technology, Danvers, MA, USA), antimyostatin (1:1000; Invitrogen), antiforkhead box O1 (FoxO1; 1:500; Cell Signaling Technology), antimyogenin (1:1000; Abcam), anti-p38 MAPK (1:1000; Cell Signaling Technology), antiphospho-p38 MAPK (1:1000; Cell Signaling Technology), anti-SAPK/JNK (1:1000; Cell Signaling Technology), antiphospho-SAPK/JNK (1:1000; Cell Signaling Technology), antiatrogin (1:1000; Abcam), and anti-MuRF (1:1000; Abcam). The immunoreactive antigen was identified by probing with a horseradish peroxidase-conjugated antirabbit IgG (1:1000; Cell Signaling Technology) antibody at 25 °C for 1 h. Chemiluminescence was detected using Westar EtaC Ultra 2.0 (CYANAGEN, Bologna, Italy) and quantified using the Fusion Solo 6S chemiluminescence system (VILBER Lourmat, Collegien, France).
RT-Quantitative PCR (qPCR)
Total RNA was extracted using TRIzol reagent (Invitrogen), and 2 µg of the isolated RNA was reverse-transcribed into cDNA using the Prime Script™ Real-Time reagent kit (Takara, Shiga, Japan). For the qPCR, target gene expression was quantified using the TB Green Premix kit (Takara) and CFX96TM real-time system (Bio-Rad). Gene-specific mouse primers were used (Supplementary Table S1). The cycle threshold (CT) data were normalized to those of GAPDH. Relative gene expression was calculated using the 2−△△Ct method.
Microarray Analysis
Total RNA was amplified and purified using the Ambion Illumina RNA amplification kit (Ambion, Carlsbad, CA, USA). Biotinylated cRNA (750 ng per sample) was hybridized to the Illumina Mouse WG-6 v2 Expression BeadChip (Illumina, San Diego, CA, USA) according to the manufacturer's instructions. The hybrid arrays were washed and stained with Amersham Fluorolink streptavidin-Cy3 (GE Healthcare, Little Chalfont, UK) following the standard protocol provided in the bead array documentation. Hybridization quality and overall chip performance were determined by the visual inspection of both the internal quality controls and raw scanned data in the Illumina BeadStudio software. The probe signal intensities were subjected to quantile normalization and log conversion. A microarray analysis was performed in R with ArrayAssist software (Stratagene, San Diego, CA, USA). Statistical analyses of the differential gene expression between the groups were performed using the nonparametric Rank Prod approach. Oligonucleotides, which represented changes between the groups with a false discovery rate of 0.05, were considered significant. The Kyoto Encyclopedia of Genes and Genomes pathway mapper (www.genome.jp/kegg) was used for the gene function analysis related to the tricarboxylic acid (TCA) cycle. The microarray data were deposited in the Gene Expression Omnibus (Accession No. GSE209778).
Statistical Analysis
The data were expressed as the mean ± standard error of the mean. Statistical analyses were performed using the Statistical Package for Social Sciences (SPSS) (version 25.0; SPSS Inc., Chicago, IL, USA). Significance was determined using an unpaired Student's t-test to compare two groups. p < 0.05 was used to identify significant differences between the means.
Acknowledgements
This research was supported by Basic Science Research Program (No. 2020R1I1A3074694 and 2021R1A2C1011233) through the National Research Foundation of Korea (NRF) funded by the Ministry of Education, Korea.
Conflict of Interest
The authors declare no conflict of interest.
Author Contributions
J.-W.K and S.-K.S contributed equally to this work. J.-W.K.: Investigation, formal analysis. S.-K.S.: Writing – original draft, project administration. E.-Y.K.: Conceptualization, supervision, writing – review, and editing.
Open Research
Data Availability Statement
The data that support the findings of this study are available from the corresponding author upon reasonable request.


