Rice Bran Lipidome Identifies Novel Phospholipids, Glycolipids, and Oxylipins with Roles in Lipid Metabolism of Hypercholesterolemic Children
Abstract
Scope
The purpose of the study is to characterize the chemical diversity in rice bran (RB) lipidome and determines whether daily RB consumption for 4 weeks may modulate plasma lipid profiles in children.
Methods and results
Untargeted and targeted lipidomics via ultra-performance liquid chromatography coupled with high-resolution tandem mass spectrometry (UPLC-MS/MS) are applied to identify bioactive RB lipids from a collection of 17 rice varieties. To determine the impact of RB (Calrose-USA variety) supplementation on plasma lipid profile, a secondary analysis of plasma lipidome is conducted on data recorded in a clinical study (NCT01911390, n = 18 moderately hypercholesterolemic children) before and after 4 weeks of dietary intervention with a control or RB supplemented (15 g day−1) snack. Untargeted lipidomic reveals 118 lipids as the core of lipidome across all varieties among which phospholipids are abundant and oxylipins present. Phytoprostanes and phytofurans are quantified and characterized. Lipidome analysis of the children plasma following RB consumption reveals the presence of polar lipids and oxylipins alongside putative modulations in endocannabinoids associated with RB consumption.
Conclusion
The investigation of novel polar lipids, oxylipins, phytoprostanes, and phytofurans in RB extracts provides support for new health-promoting properties interesting for people at risk for cardiometabolic disease.
1 Introduction
Rice bran (RB) is a coproduct of industrial milling for white rice. RB is a rich source of nutrients, prebiotics, and presents unique ratios of vitamins, minerals, and phytochemicals. Dietary intake of RB has shown health beneficial properties for chronic disease prevention in animals and humans (both children and adults).[1, 2]
Targeted identification of RB lipids has primarily included gamma-oryzanol, tocopherols, tocotrienols, and phytosterols, all of which are already well discussed in the literature.[3, 4] Gamma-oryzanol and phytosterols have compelling impacts on cholesterol regulation[5] and immune functions.[6] RB is also a source of free fatty acids (e.g., palmitic acid, oleic acid, linoleic acid) that can increase antioxidant capacity in hyperlipidemia.[7] Extracts of RB are able to decrease peroxide values in food products susceptible to oxidation and to extend food shelf life. These extracts of RB may be a sustainable alternative as a food additive to improve food quality and safety.[8]
RB can become spoiled and rancid due to lipid peroxidation, a condition that can be delayed with proper stabilization, including the inactivation of endogenous lipases.[9-11] Heat-treatment to prevent lipid oxidation[12] represents one type of stabilization technology for expanding shelf-life and utility of RB for human consumption. In vivo studies show that heat-stabilized RB consumption leads to the modulation of microbiota composition,[13] including, but not limited to the prevention of Salmonella colonization, the regulation of intestinal immunity and colorectal cancer protection.[1, 14, 15]
The RB lipidome warrants molecular food and nutrition science attention for novel bioactives as was shown recently for antimicrobial actions[1, 16] and via an integration of untargeted and targeted metabolic profiling.[17, 18] Oxylipins, phospholipids, sphingolipids, and galactolipids are gaining research attention due to their potential bioactivity and nutritional importance.[19] Polar lipids are biological membrane constituents[20] whereas oxylipins are products of oxidation. Hydroxyoctadecadienoic acid (HODE), hydroxyeicosatetraenoic acid (HETE)[21] or non-enzymatic oxidation of polyunsaturated fatty acids (NEO-PUFA) (phytoprostanes-PhytoPs and phytofurans-PhytoFs)[22, 23] can inhibit the growth of cancer cells and are also classified for their anti-inflammatory actions.
The depth and breadth of chemical diversity in the RB lipidome was investigated herein using 17 rice varieties and for their capacity to modulate human plasma profiles after daily RB consumption for 1-month. Clinical trial details for the feasibility and tolerability of RB consumption in children as well as untargeted metabolome changes involving amino acids, vitamins, and RB phytochemicals are provided in.[24, 25] The major objective of this study was to integrate findings from the novel lipid subclasses of RB with the plasma lipid subclasses that were modified after consumption of RB in hypercholesterolemic children. We tested the hypothesis that the RB food-derived lipids are involved in modulation of the plasma lipidome of children after the daily intake of RB.
2 Results and Discussion
2.1 Rice Bran Lipidome
2.1.1 The Global Rice Bran Lipidome Diversity and Common Core Lipids
To deeply characterize novel lipids present in RB, we applied untargeted lipidomics to the methanolic extracts of 17 rice varieties, and identified 162 distinct lipids which substantially expanded upon the 20 classical compounds routinely quantified from RB oil fractions.[3] Table S1, Supporting Information shows the complete metabolite list for the identified lipids. The RB lipidome encompassed nine distinct chemical classes and each of the nine groups differed by number and relative abundance (Figure 1) across rice varieties. In total, 118 lipids were determined as the core of the lipidome by definition of positive detection across all 17 varieties examined.
In a first glance, first focusing on number of identification which reflects the diversity of compounds in the methanolic extract, we can say that the majority of these core lipids (72% of total number) did not differ in type by variety or growing conditions. There were 45 lipids that did vary by type among the RB collection, and were therefore characterized to be outside of the core lipidome composition. The 28% (45 lipids) associated with genotypic and environmental diversity merit attention for breeding programs or studies in link to agronomical practices. While the function and bioactivity of many RB lipids have been studied,[3] this lipidome, although focusing on oxilipins and polar lipids, revealed novel and minor chemical lipid sub-groups that may demonstrate additive or synergistic activities when RB is consumed as a whole food ingredient.
2.1.2 Richness of the Rice Bran Lipidome in Bioactive Polar Lipids
Phospholipids comprised 34% of the lipidome in this analysis (diversity of structures), and represented the largest class within the lipid profile, in front of 30% free fatty acids and 19% glycerolipid. Then galactolipids, oxylipins, vitamin E isoforms, sterols, fatty acid esters, amino fatty acids, and terpenoids make up 1–7% of the lipidome (Figure 1A).
Phospholipids represent the greatest abundance in RB and a diverse spectrum of compounds, such high abundance and diversity could be explained as being the backbone of membrane cells and organelles. Liu et al.[26] have previously shown phospholipids in rice whole grains as a major lipid class (≈10–50% of total lipids) with important biological functions, but did not separate the RB contribution to these findings. Among the subclasses of phospholipids, the phosphatidylcholines[8] represent (35%) followed by the phosphatidylethanolamine (PE) (22%), and then phosphatidic acid and phosphatidylinositol (PI) are 16%, with the lowest amounts coming from phosphatidylglycerol (PG) (9%) and phosphatidylserine[27] (2%). In a recent review, Robert et al.[28] reported similar classes in vegetable lecithin and more precisely a profile dominated by PC but with variable amount in PI in soy, sunflower, or rapeseed lecithins. A recent study analyzing the phospholipidome in olive oil shows a higher presence/diversity of PG, followed by PA and PI.[29] The glycerophospholipids present in our RB extracts are also found in the plasmatic membrane reported in mammalian cells and similar classes were found, for example, in cows milk coproducts such as buttermilks or butterserums in a prior study by Gassi et al.[30] These results thus emphasize the nutritional interest of RB coproducts since phospholipids cover a wide range of bioactivities that gather cholesterol-lowering properties, antiviral effects, improvement of cognitive function, or memory.[26, 31]
The lower level of galactolipids (7%) and sphingolipids (2%), remain noteworthy as these lipids are present in both plant and animal cell membranes. The galactolipids in plants can act like a storage depot for essential fatty acids even at low concentrations.[32]
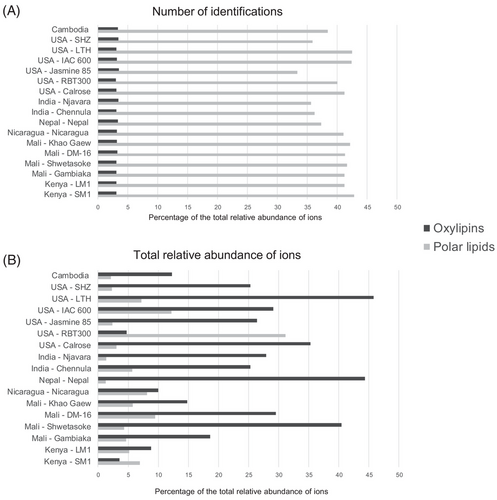
The diversity of compounds in a given class is not always reflected in their abundance in the samples. In untargeted analysis, the relative quantification can be calculated from the total relative ion abundance. Although polar lipids (phospholipids, galactolipids, and sphingolipids) represented around 40% of the RB lipidome in terms of diversity, and oxylipins represent 3% (Figure 2A ), the relative abundance of oxylipins is notably five times higher than the polar lipids, as shown in Figure 2B. The USA-RBT300 is a commercially available source of RB and the Kenya-SM demonstrated distinct profiles with an inversion in the oxylipin/polar lipid relative abundance ratios and these may be a result of differences in milling.

Phospholipids may also play a role in PUFA oxidation products and increasing oxylipins abundance. These oxilipins can be formed both enzymatically and non-enzymatically when the sn-2 fatty acids of phospholipids are oxidized by radicals. So, depending on the fatty acid present in sn-2, the generated oxilipin will change (e.g., if is a arachidonic acid: HETEs will be formed, whereas if is a linoleic acid, HODEs will be formed).[34]
2.1.3 Rice Bran Fatty Acid Quantification across 17 Varieties
RB contains a similar fatty acid profile for all varieties tested (Figure 3A,B) and with prominent levels of oleic acid (≈40%), linoleic acid (≈35%), and stearic acid (≈18%). These data are consistent with previous reports in the scientific literature[3] indicating these fatty acid profiles are largely conserved across varieties.
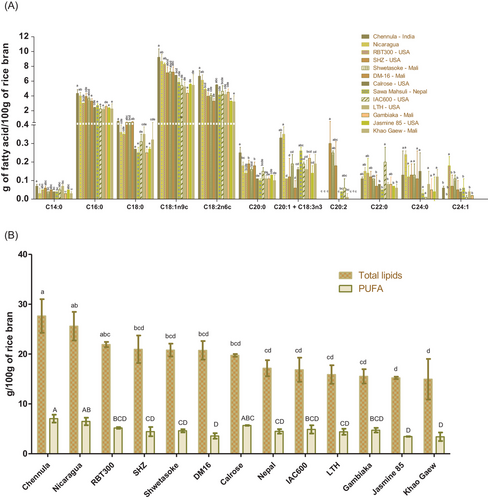
Despite conservation of FA profile, total lipid contents do vary across varieties ranging from 27.64 g 100 g−1 of RB in Chennula to 14.95 g 100 g−1 of RB in Khao Gaew. The variability of total lipid contents is remarkable if we analyze only the samples from Mali where Shwetasoke (20.79 g 100 g-1 of RB) and DM16 (20.74 g 100 g-1 of RB) show no statistical difference between them, but Gambiaka (15.53 g 100 g-1 of RB) and Khao Gaew (14.95 g 100 g-1 of RB) are statistically different. These results confirm the important contribution of lipid content on RB. Detailed attention to the environmental conditions of cultivation, agronomic practices, and post-harvest processing are warranted to facilitate a strong understanding of the potential for additional modifiers of RB lipid composition. The PUFA contents in RB ranged between 3.41 and 7.05 g 100 g−1 of RB (Figure 3B). The Chennula (India) variety had the highest content of PUFA, followed by Nicaragua (Nicaragua), Calrose, and RBT300 (USA) with 6.49, 5.68, and 5.18 g 100 g−1 of RB, respectively. Levels indicated for linolenic acid, a fatty acid that is subject to enzymatic and non-enzymatic oxidation, is of special interest since its oxidation products have shown important bioactivities. Such interest supports our next focus developed in the following section and on targeting oxylipins.
2.1.4 Non-Enzymatic Oxylipins Analysis across Rice Bran Varieties: Emphasis in Phytoprostanes and Phytofurans
For the specific analysis of the NEO-PUFA, the RB that had the highest abundance of PUFA was selected. These included Njavara and Chennula (India), and the Shwetasoke and DM16 (Mali), one variety from Nepal, one from Nicaragua, and the following from United States (Calrose, Jasmine 85, SHZ, LHT, IAC600, and RBT300). Studies highlight these NEO-PUFA for not only being considered as novel markers in plants, but also for presenting relevant biological activities to humans.[35]
The total amount of PhytoPs and PhytoFs were previously described in white grain flour, brown grain flour, and RB.[36-38] Figure 4 shows the concentrations detected in the varieties tested herein in decreasing order of mass. This study demonstrates higher contents of total PhytoPs when compared to prior reports, and ranging between 316.98 and 2937.63 ng g-1 of RB. PhytoFs ranged between 117.05 and 1695.05 ng g−1 of RB. Among the RB sampled, Shwetasoke from Mali showed the highest levels, and was significantly different from other varieties (p < 0.05) with respect to total PhytoPs and PhytoFs (2937.63 ng g−1 of RB and 1695.05 ng g−1 of RB, respectively). The study conducted by Pinciroli et al.[36] with whole rice cultivars from Argentina indicated the highest content in RB as 118.00 and 27.74 ng g−1 for PhytoPs and PhytoFs, respectively.
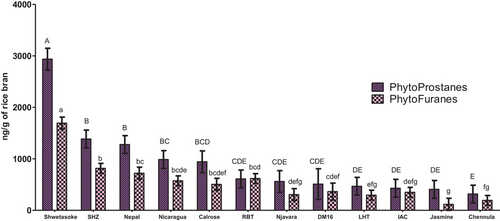
There were seven compounds of PhytoPs identified herein, namely ent-16-F1t-PhytoP, ent-16-epi-16-F1t-PhytoP, 9-F1t-PhytoP, 9-epi-9-F1t-PhytoP, ent-16-B1-PhytoP, ent-9-L1-PhytoP and 16(RS)-16-A1-PhytoP,and three compounds of PhytoFs: ent-16(RS)-9-epi-ST-Δ14-10-PhytoF, ent-9(RS)-12-epi-ST-Δ10-13-PhytoF and ent-16(RS)-13-epi-ST-Δ14-9-PhytoF. All RB in this study contained PhytoPs and PhytoFs. The amount of each compound is displayed in Table 1 (with the exception of two PhytoFs (ent-9(RS)-12-epi-ST-Δ10-13-PhytoF and ent-16(RS)-13-epi-ST-Δ14-9-PhytoF) due to coelution with other compounds that may influence the final content). The main PhytoP found in RB was 16(RS)-16-A1-PhytoP (ranging between 60.14 ng g−1 of RB in Chennula from India and 1184.04 ng g−1 of RB in Shwetasoke from Mali) and ent-16-B1-PhytoP (ranging from 53.67 ng g−1 of RB in Chennula from India to 657.82 ng g−1 of RB in Shwetasoke from Mali), while the main PhytoF found in RB was ent-16(RS)-9-epi-ST-Δ14-10-PhytoF (ranging between 72.32 ng g−1 of RB in Jasmine 85 from USA and 687.63 ng g−1 of RB in Shwetasoke from Mali). To our knowledge, this study is the first report on the detection of 16(RS)-16-A1-PhytoP in RB.
| Genotype | Phytoprostanes | Phytofurans | ||||||
|---|---|---|---|---|---|---|---|---|
| ent-16-F1t-PhytoP | ent-16-epi-16-F1t-PhytoP | 9-F1t-PhytoP | 9-epi-9-F1t-PhytoP | ent-16-B1-PhytoP | ent-9-L1-PhytoP | 16(RS)-16-A1-PhytoP | ent-16(RS)-9-epi-ST-Δ14-10-PhytoF | |
| Chennula | 39.96±4.36bcd | 29.56±2.44bcd | 54.86±8.58cd | 30.88±2.68cd | 53.67±4.49b | 47.96±5.83b | 60.14±4.02c | 76.00±9.48f |
| Njavara | 59.12±15.84abcd | 44.90±4.68abc | 89.63±9.37cd | 49.45±5.49bcd | 98.43±9.92b | 91.28±3.88b | 119.19±9.06c | 156.46±20.86def |
| DM16 | 59.81±0.00abcd | 38.17±0.00bcd | 83.04±0.00cd | 36.63±0.00bcd | 93.21±0.00b | 86.46±0.00b | 112.57±0.00c | 199.88±0.00cdef |
| Shwetasoke | 89.65±42.49a | 67.96±29.64a | 250.55±98.36a | 94.29±14.53a | 657.82±266.00a | 593.31±292.32a | 1184.04±483.25a | 687.63±289.85a |
| Nepal | 86.47±23.09ab | 45.97±3.50abc | 200.67±47.14ab | 74.31±22.85ab | 253.58±58.23b | 227.39±57.62b | 386.00±92.69bc | 420.59±11.93b |
| Nicaragua | 95.50±6.29a | 69.65±2.03a | 111.33±13.92bcd | 71.06±7.13ab | 196.07±47.14b | 167.89±31.39b | 276.61±53.92bc | 385.19±52.46b |
| Calrose | 48.78±7.57abcd | 27.27±5.64bcd | 75.87±17.15cd | 45.60±8.56bcd | 208.19±1.87b | 212.22±6.49b | 326.26±6.19bc | 319.09±79.20bcd |
| IAC 600 | 28.10±4.59cd | 20.09±4.11cd | 57.77±11.97cd | 23.40±5.51cd | 80.49±10.44b | 69.13±5.51b | 150.59±18.14c | 240.66±62.20cde |
| Jasmine 85 | 24.33±4.67d | 16.31±3.64d | 31.00±2.69d | 17.06±1.43d | 99.95±31.75b | 92.25±29.30b | 127.41±35.16c | 72.32±4.72f |
| LHT | 54.20±5.72abcd | 49.61±5.06ab | 94.46±14.75bcd | 53.61±4.19bc | 65.00±8.31b | 65.22±5.84b | 85.93±7.30c | 148.33±26.13ef |
| RBT 300 | 68.48±7.66abcd | 50.75±5.49ab | 102.19±7.91bcd | 49.99±5.58bcd | 110.54±11.51b | 89.18±8.68b | 139.13±12.56c | 246.90±14.35cde |
| SHZ | 75.80±23.26abc | 39.37±4.11bcd | 144.34±28.24abc | 80.16±8.22ab | 224.28±52.18b | 218.51±38.11b | 611.07±78.59b | 361.36±36.92bc |
- Letters indicate significant differences between the rice bran genotypes for a given Phytoprostane or PhytoFuran (one-way ANOVA, p < 0.001).
Based on literature assessing impacts of temperature and storage conservation on PhytoF and PhytoP formation,[38] we anticipate that there could be an influence of the country of origin on these lipids. Indeed the country of origin could influence environmental and postharvest conditions, milling process, and storage time after milling in the rice industry.[38] However, the wide spectrum range of different PhytoP and PhytoF contents among the varieties did not allow for correlations by country of origin. In addition, we can say that quantification of PhytoPs and PhytoFs soon after the milling process would be ideal for accurate comparisons but is impossible considering our sampling scheme in various countries.
2.1.5 Multivariate Analysis of Rice Bran Lipidomics
The multivariate analysis of PLS-DA confirmed the differentiation of the global lipid profiles of each variety (Figure 5). In the Figure 5A, across all cultivars and all identified lipids, the PLS component 1 (PC1) explains 80% of the total variation in the dataset, and PC2 6%. The PLS-DA also shows the separation of the groups from the model. These results showed that the lipid profile is not specific to regions (or countries). Given the separation of RB variety within the same country, we conclude that the lipid profiles cannot be considered specific to any region, and that we should emphasize influence on genotype as previously described for whole grain rice.[39, 40]
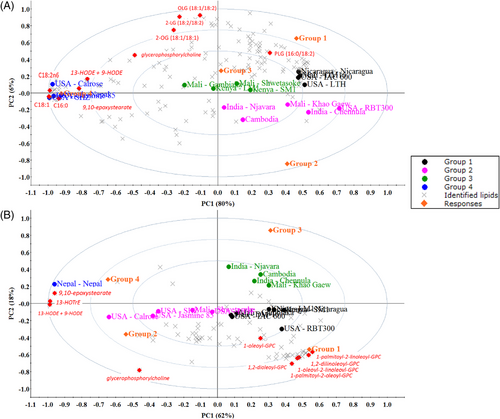
The PLS-DA analysis highlighted lipids responsible for differentiation of RB by cultivars by integrating the relative total abundance, including presence or absence of each metabolite. Figure 5 shows the 10 discriminant lipids by VIP (variable importance in projection) (in red color) are fatty acids, glycerolipids, oxylipins, and a polar lipid. These included oleic acid (18:1n9c), linoleic acid (18:2n6c), palmitic acid (16:0), linoleoyl-linoleoyl-glycerol (18:2/18:2),[1] oleoyl-linoleoyl-glycerol (18:1/18:2),[2] oleoyl-oleoyl-glycerol (18:1/18:1),[1] and palmitoyl-linoleoyl-glycerol (16:0/18:2),[2] two oxylipins: 13-HODE + 9-HODE and 9,10-epoxystearate and one polar lipid, the phospholipid glycerophosphorylcholine.[8]
Focusing on the polar lipids and oxylipins, a new PLS-DA have been performed considering only this data. In Figure 5B, the PLS component 1 (PC1) accounted for 62% of the total variation in the dataset, and PC2 for 18%. We can note that the configuration of the groups has been changed in comparison with complete data analysis (all lipids in Figure 5A). Nepal RB was the variety that shows the most difference between the two PLS projection. The VIP compounds, in this case, indicated three oxylipins (13-HODE+9-HODE, q-value 0.04, 9,10-epoxystearate, q-value 0.03, and 13-HOTrE-hydroxyoctadecatrienoic acid, q-value 0.04) and seven phospholipids. To note, all these phospholipids have a PC polar head and with MUFA or PUFA acyls moieties: 1,2-dilinoleoyl-PC (18:2/18:2), 1-oleoyl-2-linoleoyl-PC (18:1/18:2), 1,2-dioleoyl-PC (18:1/18:1), 1-palmitoyl-2-oleoyl-PC (16:0/18:1), 1-oleoyl-PC (18:1), 1-palmitoyl-2-linoleoyl-PC (16:0/18:2).
Untargeted lipidomics supported that there was diversity between tested RB, and highlighted the importance for presence of smaller lipid classes to the core lipidome. This work suggests that low abundance oxylipins and glycerolipid molecules should be considered for bioactivity importance with potential for synergies with higher abundance fatty acids and phospholipids. Prior to these comprehensive profiling and targeted lipid analysis, RB had not been considered as an interesting source of synergistic bioactive lipids (phospholipids and oxylipins).
2.2 Plasma Lipidome Changes in Children after Rice Bran Consumption for 4 Weeks
2.2.1 Children Plasma Lipidomics
To evaluate whether lipids from a diet enriched with RB could positively modulate blood lipid metabolism in humans, we analyzed plasma from a study completed with moderately hypercholesterolemic children.[24, 25] Plasma lipidomics revealed a total of 406 plasma lipids for all the children involved in the study. Nine groups of compounds were identified for strong association to lipid metabolism (Figure 6). The presence of long-chain fatty acids, as well as omega-3 and omega-6 fatty acids is noteworthy and reflect their important part in lipid metabolism (e.g., phospholipid and sphingolipids metabolism). PUFA represents 18% of the fatty acids identified in this study (Figure 6). The major sub-classes are listed by decreasing chemical diversity and included 26% fatty acids/bile salts, vitamins, carnitines, phospholipids, and sphingolipids metabolism, 19% of total diversity of fatty acids, a class of 18% of total diversity of phospholipids, plasmalogens, and their products of hydrolysis, a class of 12% of total diversity of sphingolipids and their derivatives, that is to say ceramides (Figure 6).
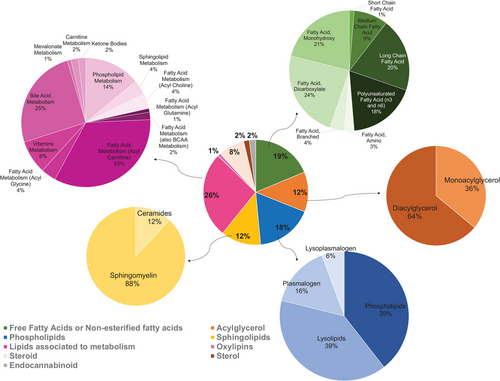
Other lipid groups that merit attention in the plasma that show chemical diversity and functionally are phospholipids and sphingolipids. These contribute to lipoproteins assembly and transport of lipid to target organs.[28] Given that the multivariate analysis of plasma from children whose diet was supplemented with RB did not show strong associations in their overall lipidome, we next applied a focus on sphingolipids, fatty acids, oxylipins, sterols, and endocannabioids for scrutiny in the blood. This intentional focus decreased the total number of identified metabolites to 285 lipids.
2.2.2 Multivariate Analysis of Plasma Lipidomics
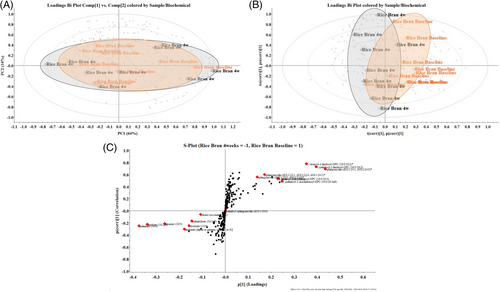
The PCA on the plasma metabolomes of children before (RB baseline) and RB after 4 weeks intervention displayed a 16% of variance in lipids on the vertical/y-axis (Figure 7A). To visualize the maximum variance captured in the first dimension (horizontal/x-axis), these data were subjected to an Orthogonal partial least squares discriminant analysis (OPLS-DA) model shown in Figure 7B. The lipid profile variations distinguishing the two timepoint groupings were the covariance p[1] and correlation p[1] loadings from a two class OPLS-DA model (RB Baseline vs RB 4 weeks) that are shown in S-Plot format (Figure 7C). The points are exact Mass/retention time pairs (EMRTs). The upper right quadrant of the S-plot shows those components which are elevated in RB Baseline while the lower left quadrant shows EMRTs elevated in RB after 4 weeks, the treated group.
2.2.3 Discriminant Plasma Lipids between Dietary Rice Bran and Control Groups
Compounds responsible for discriminating the groups are plotted in red in Figure 7C. The presence of circulating phospholipids and sphingolipids in the plasma of the children at the beginning of the study differ from the presence of long-chain fatty acids (tails of 13 to 21 carbons), very long-chain (tails of 22 or more carbons), and also mono and polyunsaturated (oleic, linoleic and linolenic) fatty acids. Notably, very long-chain FA (C22:0, C24:0) are also present in low quantity in RB (Figure 3A). A paired comparison of the discriminating compounds for each child highlights the remarkable variability of the lipid profile. Only 56% of the patients showed changes according to the discriminating lipids.
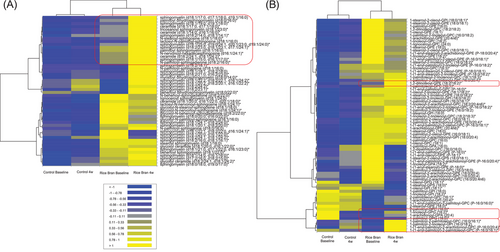
In order to make correlations between lipid profiles, heat maps were performed and are displayed in Figure 8. The control group was absent or had low presence of sphingolipids when compared to the RB supplemented children that showed changes before and after 4 weeks of RB supplementation (Figure 8A). The relationships between sphingolipids and associations with hypercholesterolemia remain an active area of investigation.[41-43] Figure 8B focuses on phospholipids, and we find PUFA in position 2 and phosphate groups as PC, PE, and PI. Also noteworthy is the increase in circulating PUFA in plasma after RB supplementation. This fact may be related to the diversity of molecules in which they may be esterified and increasing their bioavailability (phospholipids and acylglycerols). Monoacylglycerols can act as protectors against digestive actions, carrying omega 3 fatty acids and then modify their bioavailability Cuenoud et al.[44]
Daily supplementation of RB in children for 4 weeks showed changes to PUFAs, oxylipins, endocannabinoids, and fatty acids (Figure 9A). This signal further highlights the presence of some fatty acids as related to RB diet such as oleic, linoleic and linolenic acids, behenic acid, docosadienoic, docosahexaenoic acids (DHA), as they showed an increase over the RB baseline. The positive changes on these lipid subgroups in children plasma after supplementation includes decrease in two oxylipins: 9,10-DiHOME and 12-HETE. Some oxylipins can also have a proinflammatory action, signaling a lipid disorder and these oxilipins are characterized by their potential prooxidant effect.[45]
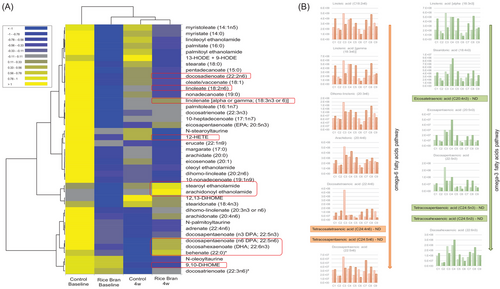
The daily RB supplementation for 4 weeks led to an increase in endocannabinoids (Figure 9A), which is one of the classes with the lowest number of identifications, yet these are key messengers for the gut-brain axis.[46] Among the endocanabinoids whose presence increased post RB intake are arachidonoyl ethanolamide (synthesized from arachidonic acid) and stearoyl ethanolamide. Endocannabinoids are endogenous neurotransmitters, lipid-derived, produced from the consumption of the essential fatty acids and can act as a signal for a metabolic disorder.[47]
A paired analysis was performed from the identified PUFAs, following the synthesis pathway according to Balić et al.[48] and Sergeant et al.[49] In Figure 9B, five children out of 18 showed an increase in the detected PUFA that were present in the metabolism of omega-6 pathway such as linoleic, gamma-linolenic acid, dihomo-linolenic, arachidonic, and docosatetraenoic acids, and in the metabolism of omega-3 pathway such as alpha-linolenic, stearidonic, eicosapentaenoic acid, docosapentaenoic and docosahexaenoic acids.
In this study, a lipidomics lens helped us not only to characterize the methanolic extracts of RB, but also to reanalyze blood lipid signatures in children from a previous RB feeding study that showed tolerability and feasibility of RB consumption into the diet for 4 weeks.[24, 25] Some important study limitations to address are the small sample size as well as the short duration of the RB feeding trial. Also, the plasma lipidomics platform may need optimization prior to targeted quantification of oxylipins in blood plasma. Future research studies are warranted that co-assess clinical serum makers of chronic disease risk with the targeted and untargeted lipidome. Validation of RB food-derived lipids and increasing the dose of RB intake may be essential to establish quantitative changes to these putative modulations of circulating phospholipids, oxylipins, endocanabinoids, and PUFA.
3 Conclusion Remarks
Lipidomics had utility to elucidate novel suites of RB food-derived lipids alongside lipid metabolite markers for human plasma that may be linked to RB consumption. The RB food analysis revealed a highly conserved core lipidome that did not significantly differ in ratios by variety or growing conditions, but was useful to identify novel subclasses of oxylipins. PhytoPs and PhytoFs that have lower levels of expression than classical tricaylglycerols or even phospholipids may be functionally important to health and nutrition from RB. The RB supplementation study in children indicated unique changes to key plasma lipids, including polyunsaturated fatty acids, phospholipids, and endocannabinoids that are important co-regulators of lipid metabolism. Oxylipins levels were not correlated with PUFA contents in RB food, yet the novel RB polar lipids and oxylipins merit targeted attention in future feeding studies for exhibiting additive and synergistic impacts on health. The content and the profile of PhytoPs and PhytoFs recovered in RB suggest that these coproducts are an important natural vegetal source of oxylipins. We conclude that RB lipidome compositions have essential functional food industry applications to improve human nutrition, which are global priorities for linking food consumption with health across the lifespan.
4 Experimental Section
Rice Bran Collection
Heat-stabilized RB (110 °C for 6 min) from 17 rice varieties were assembled from different geographical locations and genetic backgrounds including Cambodia (Cambodia), India (Njavara and Chennula), Kenya (SM1 and LM1), Mali (Khao Gaew, Shwetasoke, Gambiaka, and DM16), Nepal (Nepal), Nicaragua (Nicaragua), and the United States (Calrose, Jasmine 85, SHZ, IAC600, LHT, and RBT300) were used for untargeted and targeted lipidome analysis in the present study.
Polar Lipids and Enzymatic Oxylipins in Rice Bran Extracts
To focus on polar lipids and oxylipins, a methanolic extraction (80% aqueous methanol) was used to specifically extract these compounds, as previously described Zarei et al.[18]
Total Lipid Profile Determination by Gas Chromatography
In 25 mL round bottom flask, RB samples (≈100 mg) with about 10% internal standard (C17:0) were added to 3 mL sodium methylate solution with phenolphthalein. Reaction medium was refluxed for 10 min. 3 mL chlorohydric methanol was added to phenolphthalein discoloration and the mixture was refluxed again for 10 min and then cooled to ambient temperature. 6 mL hexane and 10 mL water were added, and the organic phase was recovered and analyzed by gas chromatography.[50] A Focus GC (Thermo Electron Corporation, MA, USA) was used and equipped with a split injector (ratio of 1/20), a CP-Sil 88 Varian capillary column (50 m × 0.25 mm with 0.2 εm film thickness; Chrompack, Mid-delburg, the Netherlands), and helium 1 mL min−1 as the carrier gas was used. Fatty acids methyl esters (FAME) were analyzed by flame ionization detector and ChromCard software data system (version 2005, Thermo Fisher Scientific, MA, USA). The column temperature started from 150 °C, then reached 150–225 °C with a rise of 5 °C min−1 and was kept at 225 °C for 10 min. FAME were identified using as external standards a mixture of methyl esters (Mix37, Sigma-Aldrich, Sweden). The injector and detector temperatures were 250 and 270 °C, respectively. Each sample was methylated in triplicate.
Non-Enzymatic Oxylipins Analysis by UPLC-MS/MS
The NEO-PUFA (PhytoPs and PhytoFs) present in RB were extracted following the methodology described by Pinciroli et al.[36] with minor modifications. Briefly, 200 mg of crushed samples were placed into grinding matrix tubes (Lysing matrix D, MP Biochemicals, Illkirch, France) and added with 25 µL of BHT (1% in MeOH, w/v), 1 mL of MeOH and 4 µL of Internal Standard (IS, 1 µg mL−1). The mixture was ground in the FastPrep-24 for 30 s, 6.5 m s−1 (one cycle) at room temperature, then transferred to 15 mL centrifuge tube, and completed with 1 mL MeOH, and 1.5 mL of phosphate buffer (pH 2) saturated in NaCl. The set was placed in an IKA KS 4000 control shaker for 30 min (100 rpm-45 s per 90–15 s), at room temperature. The samples extracts were centrifuged at 1500 rpm during 5 min and supernatants were separated, and added by 4 mL of cold chloroform. These solutions were vortexed for 30 s and then centrifuged at 2000 rpm for 5 min at cold temperature. Subsequently, aqueous phases were eliminated and organic phases were isolated in a pyrex tube to be concentrated under a nitrogen flow at 40 °C. Hydrolysis of samples was performed by dissolving the dry extract into 950 µL of KOH (1 M in H2O), followed by incubation into a shaker at 40 °C for 30 min and at 100 rpm. At the end of the incubation period, 1.0 mL of formic acid solution (40 mM) was added to the mixture and then stirred for 30 s. Solid phase extraction[36] was achieved by using Oasis mixed-mode ion-exchange sorbent cartridges previously, conditioned with 2 mL of methanol and equilibrated with 2 mL of 20 mM formic acid at pH 4.6. After loading the SPE column with samples, the cartridges were successively washed with: 2 mL of NH3 at 2% v/v, 2 mL of MeOH:formic acid 20 mM (30:70, v/v), 2 mL of hexane, and finally 2 mL of hexane:ethyl acetate (70:30, v/v). The column was dried for 1–2 min, then targeted metabolites were eluted with 2× 1 mL of hexane:ethanol:acetic acid mixture (70:29.4:0.6, v/v/v) and then dried with N2 (40 °C, 1 h). The dry extracts were reconstituted with 100 µL of H2O/ACN (83:17, v/v). Reconstituted samples were transferred in filtering Eppendorf 0.45 µm and centrifuged at 10 000 rpm for 1 min.
Chromatographic separation of PhytoPs and PhytoFs was performed using a micro liquid chromatography coupled with a QTRAP-MS/MS 5500 (Sciex Applied Biosystems), using the analytical column HALO C18 (0.5 × 100 mm, 2.7 µm, Eksigent Technologies, CA, USA). The column temperatures were 40 °C. The mobile phases consisted of LC-MS grade water/(ACN/MeOH 80:20) added with 0.1% formic acid. The injection volume and flow rate were 5 µL and 0.03 mL min−1 upon the following gradient (min/%B): 0/17; 1.6/17; 2.85/21; 7.3/25; 8.8/28.5; 11/33.3; 15/40; 16.5/95; 18.9/95; 19/17; 21/17. The spectrometric analysis was conducted in Multiple Reaction Monitoring mode (MRM) operated in negative mode. Electrospray ionization in negative mode was used as ionization source. Nitrogen (N2) was used as curtain gas and the voltage was kept at −4.5 kV. Data acquisition and processing were performed using MultiQuant 3.0 software (Sciex Applied Biosystems). The quantification of PhytoPs and PhytoFs detected in RB was performed by constructing calibration curves of the ratio between analyte to IS area under the curve.
Dosage Information/Dosage Regimen
The University of Colorado Health-North Institutional Review Board and the Colorado State University Research Integrity and Compliance Review Office approved the study protocols (#13-1263 and 13-4390, respectively). Participants' guardians provided written informed consent and children participants provided written informed assent prior to participation in the blood collection and dietary intervention. Two study intervention groups were included for this study that represent a subset from a randomized controlled, 4-arm dietary intervention clinical trial (NCT01911390).[25] The plasma metabolome was previously published and described by Li et al.[24] Briefly, for this secondary analysis of the plasma lipidome, the study analyzed 18 moderately hypercholesterolemic children (total cholesterol ≥ 180 mg dL-1), aged 8–13 years old before and after 4 weeks of dietary intervention with a control or RB supplemented snacks. The prepared snacks (low-fat, low-sodium, high-fiber) contained 15 g day-1 of RB and consumed as either two banana muffins with hazelnut (114 g) or one banana, strawberry, and pineapple smoothie (247 g). These were consumed once a day for 4 weeks. The study analyzed plasma lipidome from control participants that received snacks prepared without RB (n = 9) and RB intervention participants that received two snacks per day prepared with 7.5 g RB for a total daily dose of 15 g day−1 (n = 9). Blood (4 mL) was collected in EDTA tubes at the beginning of the study and after 4 weeks of daily consumption of the snacks. Blood was processed for untargeted plasma metabolite profiling by storing immediately on ice and final storage at −80°C prior to metabolite extraction.[24] No changes in cholesterol were identified following 4-week intervention in the 18 moderately hypercholesterolemic children aged 8–13 years old.[25]
Rice Bran and Plasma Analysis
Lipids of RB (≈100 mg) were extracted with 80% methanol by Metabolon, Inc. (Durham, NC, USA) and plasma was prepared using the automated MicroLab STAR system (Hamilton Company, USA). To remove protein of plasma and recover small molecules, the sample was precipitated with methanol and vigorously shaken for 2 min (Glen Mills GenoGrinder 2000) followed by centrifugation according to Borresen et al.[25] Untargeted lipidomics of all RB extract samples were analyzed by UPLC-MS/MS and gas-chromatography mass spectrometry (GC-MS) in the positive and negative ionization mode platforms. The plasma extract was analyzed by reverse phase on the UPLC-MS/MS with positive and negative ion mode electrospray ionization and hydrophilic interaction liquid chromatography (HILIC) with negative ion mode electrospray ionization. The data were processed into Metabolon's Library Information Management System, according to Li et al.[24] Briefly, raw data were obtained and peak-identified by Metabolon. The identified lipids were confirmed by comparison to an internal library of over 3300 entries of purified standards or recurrent unknown entities maintained by Metabolon, based on the retention time/index, m/z, and chromatographic data. The sub-pathway classification scheme used by Metabolon was to provide overlap to other programs such as Metaboanalyst, KEGG etc. The subgroup study of nine classes of compounds included free fatty acids, non-esterified fatty acids, phospholipids, sphingolipids, acylglycerols, oxylipins, sterols, steroids, and endocannabinoids. These sub-pathways were selected were as a focus due to the strength of associations with dietary modulation of human lipid metabolism. Identified lipids were quantified in terms of relative ion abundance.
Statistical Analysis
Data pre-processing had been performed by Metabolon, i.e., the values were normalized in terms of raw area counts. So, for a single-day run, this was equivalent to the raw data. For the statistical analysis from the generated UPLC-MS-MS untargeted data, data normalization was performed using the EZinfo v. 3.0.3 (Umetrics, Sweden) tool applying the normalization of Pareto-scaling where the x-variables were centered and scaled to “Pareto variance.”[51] Data normal distribution from RB powder and children's plasma studies were checked using Metaboanalyst before and after normalization. The principal component analysis (PCA) was performed for the plasma lipidome data, two partial least squares-discriminant analysis (PLS-DA) were conducted for the RB data considering all the data and a subset with the polar lipids and oxylipins, the Variable Importance in Projection (VIP) compounds were selected considering a score >2, and S-plot was performed by Orthogonal Partial Least Squares-Discriminant Analysis (OPLS-DA). One-way ANOVA (Tukey, p < 0.05) with FDR correction for metabolomic data was performed by using Metaboanalyst (q-values presented in Tables S2, S3, Supporting Information).
The fatty acid profile data were submitted to one-way ANOVA (Tukey, p < 0.05) by using XLStat (v 2021.1.1). The PhytoPs and PhytoFs concentrations in RB were subjected to one-way ANOVA (Fisher p < 0.05) for comparisons across varieties. Repeated measures ANOVA were applied to the human plasma lipidome for comparisons between baseline and 4-week post intervention in the RB and control groups. XLStat (v 2021.1.1) also constructed the heatmaps using the relative ion abundances in each matrix.
Acknowledgements
The authors thank Dr Anna McClung from the USDA Agricultural Research Service Dale Bumpers National Rice Research Center for supplying the rice bran used in the human feeding study. Funding for this study was provided National Institute of Food and Agriculture (NIFA; 2016-67001-24538, Ryan), the Foundation for Research Support of State of Rio de Janeiro (FAPERJ) (26/010.100988/2018; 26/202/709-2018; 26/201.848/2019; 26/200.171/2022), National Council for Scientific and Technological Development (CNPq) (427116/2018-0; 310343/2019-4) and supported by UNIRIO, Coordination for Improvement of Personnel with Higher Education (CAPES) (financial code 001) and sabbatical scholar stipend was provided by Montpellier University of Scholarly Excellence (MUSE).
Conflict of Interest
The authors declare no conflict of interest.
Author Contributions
M.C.B.S.: conceptualization, formal analysis, investigation, writing – original draft and writing – review and editing. N.B.: conceptualization, formal analysis, investigation, and supervision. V.L.: conceptualization and supervision. V.M.: supervision. P.V.: conceptualization and supervision. B.Z.: formal analysis and investigation. C.O.: formal analysis and investigation. C.V.: conceptualization, investigation, and supervision. T.D.: conceptualization, investigation, and supervision. M.S.L.F.: conceptualization, writing-review and editing, supervision, project administration. C.B.-L.: conceptualization, writing – review and editing, supervision, project administration. E.P.R.: conceptualization, writing-review and editing, supervision, project administration, funding acquisition. All authors have read and agreed to the published version of the manuscript.
Open Research
Data Availability Statement
Plasma and RB variety metabolomics datasets are available publicly as supplemental files in Li, K. J., Borresen, E. C., Jenkins-Puccetti, N., Luckasen, G., Ryan, E. P., Navy bean and rice bran intake alters the plasma metabolome of children at risk for cardiovascular disease. Frontiers in Nutrition 2018, 4 and Zarei, I., Luna, E., Leach, J. E., McClung, A. et al., Comparative rice bran metabolomics across diverse cultivars and functional rice gene⁻bran metabolite relationships. Metabolites 2018, 8, 63.


