RETRACTED: Forensic characteristics and genetic affinity analyses of Xinjiang Mongolian group using a novel six fluorescent dye-labeled typing system including 41 Y-STRs and 3 Y-InDels
Abstract
Background
Y-chromosomal genetic marker haplotypes of individuals can define the paternal kinship or genealogies to which they belong and further provide clues for forensic individual identifications. Studying the genetic structure of the Mongolian group will help to bring to light the Mongolian ethnic origin, and explicate the genetic affinities among the studied and compared populations. Some forensic scientists have studied the genetic background of the Mongolian group based on different molecular genetic markers. These studies were of very great reference significance for the Mongolian group genetic research, whereas the investigation of Y-STR haplotype data in the Xinjiang Mongolian group is still insufficient.
Methods
Genetic characteristics of 182 unrelated healthy male Mongolian individuals were revealed by 41 Y-chromosomal short tandem repeat and 3 insertion/deletion molecular genetic markers. Furthermore, analyses of molecular variance programs, multi-dimensional scaling plots, and phylogenetic tree reconstructions were operated to explore the genetic relationships of the Xinjiang Mongolian group with comparative 23 populations from China and 33 populations from worldwide nations.
Results
The genetic diversity values ranged from 0.0641 (rs771783753) to 0.9502 (DYF387S1). A total of 165 distinct haplotypes were identified, of which 150 (90.91%) were unique. The discrimination capacity, match probability, and haplotype diversity of 44 loci were 0.9066, 0.0067, and 0.9988, respectively. Additionally, the Mongolian group had the most intimate relationship with Gansu Dongxiang (RST = 0.0165), followed by HulunBuir Mongolian (RST = 0.0187), Inner Mongolia Daur (RST = 0.0202) as well as other three minority ethnic groups from the Xinjiang region (RST < 0.05) in all compared Chinese populations, and clustered together with the majority of Asian populations in a worldwide scale.
Conclusions
Consequently, the 44 loci could be well applied in forensic applications of the Mongolian group. The haplotypes available in here made new contributions to the existing population genetic information and would be of great value in population studies.
1 INTRODUCTION
Since the genetic characteristics of male-specific and strict patrilineal inheritance, Y chromosomal genetic markers have important forensic practical value in mixed sample identifications (such as sexual assault cases), paternal kinship identifications, genealogical patrilineage, and population origin inference studies (Calafell & Larmuseau, 2017; Kayser, 2017). There are many different kinds of molecular genetic markers on the Y chromosome, including satellite DNA, short tandem repeat (STR), insertion/deletion (InDel), and single-nucleotide polymorphism (SNP) and so on. The SureID® PathFinder Plus kit (HEALTH Gene Technologies Co., Ltd.), a novel six fluorescent dye-labeled system including 41 Y-STRs (DYS533, DYS388, DYS19, DYS392, DYS456, DYS447, DYS444, DYS645, DYS643, DYS460, DYS437, DYS439, DYS557, DYS385, DYF387S1, DYS522, DYS438, DYS389I, DYS448, DYS389II, DYS596, GATA_H4, DYS518, DYS393, DYS391, DYS390, DYS635, DYS449, DYS458, DYS593, DYS549, DYS576, DYS570, DYS481, DYS627, DYS527, and DYF404S1), 29 of which are attributed to the Y-Chromosome STR Haplotype Reference Database (YHRD) Maximal dataset, and 3 Y-InDels (rs199815934, rs771783753 and rs759551978) was designed. Moreover, this kit is the combination of high and low mutation rate loci, which not only facilitates family line investigation but also discriminates different male individuals from the same paternal lineage. Due to their respective superiorities of low mutation rate, rapid mutation rate or high polymorphism, the 12 newly added Y-STRs (DYS388, DYS447, DYS444, DYS645, DYS557, DYS522, DYS596, DYS593, DYS527, and DYF404S1) have also attracted the attention of forensic researchers (Ballantyne et al., 2012; Du et al., 2018; Hanson, Berdos, & Ballantyne, 2006; Schoske, Vallone, Kline, Redman, & Butler, 2004). To further evaluate the performance of the SureID® PathFinder Plus kit through forensic parameters, in comparisons with those of other commercial kits, we genotyped the 44 loci in 182 Mongolian individuals living in Xinjiang Uygur autonomous region (XJM), China.
Mongols are a traditional nomadic people. At present, the Mongolian group is one of 55 ethnic minorities in China where Mongolians mostly live in Inner Mongolia autonomous region, the Xinjiang Uygur autonomous region, the Qinghai province, and other regions. Moreover, the Mongolian group is also the major nationality of Mongolia. Up to the present, forensic scientists carried out many studies on the genetic polymorphisms of the Mongolian group. And these studies were based on different molecular genetic markers, such as autosomal STRs (Fang et al., 2019; Gao et al., 2014; Wen et al., 2019; Zha et al., 2014), X-Chromosome STR (Chen et al., 2018), Y-STR (Fu et al., 2016; Gao et al., 2016; Wang et al., 2019), human leukocyte antigen (Gu, Chen, Yao, Sun, & Shi, 2019; Hong et al., 2007), SNPs (Brissenden et al., 2015). These studies were of great reference values for the Mongolian group genetic research, while research on the Y-STR haplotype data in XJM group is still insufficient. Therefore, we conducted this study to create the XJM population data for YHRD, a Y-STR haplotype standard database (Willuweit & Roewer, 2007), as well as providing new practical clues for the genealogical and evolutionary research of the Mongolian group. Furthermore, analysis of molecular variance (AMOVA) program, multidimensional scaling (MDS) plots, and phylogenetic trees were operated to explore the genetic differentiations between XJM and the comparative 23 populations from China, and 33 populations from worldwide nations.
2 MATERIALS AND METHODS
2.1 Studied sample collection and comparison populations
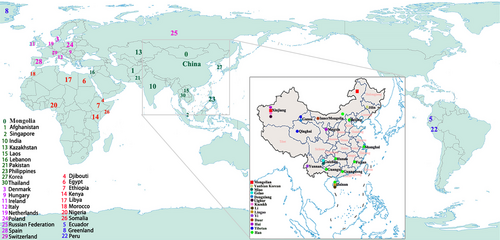
The study strictly complied with the human and ethical research principles and was approved by the Ethics Committees of Xi'an Jiaotong University Health Science Center and Southern Medical University. Bloodstain samples including 182 unrelated healthy male Mongolian individuals residing in Xinjiang Uygur autonomous region, China, were collected in accordance with written informed consent and with the following requirements: (a) belong to this region for at least three generations; (b) no population migration in their family history; (c) no blood relationships among them. The comparative population data came from the YHRD. The detailed remarks and the geographical distributions of the Mongolian group and the comparison populations were summarized in Figure 1.
2.2 PCR amplification and Y-STR genotyping
About 1.0 mm2 of the bloodstain sample was directly amplified by the multiplex PCR system of 44 loci on GeneAmp PCR system 9,700 (Thermo Fisher Scientific), following the manufacturer's instructions. The 10 µl total volume of multiplex reaction was consist of the bloodstain sample, 5 µl of Master Mix, 2.5 µl of Primer Mix, and 2.5 µl nuclease-free water. The thermal cycling parameter was set as 95°C for 5 min, 30 cycles of 94°C for 10 s, 60°C for 1 min, 72°C for 30 s, and then 60°C for 15 min and stored at 4°C. Subsequently, 1.0 µl PCR product was mixed with 0.5 µl internal standard SIZ-580 (Health GeneTech) and 8.5 µl Hi-Di deionized formamide for denaturation at 95°C for 3 min and cooled at 4°C for 3 min. Finally, Applied Biosystems® 3500 xL Genetic Analyzer (Thermo Fisher Scientific) was used for STRs and InDels genotyping. GeneMapper ID-X software (Thermo Fisher Scientific) was used to analyze electrophoresis results.
2.3 Quality control
DNA 9,948 and sdH2O were genotyped as the positive control and negative control, respectively. The available haplotypes in this research have been submitted to YHRD, with the accession number of YA004579 (Xinjiang, China, [Mongolian]).
2.4 Statistical analyses
Four multi-copy loci (DYF404S1, DYS527, DYF387S1 and DYS385) were regarded as allelic combination, respectively. Allelic frequencies of 36 single-copy locus and the observed allelic combination numbers of 4 multi-copy loci were obtained using online Genepop version 4.2 software. Allelic combination frequencies of the multi-copy loci were calculated with direct counting method. The haplotype numbers consisting of these 44 loci were measured by the Arlequin version 3.5 (Excoffier & Lischer, 2010), and the corresponding haplotype frequencies were directly calculated as the ratio of haplotype numbers divided by sample size. The genetic diversity (GD) and haplotype diversity (HD) are computed follow the formula as Nei's described: GD or HD = n (1 − ∑pi2)/(n − 1), where n indicates the sample size and pi denotes the frequency of the i-th allele or haplotype (Nei, 1973). Match probability (MP) is computed with computational formula as MP = ∑pi2. Discrimination capacity (DC) is the ratio of total number of distinct haplotypes to the sample size (Zhu et al., 2014). Furthermore, in order to measure the effect of the newly added loci, forensic parameters of XJM group, such as GD, MP and DC in the newly added loci and five different haplotype sets (AmpFLSTR® Yfiler® kit, Promega PowerPlex® Y23 kit, AmpFLSTR® Yfiler® Plus kit, YHRD Maximal, and the kit under investigation) were compared.
Pairwise genetic distances among the studied Mongolian group and 23 previously reported Chinese populations (Cao et al., 2018; Fan, An, et al., 2018; Fan, Wang, Chen, Long, et al., 2018; Fan, Wang, Chen, Zhang, et al., 2018; Fan, Zhang, et al., 2018; Lang et al., 2019; Liu et al., 2019; Nothnagel et al., 2017; Song et al., 2019; Wang et al., 2019; Wang et al., 2018; Wang et al., 2017; Wang et al., 2016; Willuweit & Roewer, 2007; Xie et al., 2019; Zhang et al., 2019; Zhou et al., 2018), as well as among the studied group and other 33 previously reported worldwide populations (Aliferi et al., 2018; D'Atanasio et al., 2019; Kim et al., 2001; Laouina et al., 2011; Lee et al., 2014; Mohapatra et al., 2019; Pamjav, Fothi, Feher, & Fothi, 2017; Rapone et al., 2016; Singh, Sarkar, & Nandineni, 2018; Spolnicka et al., 2017; Willuweit & Roewer, 2007; Zhabagin et al., 2019) were measured by RST values and the corresponding p values (10,000 permutations) based on the haplotypes of 27 STR in Yfiler® Plus kit and those of 17 STR in Yfiler® kit, respectively. The RST values were counted by the AMOVA program in the online available ‘AMOVA and MDS’ tool on the YHRD, and an intuitive MDS plots were also generated (Willuweit & Roewer, 2015). When calculating the RST values with the online YHRD tool, multi-copy loci (except DYS385 and DYF387S1) were removed and the repeat number (alleles) of DYS389I was subtracted from that of DYS389II locus. Subsequently, the related heatmaps of RST values were displayed by R version 3.5.3 software, and phylogenetic trees based on the RST data of pairwise population were reconstructed, using the MEGA version 4.0 software with the UPGMA method (Tamura, Dudley, Nei, & Kumar, 2007) and were embellished by iTOL version 4.0 software (Letunic & Bork, 2019), respectively.
3 RESULTS
3.1 Single-copy locus analysis
In this study, a total of 182 males from XJM group were investigated using 41 Y-STRs and 3 Y-InDels. There were 233 different alleles of 36 single-copy locus and 117 allelic combinations of 4 multi-copy loci observed in the group with the corresponding frequencies from 0.0055 to 0.9670, 0.0055 to 0.1868, respectively. The least number was observed 3 alleles at the DYS645 locus (Y-Indels did not count in), whereas the most number was 14 alleles at the DYS518 locus. Intermediate alleles were genotyped at DYS447 (alleles 22.4 and 23.4), DYS645 (6.4), DYS518 (36.2 and 37.2), DYS458 (18.2) and DYS481 (25.1). The minimum and maximum GD values of the 44 loci were 0.0641 (rs771783753) and 0.9502 (DYF387S1), respectively. GD values of the newly added Y-STRs were 0.4953 (DYS388), 0.8267 (DYS447), 0.7154 (DYS444), 0.2094 (DYS645), 0.7683 (DYS557), 0.7236 (DYS522), 0.6015 (DYS596), 0.5682 (DYS593), 0.9178 (DYS527) and 0.9262 (DYF404S1) with a mean value of 0.6752.
3.2 Haplotype diversities
There were 165 different haplotypes observed, and 150 (90.91%) of which carried a unique haplotype. The total HD, MP and DC values of 44 loci were 0.9988, 0.0067, and 0.9066, respectively (Table 1). Furthermore, to further illustrate the efficiency of these newly added loci, the different haplotype numbers, proportions of unique haplotypes, overall HD, MP, and DC values for the 15 newly added loci and five different haplotype sets in the XJM group were computed and exhibited in Table 1. The HD values increased from 0.9950 at the 17 Y-STR loci, 0.9981 at 29 loci, to 0.9988 at 44 loci; and DC values ranged from 0.7363 of 17 loci, 0.8681 of 29 loci, to 0.9066 of 44 loci. Moreover, HD value for 15 newly added loci was 0.9932. Compare with the YHRD Maximal, the 15 newly loci included in SureID® PathFinder Plus kit, especially the Y-STRs with higher GD values, improved the haplotype diversity and discrimination capacity of XJM group.
| Time(s) of observed haplotype and other forensic parameters | Haplotype sets | |||||
|---|---|---|---|---|---|---|
| Yfiler® kit | PowerPlex® Y23 | Yfiler® Plus kit | YHRD Maximal Loci | SureID® PathFinder Plus kit | 15 newly added loci | |
| 1 (unique) | 103 | 118 | 139 | 139 | 150 | 87 |
| 2 | 23 | 23 | 16 | 16 | 14 | 25 |
| 3 | 2 | 2 | 2 | 3 | ||
| 4 | 3 | 4 | 1 | 2 | ||
| 5 | 2 | 1 | 1 | 1 | 3 | |
| 6 | 1 | 1 | ||||
| 7 | 1 | |||||
| Number of loci | 17 | 23 | 27 | 29 | 44 | 15 |
| Number of different haplotypes | 134 | 146 | 158 | 158 | 165 | 122 |
| Proportion of unique haplotype | 0.7687 | 0.8082 | 0.8797 | 0.8797 | 0.9091 | 0.7131 |
| HD | 0.9950 | 0.9965 | 0.9981 | 0.9981 | 0.9988 | 0.9932 |
| MP | 0.0105 | 0.0090 | 0.0074 | 0.0074 | 0.0067 | 0.0123 |
| DC | 0.7363 | 0.8022 | 0.8681 | 0.8681 | 0.9066 | 0.6703 |
3.3 Genetic differentiations among different Chinese populations
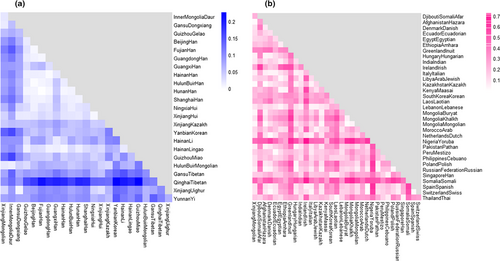
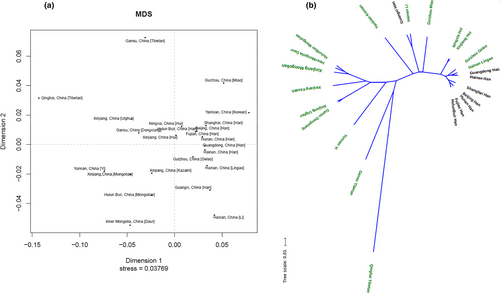
Heatmap of the RST values was revealed in Figure 2a. The maximum distance relationship was observed between XJM and Yanbian Korean populations (RST = 0.1397), followed by Guizhou Miao (RST = 0.1322) and Fujian Han (RST = 0.1144) populations. The RST values between XJM and Gansu Dongxiang (RST = 0.0165), HulunBuir Mongolian (RST = 0.0187), Inner Mongolia Daur (RST = 0.0202), Xinjiang Uighur (RST = 0.0337), Xinjiang Hui (RST = 0.0363), Xinjiang Kazakh groups (RST = 0.0456) were all below 0.05, representing the little genetic differentiation between the XJM group and these compared populations (Balloux & Lugon-Moulin, 2002). To gain more intuitive exhibition of the relationships among these groups, the MDS plot and NJ phylogenetic tree are shown in Figure 3a,b. In the MDS plot, the XJM group together with the Inner Mongolia Daur, HulunBuir Mongolian, Xinjiang Kazakh, and the Yunnan Yi groups got together at the lower left corner region, and the Xinjiang Uighur, Gansu Dongxiang, Xinjiang Hui as well as the Ningxia Hui groups formed a module in the middle of the plot. In addition, the Han populations of different regions also gathered closely together on the right. The branches of the phylogenetic tree were relatively similar to these clustering patterns of the MDS plot. The XJM, HulunBuir Mongolian, Inner Mongolia Daur, and the Gansu Dongxiang and those populations from the Xinjiang region formed a branch. Chinese Han populations distributed in different regions were evidently crowded together, the Guangxi Han was an exception. And Ningxia Hui and Xinjiang Hui groups formed one subbranch.
3.4 Genetic differentiations among populations from different countries
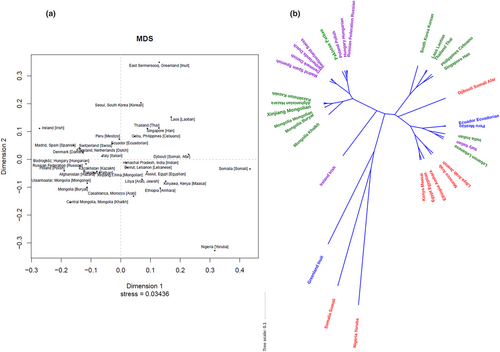
The RST heatmap was exhibited in Figure 2b. The MDS plot and the NJ phylogenetic tree were also presented in Figure 4a,b. Here RST values demonstrated the Mongolian group had the closest genetic distance with the Afghanistan Hazara population (RST = 0.0144), followed by the Kazakhstan Kazakh population (RST = 0.0150), the Ulaanbaatar Mongolian population (RST = 0.0244), and the Mongolia Buryat population (RST = 0.0288), while the farthest distant relationship with the Somalia Somali population (RST = 0.4771) and the Nigeria Yoruba population (RST = 0.4558). The XJM group was hermetically clustered together with the populations from East Asian, such as Afghanistan Hazara, Kazakhstan Kazakh, Pakistan Pathan, Ulaanbaatar Mongolian, Mongolia Buryat, and the Central Mongolia Khalkh populations. And their distribution areas were defined in the third quadrant of the MDS plot. Eight African populations were mainly distributed near the fourth quadrant. Nine European populations formed dense clusters at the junction of the second and third quadrant. Three American populations, the South Asian populations, and the Korean population mainly located in the first quadrant and its neighboring region. Certainly, the aggregation patterns of these populations in the phylogenetic tree were also compliant with these distribution patterns in the MDS plot.
4 DISCUSSIONS
GD value is an important indicator for measuring the degree of genetic polymorphism. The 12 newly added Y-STRs, except DYS593 (0.5682), DYS388 (0.4953), and the DYS645 (0.2094) loci, had the GD values greater than 0.6, with a mean GD of 0.6752. And together with the 3 Y-Indels of rs199815934 (0.3686), rs771783753 (0.0641), rs759551978 (0.0744), and other Y-STRs, the average GD value of the 44 loci was 0.6636, suggesting most of the Y-STR loci incorporated in SureID® PathFinder Plus kit exhibited high polymorphisms in the XJM group, although the GD values of several loci were relatively low. For example, the DYS388 locus, it was also reported with a lower GD value (GD < 0.5) in other populations (Bian, Siyit, Zhu, Zhao, & Zhang, 2015; Lee et al., 2014; Mohyuddin et al., 2001; Shi et al., 2015). Additionally, the low GD values of DYS645 and 3 Y-Indels may be favorable for differentiating individuals of different ethnicities (Schoske et al., 2004). These rapid mutating Y-STR loci, DYF387S1, DYS518, DYS449, DYS576, DYS570, DYS627, and DYF404S1 possessed higher genetic polymorphisms (GD > 0.7) in the XJM group, and they may exhibit obvious advantages in distinguishing both related and unrelated male individuals (Ballantyne et al., 2012).
The haplotypes of individuals can define the paternal kinship or genealogies to which they belong and further provide clues for forensic case investigations. In this study, all 44 loci in this multiplex panel were treated as one haplotype combination. As expected, the newly added loci could bring about different haplotypes, and consequently engendered higher discrimination capacity and lower random match probability. Nevertheless, the Yfiler® Plus kit and YHRD Maximal shared identical forensic parameters (haplotype numbers and HD, MP, and DC values), which was consistent with the previous study (Zhou et al., 2018). Therefore, more highly polymorphic loci still need to be used to distinguish such unrelated individuals. The SureID® PathFinder Plus system containing additional 15 loci, the majority of which appeared to be high polymorphisms, and thus possessed higher HD and DC values than YHRD Maximal, making it an effective complement tool of existing panels for studying the XJM group.
The AMOVA method was made to measure the genetic variances between pairwise populations. The pairwise RST and p values between the XJM group and other reference populations from the YHRD were calculated. To better describe population genetic differentiations, visualized heatmaps of RST values, MDS plots, and phylogenetic trees were drawn up, respectively. Herein, the maximum genetic distance was observed between the XJM and the Yanbian Korean population, followed by the Guizhou Miao and Fujian Han, which could be explained by their geographic location. The Dongxiang ethnic minority mainly lives in the Gansu Linxia Hui Autonomous Prefecture, and the Dongxiang area was the most important station of the Mongolian garrison in 13th century (Wang et al., 2018). Simultaneously, the origin of the Dongxiang group has been traced to the Mongol people, and the Dongxiang people are the Altaic language speakers, whose language is almost identical with Mongolian, although Chinese is their common written language (Wang et al., 2018; Wang, Wise, Baric, Black, & Bittles, 2003). Accordingly, it is justifiable that there were intimate genetic relationship between the XJM and Dongxiang population. Here, the Guangxi Han population was far away from the main Han clade, which was consistent with a previous study (Lang et al., 2019). The Guangxi Han population clustered tightly with the Hainan Li in the NJ tree, and together with the Hainan Han, the Hainan Li and the Hainan Han (Lingao area) populations located in the fourth quadrant in the MDS plot. This result maybe manifested in the history that the Li group came from the ancient Yue ethnic group, which settled in the present Guangxi Zhuang autonomous region, and their frequent gene flows and complex genetic histories (Fan, Wang, Chen, Zhang, et al., 2018). For understanding the differentiations through a wider geographical background, RST and the corresponding p values between the Mongolian group and other 33 populations from different countries and regions were computed. The results showed that the population cluster distributions were basically consistent with the geographical distributions of these countries. The Xinjiang Uygur autonomous region is situated in the northwest border of China, and has the characteristics of long international borders, which is adjacent to Mongolia, Kazakhstan, India, Afghanistan, Pakistan, and other countries. It is useful for understanding the present of smaller genetic relationships between XJM and the populations from Afghanistan, Kazakhstan, and Mongolia. However, the present research has not clearly dissected their genetic relationships, thus genetic affinities among them need further studying.
5 CONCLUSION
In the present research, we investigated the genetic polymorphisms and haplotype distributions of 41 Y-STRs and 3 Y-InDels in the XJM group. Population data suggested that the 44 loci could be well applied in forensic applications of the XJM group. Meanwhile, the haplotypes provided in the study enriched the genetic informational resources in the YHRD database and could be used as valuable reference data for future research of population genetic studies.
ACKNOWLEDGMENT
This study was supported by the National Natural Science Foundation of China (NSFC, No. 81525015) and the Guangdong Province Universities and the Colleges Pearl River Scholar Funded Scheme (GDUPS, 2017).
CONFLICT OF INTEREST
The authors have declared no conflict of interest.
AUTHORS CONTRIBUTION
B.F. Zhu designed the study, obtained funds, and critically reviewed the final draft of the manuscript. Y.F. Liu performed statistical analysis, as well as drafted and revised the manuscript. T.T Yu and J.B. Huang contributed reagents/materials. S.Y. Mei and X.Y. Jin collected the samples and edited the paper. Q. Lan, Y.S. Zhou, Y.T. Fang, and T. Xie inspected the figures and tables, and edited the paper. All authors approved the final draft of the manuscript submitted for review and publication.


