RETRACTED: An innovative panel containing a set of insertion/deletion loci for individual identification and its forensic efficiency evaluations in Chinese Hui ethnic minority
Abstract
Background
Individual identification is one of the most important tasks in the field of forensic genetics. Insertion/Deletion (InDel) polymorphism marker has been a promising marker for individual identification. However, a part of InDel loci in commonly used commercial kit show low polymorphisms in Chinese populations.
Methods
We evaluated a panel of 35 InDel loci constructed previously for individual identifications in Hui group. Subsequently, population data of three Chinese populations from 1,000 Genomes Project database were used to evaluate individual identification performance of these 35 InDels. Forensic parameters, such as heterozygosity, power of exclusion, match probability and power of discrimination, were calculated to evaluate the forensic efficiency of these loci in Hui group. The heatmap of insertion allelic frequencies, Nei's genetic distances, pairwise fixation index values, principal component analyses and admixture analyses were used to analyze the genetic differentiations and structure between Hui group and other populations.
Results
In studied Hui group, besides rs3054057, polymorphism information content values of the remaining loci were greater than 0.3. Values of expected heterozygosity of these loci were close to 0.5. The combined power of discrimination and power of exclusion values were 0.99999999999999659609 and 0.998682, respectively. Analyses of population genetics revealed that Chinese Hui group had closer genetic relationships with East Asian populations than other intercontinental populations.
Conclusion
The forensic statistical analyses revealed these loci showed relatively high genetic polymorphisms in Chinese Hui group, and could be served as a useful tool for individual identifications in Hui group. Population genetic evaluations indicated that Chinese Hui group had close genetic relationships with East Asian populations.
1 INTRODUCTION
In judicial practice, human identification (HID) is one of the main tasks in forensic genetics. Currently, short tandem repeats (STR) and single nucleotide polymorphisms (SNP) are widely applied in the field of forensic genetics (Guo, Chen, Xie, et al., 2018; King et al., 2018). Polymerase chain reaction (PCR)-STR-based DNA typing technology is one of the most important genotyping methods in forensic DNA laboratories. Based on the Combined DNA Index System (CODIS), the number of STRs in commonly used commercial kits has increased to 22–25 loci (Fang et al., 2018; Hennessy et al., 2014; Zhang et al., 2015), acquiring a higher HID efficiency and more accurate conclusions. However, it is limited that STR markers are applied in the detection of challenging forensic samples like degraded samples due to their longer amplified fragments (usually extending up to 450 bp) and higher mutation rates (10-3–10-4/base/generation)(Sun et al., 2012; Yang, Xie, & Yan, 2014). SNPs have many advantages such as wide distributions in human genome, small amplified fragments and low mutation rates (10-8/base/generation) (Campbell et al., 2012; Sachidanandam et al., 2001), which make them extensive in the forensic field. Nowadays, SNP makers have been widely applied in biogeographic ancestry inference, genotyping of challenging samples and phenotype inference. Commonly used SNP analysis methods include minisequencing (SNaPshot), TaqMan and pyrosequencing technology (Bender et al., 2006; Hampe et al., 2001; Syvänen, 2001). Compared with PCR-STR technology, these genotyping methods are complicated and expensive (Väli, Brandström, Johansson, & Ellegren, 2008), which limit their wide applications in primary forensic laboratories.
Appearing as the insertion or deletion of DNA fragments with diverse lengths in the human genome, InDel polymorphism belongs to DNA length polymorphism, which can be separated and genotyped by capillary electrophoresis (Väli et al., 2008). In 2010 (1000 Genomes Project Consortium, 2010) reported the locations, allele frequency distributions and local haplotype structure of one million short InDels. InDels have the advantages of both STR and SNP markers, including low mutation rates, small amplified fragments and easy to genotyping by capillary electrophoresis. To date, InDels have been increasingly concerned by forensic geneticists with potential applications in human identifications and ancestry inference (Guo, Chen, Jin, et al., 2018; Guo et al., 2016).
The commonly used InDel kit for individual identification was the Qiagen Investigation® DIPplex kit, which contained 30 InDel loci. Although this panel performed well for individual identifications in European and American populations, some loci had been proven to be relatively low polymorphisms in some populations from China. When evaluating this kit, Wei et al. (Wei, Qin, Dong, Jia, & Li, 2014) found low polymorphisms at HLD111, HLD118, HLD64 and HLD81 loci in Chinese Han and Tibetan groups. Xie et al. (Xie et al., 2018) found that there were low values of polymorphic information content (PIC) and expected heterozygosity (He) at HLD118, HLD111, and HLD39 loci in Hui group. Ma et al. (Ma et al., 2018) evaluated the genetic polymorphisms of these 30 InDel loci in Salar group, and they found that HLD39, HLD64, and HLD111 loci were low polymorphisms and their PIC and He values were less than 0.25 and 0.3, respectively. These results indicated that some loci in the Qiagen Investigation® DIPplex kit showed low polymorphisms in Chinese populations and was not suitable for Chinese populations in forensic individual identifications.
Based on the current situation and needs of the forensic practice, we previously constructed a set of 35 InDel loci with relative high polymorphisms in Chinese three populations for individual identifications. We evaluated the forensic application performance of these loci in Hui group and subsequently investigated genetic relationships among Chinese Hui and reference populations. We hoped that the wide applications of this InDel panel will assist the forensic practitioners to solve the issues of individual identifications in Chinese Hui group.
2 MATERIALS AND METHODS
2.1 Ethical statement and sample collection
This research was permitted by the ethics committee of Xi'an Jiaotong University Health Science Center and Southern Medical University, China. All research processes containing samples collection and experiments were in accordance with the requirements of the ethics committee. Totally, blood samples from 477 unrelated Hui individuals residing in northwest of China were acquired after written informed consents were obtained. Each volunteer declared their health condition and ancestry information.
2.2 InDel loci screening strategy and primer design
We selected 35 InDel loci from dbSNP database to establish a multiplex amplification panel following the criteria described by Jin et al. (Jin et al., 2019; Larue et al., 2014; Pereira et al., 2009). The selected 35 InDel loci were listed as following: rs3028455, rs2308194, rs3067194, rs10629077, rs5846092, rs3082950, rs1160964, rs4210, rs4024564, rs3040095, rs3839237, rs2307433, rs1610945, rs16678, rs25570, rs16646, rs3066543, rs3029940, rs5882232, rs3057689, rs66502133, rs3831219, rs34224758, rs5803454, rs3054057, rs61681053, rs10556291, rs10637537, rs10609615, rs139995318, rs141749783, rs4189, rs6480, rs5840847, and rs371194629 loci.
Based on the selected loci and its neighboring sequences, we used Primer 5.0 software to design the primers. Primers were synthesized by Microread Genetics Biotech Company (Beijing, China).
2.3 Multiplex amplification and InDels genotyping
PCR was performed in a 20 μl reaction volume containing 2 μl DNA template, 10 µl of 2 × Master mix, 2 µl of Primer mix, and 6 µl of nuclease-free water. The reaction condition was in accordance with the previous report (Jin et al., 2019). The PCR products were analyzed using an eight-capillary ABI Genetic Analyzer 3,500 (Applied Biosystems, Foster City, CA, USA). GeneMapper ID software v3.2 (Applied Biosystems, Foster City, CA, USA) was utilized to determine the allele genotype.
2.4 Statistical analyses
Modified Powerstats v1.2 was used to calculate the allelic frequencies, exact tests of Hardy-Weinberg equilibrium (HWE) and forensic parameters including observed heterozygosity (Ho), power of exclusion (PE), PIC, typical paternity index (TPI), match probability (MP) and power of discrimination (PD). He was performed using the formula as described by Nei (Nei, 1978). SNP Analyzer 2.0 (Yoo, Lee, Kim, Rha, & Kim, 2008) was utilized to evaluate Linkage disequilibrium (LD) for each pair of InDel loci. Nei's genetic distances (DA) were calculated by DISPAN program (http://www.personal.psu.edu/nxm2/software.htm). Pairwise fixation index (Fst) values were calculated using the Genepop v4.0.10 software (Rousset, 2008). STRUCTURE v2.3.4 software (http://web.stanford.edu/group/pritchardlab/structure.htm) was used to analyze differences in the ancestral components of various groups. In the meantime, the most appropriate K value was verified by online tool STRUCTURE HARVESTER (Earl & vonHoldt, 2012). Principal component analysis (PCA) plot at population level and a heatmap of insertion allelic frequencies was conducted with R software with own script based on insertion allelic frequencies of 35 InDel loci.
2.5 Reference populations
We downloaded population data of three Chinese groups including Chinese Dai in Xishuangbanna (CDX, n = 93), Han Chinese in Beijing (CHB, n = 103), Southern Han Chinese (CHS, n = 105) from 1,000 Genomes Project Phase 3 database (The 1000 Genomes Project Consortium, 2015) to evaluate the HID efficiency of 35 loci in these three populations. In the meantime, we selected 23 worldwide populations as reference populations from 1,000 Genomes Project Phase 3 database: Seven African (AFR) populations including African Caribbean in Barbados (ACB, n = 96), African Ancestry in Southwest US (ASW, n = 61), Esan in Nigeria (ESN, n = 99), Gambian in Western Division, The Gambia (GWD, n = 113), Luhya in Webuye, Kenya (LWK, n = 99), Mende in Sierra Leone (MSL, n = 85) and Yoruba in Ibadan, Nigeria (YRI, n = 108); five South Asian (SAS) populations including Gujarati Indian in Houston, TX (GIH, n = 103), Indian Telugu in the UK (ITU, n = 102), Sri Lankan Tamil in the UK (STU, n = 102), Punjabi in Lahore, Pakistan (PJL, n = 96) and Bengali in Bangladesh (BEB, n = 86); two East Asian (EAS) populations including, Kinh in Ho Chi Minh City, Vietnam (KHV, n = 99), and Japanese in Tokyo (JPT, n = 104); five European (EUR) populations including Utah residents with Northern and Western European ancestry (CEU, n = 99), Finnish in Finland (FIN, n = 99), British in England and Scotland (GBR, n = 91), Iberian populations in Spain (IBS, n = 107) and Toscani in Italy (TSI, n = 107); four American (AMR) populations including Colombian in Medellin, Colombia (CLM, n = 94), Mexican Ancestry in Los Angeles, California (MXL, n = 64), Peruvian in Lima (PEL, n = 85), and Puerto Rican in Puerto Rico (PUR, n = 104).
3 RESULTS
3.1 Evaluation of Hardy–Weinberg equilibrium and Linkage disequilibrium
In square grid graph, no deep red color was observed, revealing that any pairs of InDel loci showed linkage equilibrium and these loci could be regard as independent markers of each other in the following statistical analyses. After Bonferroni adjusting, all the loci conformed to Hardy–Weinberg equilibrium except for rs66502133 locus (p < .0001).
3.2 Allelic frequencies and forensic parameters in Chinese Hui group
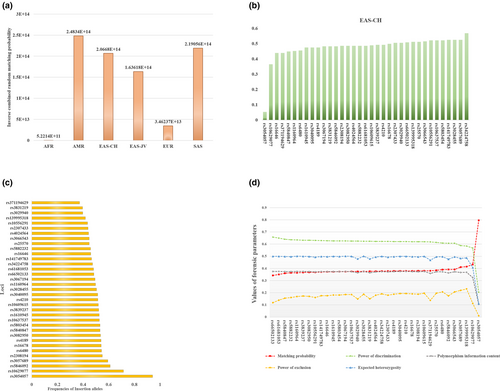
Diversities of allelic frequencies and forensic parameters of these 35 loci in Chinese Hui group were calculated, and the results were shown in Figure 1. The inverse cumulative random MP (CRMP) values based on 35 InDel loci in different intercontinental populations were shown in Figure 1a. The lowest inverse CRMP was found in African populations while inverse CRMP in other intercontinental populations were higher than 1013. In Chinese populations (EAS-CH, including CHB, CDX and CHS), the inverse CRMP was 2.0668 × 10¹⁴, that is, these InDel loci had relative low CRMP (CRMP = 4.8384 × 10⁻¹⁵) in these three populations, indicating that these 35 InDel loci were suitable for the individual identifications in these three populations. Ho values of Chinese three populations were shown in Figure 1b. Expect for rs3054057 and rs10629077 loci, Ho values of other 33 loci were higher than 0.4, which demonstrated that majority of loci had high polymorphisms in these three Chinese populations and could be used for the individual identifications. Insertion allelic frequencies of 35 InDel loci in studied Hui group were shown in Figure 1c. Almost all insertion allelic frequencies ranged from 0.4 to 0.6. Forensic parameters of 35 InDel loci in Chinese Hui group were shown in Figure 1d. The average values of MP, PD and PE were 0.3902, 0.6098 and 0.1718, respectively. Except for rs3054057, other loci have PIC values greater than 0.3, and the He values for these loci were close to 0.5. The combined PD (CPD) and PE (CPE) values were 0.99999999999999659609 and 0.998682, respectively.
3.3 Allelic frequency comparisons of 35 InDels between Chinese Hui group and other compared populations
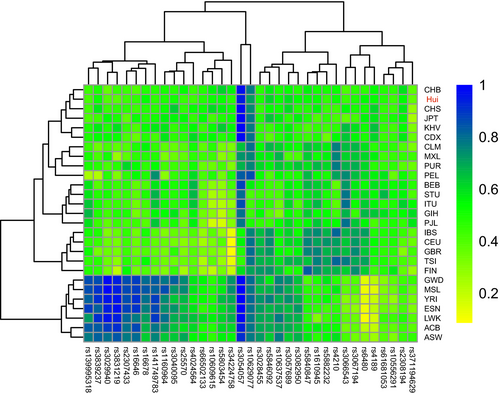
To show the distributions of allelic frequencies vividly, we conducted a heatmap with cluster analyses based on the insertion allelic frequencies of 35 InDel loci in 27 populations, and the heatmap was shown in Figure 2. The frequencies of insertion alleles were represented by squares of different shades of colors, where blue color indicated insertion allelic frequencies greater than 0.9 whereas yellow indicated insertion allelic frequencies below 0.2. As shown in Figure 2, insertion allelic frequencies of almost all InDel loci ranged from 0.4 to 0.6 in the East Asian populations. Cluster analyses of loci showed that all the loci could be divided into four main branches. From cluster analyses of populations, two main clusters could be observed in the heatmap. Seven African populations clustered together in the lower branch, with high insertion allelic frequencies at rs139995318, rs3839237, rs3029940, rs3831219, rs2307433, rs16646, rs16678, rs141749783, rs1160964, rs3040095, and rs25570 loci; In another branch, four subbranches could be recognized: five East Asian populations and studied Hui group clustered together, with high insertion allelic frequencies at rs3054057 and rs10629077 and moderate insertion allelic frequencies at the rest of loci; four American populations clustered in a subbranch; five South Asia populations clustered in the same subbranch, with high insertion allelic frequencies at rs3054057 and rs3066543 loci; five European populations clustered in the middle part of the heatmap, with high insertion allelic frequencies at rs5840487, rs1610945, rs5882232, rs4210, rs3066543, rs3067194, and rs6480 loci but a low insertion frequency at rs34224758. Relatively low insertion allelic frequencies were found in European populations at rs3054057 while other populations had high insertion allelic frequencies at this locus. The studied Hui group shared similar insertion allelic frequency distributions with East Asian populations and clustered closely with CHB, which indicated close genetic relationships between Chinese Hui group and East Asian populations.
3.4 Assessment of genetic distances and population genetic differentiations
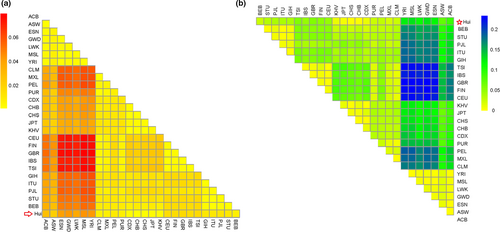
In this study, we calculated the genetic distances (DA) between Hui and other populations, and the relevant results were shown in Figure 3a. The lowest DA value was found between Hui and CHB (DA = 0.0010), followed by CHS (DA = 0.0015) and JPT (DA = 0.0026), indicating that the Hui had closer genetic affinities with East Asian populations in comparisons with other intercontinental populations. Fst is an index for evaluating the degree of variation between different populations. As shown in Figure 3b, the lowest Fst value was found between Hui and CHB (Fst = 0.0011), followed by CHS (Fst = 0.0028). Fang et al. (Fang et al., 2009) believed that the selected loci with high genetic polymorphisms and low population differentiations could be considered as a set of highly discriminative loci, which were suitable for human identifications in different populations. The genetic differentiations between Chinese Hui group and East Asian populations were relatively small, which might be one of the reasons why there were close genetic relationships between Chinese Hui group and East Asian populations.
3.5 PCA of Chinese Hui and other populations
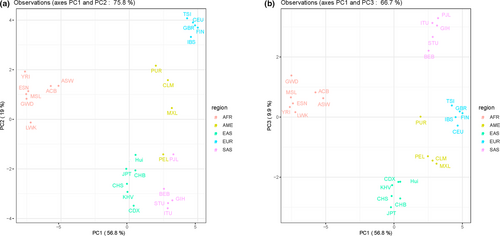
We conducted two PCA plots to explore the genetic relationships among these 27 populations based on the allelic frequencies. As shown in Figure 4, the first three components could explain a total of 85.7% variances. A PCA plot, as shown in Figure 4a, was conducted based on PC1 and PC2. We observed that the PC1 could separate seven African populations and East Asian populations (including Hui group) from other populations, and European populations could be separated in PC2. The Figure 4b was constructed on the basis of the PC1 and PC3. Significantly, PC3 could differentiate American populations (CLM, MXL and PEL), South Asian populations, six East Asian populations (containing Chinese Hui group). In Figure 4b, five clusters could be recognized apparently: seven African populations clustered in the left part of the plot; five South Asian populations clustered together and located on the upper right of the plot; five East Asian populations and Hui group clustered together and located on the bottom; five European populations located on the right part of the plot and American populations located between European and East Asian populations. The results of PCA plots indicated that this panel could differentiate these intercontinental populations. In addition, Chinese Hui group and five East Asian populations clustered together, indicating that these populations shared similar frequency distributions.
3.6 STRUCTURE analysis
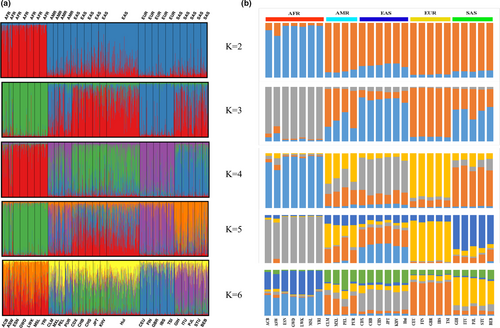
STRUCTURE is an effective software for ancestral information inference. By placing individuals into K different clusters based on the Bayesian algorithm (Rosenberg et al., 2002), the STRUCTURE can be used to calculate and estimate the ancestry ratios of various populations. Populations with similar ancestral components reflect a closer genetic affinity. Admixture analyses of Chinese Hui group and 26 reference populations at individual and population levels were conducted, respectively, assuming K = 2-6, as shown in Figure 5a,b. From individual level (Figure 5a), all African populations presented red ancestral component at K = 2. At K = 3, African, East Asian, and European populations could be separated from each other, with green, red and blue-based ancestral components, respectively. With the increase of K value, American and South Asian populations showed different ancestral components. From population level, at K = 3, seven populations from Africa shared the similar ancestry proportion (grey overwhelmingly). Five populations from Europe had orange-based ancestral components. East Asian populations and studied Chinese Hui group shared similar ancestral components (a mix of blue, grey and orange). According to the plot of Delta K conducted by STRUCTURE HARVESTER, the most appropriate K value was three. Although this novel panel was developed for the individual identifications for Chinese populations, the results mentioned above revealed that this panel could be used for ancestral inference among intercontinental populations to some extent. The Bayesian cluster analyses showed that there were similar ancestral components among East Asian populations and Hui group, indicated that there were close genetic relationships between Chinese Hui group and East Asian populations.
4 DISCUSSION
Since Weber et al. (Weber et al., 2002) first reported 2000 human biallelic InDels and emphasized the utilities of InDels for genetic researches, a great number of researches were published using InDels for all kinds of forensic purposes, such as ancestry inference (Zaumsegel, Rothschild, & Schneider, 2013), HID (Pereira et al., 2009) or genetic affiliations among different populations (Guo, Chen, Jin, et al., 2018). Though STR-based HID panels performed high discrimination power which were adequate for solving most forensic cases of individual identifivations, the high mutation rates and large amplification fragments still limited their applications in intractable samples. Thus, it was still requisite for developing InDel-based HID panels which were both high discrimination power and suitable for degraded samples. As mentioned hereinabove, a part of loci containing in the commonly used InDel individual identification kit—Qiagen Investigation® DIPplex kit—were observed low polymorphisms in Chinese populations, which made it unsuitable for the individual identifications of Chinese populations.
The purpose of present study was to evaluate the efficiencies of a novel InDel set for individual identifications in Chinese Hui group. Previously, we conducted a novel InDel-based HID panel including 35 loci that could be analyzed in a one-tube multiplex PCR amplification by capillary electrophoresis platform. When comparing the newly developed 35 InDel panel with the Qiagen Investigation® DIPplex kit, cumulative RMP values in EAS-CH populations including Chinese three populations were about three orders of magnitude lower in Xinjiang Uyghur (1.2 × 10⁻¹²) and Kazakh (1.43 × 10⁻¹²), and four orders of magnitude lower in Han (3.8 × 10⁻¹¹) and Tibetan group (1.66 × 10⁻¹¹) at 30 InDel loci (Wei et al., 2014). Xie et al. (Xie et al., 2018) calculated the CPD in Xinjiang Hui group (CPD = 0.99999999999378) based on the 30 InDel loci of Qiagen Investigation® DIPplex kit. Significantly, our new panel had a higher value of CPD. These results indicated that these 35 InDel loci had high genetic polymorphisms and their cumulative individual identification efficiency was higher than that of Qiagen Investigation® DIPplex kit, which was suitable for the applications of individual identifications. When we evaluated the performance of this panel in Chinese Hui group, we found all loci had high genetic polymorphisms except for rs3054057 locus. In further research, we wish that we could find more polymorphic loci to replace it. In present study, rs66502133 showed a deviation from HWE. After re-checking the genotyping technique system, no technical or typing errors were found. We considered that this phenomenon might be caused by the population stratification in the studied Hui group.
We also evaluated the genetic variations of these loci in five intercontinental populations (Africans, Europeans, East Asians, South Asians and Americans) utilizing Nei's genetic distances, Fst, PCA, and admixture analyses. Genetic distances are statistical parameters that are used to evaluate genetic differentiations among species or populations. Here we adopted Nei's DA distances, which assumed that genetic differences were due to mutation and genetic drift (Nei, Tajima, & Tateno, 1983; Takezaki & Nei, 1996), to estimate the genetic divergences among Chinese Hui and other reference populations. The relative lower DA values were found between the studied Hui group and East Asian populations, which indicated that the Chinese Hui group was closely related with East Asian populations. Fst is another index to measure the degrees of genetic affinities within and between populations. In our study, there were lower Fst values found among Hui and East Asian populations. The results of Fst and DA values demonstrated that there were close genetic relationships between Chinese Hui and East Asian populations.
PCA is a method for analyzing multivariate statistical distributions by feature quantity which summarizes complex multivariate into several principal components. At present, PCA is widely used to visualize genetic differentiations and relationships between populations. In our study, the cumulative contribution of the top three principal components was 85.7%, indicating that 85.7% of the variation among the populations could be explained by these three principal components. The results of PCA showed that populations from five intercontinental populations could be distinguished by top three principal components, and the Hui group clustered together with most East Asian populations, indicating that Chinese Hui group had close genetic affinities with East Asian populations.
The results of admixture analyses showed that this panel could be used for ancestral inference among intercontinental populations, although it was designed for individual identifications. Researchers regarded the loci showing significant allele frequency discrepancies between different populations as ancestry informative markers (AIM). As shown in heatmap of frequency, insertion allelic frequencies of some loci had variations among these populations and these loci could be characterized as AIM, for example, rs3054057 had high frequencies greater than 0.8 in East Asian and African populations but frequencies around 0.4 in European populations; rs3029940 and rs3831219 had frequencies around 0.8 in African populations while low frequencies were found in other populations. The existence of AIM might result in ancestry inference efficiency at admixture analyses and clustering results in the PCA plots.
The results of DA, Fst, PCA, and admixture analyses also supported closer genetic affinities between Chinese Hui and East Asian populations, which gained supports from published reports and related historical records. Related researches showed that Hui group had closer genetic relationships with the local Han nationality. For example, Xie et al. (Xie et al., 2018) evaluated the genetic relationships among Hui group and other 25 populations based on 30 InDel loci. And they found Xinjiang Hui group had closer genetic affinities with most Chinese populations than other populations; Lan et al. (Lan et al., 2018) found that Xinjiang Hui group had close genetic relationships with Chinese Han populations from different regions. Interestingly, researchers found that 93.3% of the mitochondrial haplogroups in Xinjiang Hui group belonged to the East Asian specific haplogroups (Wang, Zhu, Kong, Zhang, & Yao, 2004), which might be the result of the maternal contribution of the Han population in the marriage between the Hui group and the Han population. Moreover, analyses of Y chromosome haplogroups revealed that the origin of Hui group had involved massive assimilation of indigenous East Asians (Wang et al., 2019). The published results indicated that frequent gene exchanges have existed between the Han population and the Hui group during a long period of history. According to related history research of Hui group, many researchers believed that ancestors of modern Hui group were Muslim believers coming from Arab, Persia and Central Asian during the Tang Dynasty and Song Dynasty. The marriages between the Hui group and the Han population were very common during Ming Dynasty. Hui group had marriage custom that they usually practice endogamy. However, a number of Han women converted to Muslim when they married to Hui males (Gladney, 1998; Wang et al., 2019). Marriage and residence with the Han populations for a long time made close genetic affinities between Hui group and Han population (Neaman Lipman, 2001).
5 CONCLUSION
At present, we evaluated the forensic application performance of novel 35 InDel loci in Hui group and investigated genetic relationships among Chinese Hui group and reference populations. The forensic statistical analyses revealed these loci showed relatively high genetic polymorphisms in Chinese Hui group and could be served as a tool in the aspect of individual identifications in Hui group. Population genetics evaluations indicated that Chinese Hui group had close genetic relationships with East Asian populations.
ACKNOWLEDGMENTS
This study was supported by National Natural Science Foundation of China (NSFC, 81525015) and Guangdong Province Universities and Colleges Pearl River Scholar Funded Scheme (GDUPS, 2017).
CONFLICTS OF INTEREST
The authors stated that they had no conflicts of interest.


