LINC00355 promotes gastric carcinogenesis by scaffolding p300 to activate CDC42 transcription and enhancing HNRNPA2B1 to stabilize CDC42 mRNA dependent on m6A
Hui Chen and Lanshu Xiao contributed equally.
Abstract
LINC00355 is involved in the tumorigenesis of several types of cancer. We verified that LINC00355 is upregulated in gastric cancer (GC) and contributes to GC cells' proliferation and metastasis. RNA sequencing (RNA-seq) and rescue assays suggested that LINC00355 controls gastric carcinogenesis by regulating the expression of cell division cycle 42 (CDC42) guanosine triphosphatase (GTPases), thereby activating their downstream pathways. Most previous studies have shown that LINC00355 acts as a ceRNA by sponging miRNAs to modulate downstream gene expression. Our group focus on epigenetic regulatory potential of LINC00355 in gene expression. Mechanistically, LINC00355 binds to p300 histone acetyltransferase, specifying the histone modification pattern on the CDC42 promoter to activate CDC42 transcription, thereby altering GC cell biology. In addition, HNRNPA2B1, which is upregulated by LINC00355, recognizes the N6-methyladenosine (m6A) sites of CDC42 and enhances the stability of CDC42 mRNA transcripts. Therefore, LINC00355 is mechanistically, functionally, and clinically oncogenic in GC cells.
Abbreviations
-
- ANOVA
-
- one-way analysis of variance
-
- BLAST
-
- Basic Local Alignment Search Tool
-
- CCK8
-
- Cell Counting Kit-8
-
- CDC42
-
- cell division cycle 42
-
- ChIP
-
- chromatin immunoprecipitation
-
- CLIP
-
- crosslinking immunoprecipitation
-
- DAB
-
- 3,3'-Diaminobenzidine
-
- DEGs
-
- differentially expressed genes
-
- DIG
-
- digoxin
-
- DMEM
-
- Dulbecco's modified Eagle's medium
-
- DMSO
-
- dimethyl sulfoxide
-
- FACS
-
- Fluorescence Activated Cell Sorting
-
- FBS
-
- fetal bovine serum
-
- GC
-
- gastric cancer
-
- GEO
-
- Gene Expression Omnibus
-
- GSEA
-
- Gene Set Enrichment Analysis
-
- GTPases
-
- guanosine triphosphatase
-
- H. pylori
-
- Helicobacter pylori
-
- HAT
-
- histone acetylase
-
- HRP
-
- Horseradish Peroxidase
-
- ISH
-
- in situ hybridization
-
- KEGG
-
- Kyoto Encyclopedia of Genes and Genomes
-
- LncRNA
-
- long noncoding RNA
-
- m6A
-
- N6-methyladenosine
-
- NCBI
-
- National Center for Biotechnology Information
-
- NES
-
- normalized enrichment score
-
- OS
-
- overall survival
-
- PBS
-
- phosphate-buffered saline
-
- PPI
-
- protein-protein interaction
-
- qRT-PCR
-
- quantitative reverse transcription-polymerase chain reaction
-
- RIP
-
- RNA immunoprecipitation
-
- RNA-seq
-
- RNA sequencing
-
- RNU1
-
- small nuclear RNA U1
-
- TCGA
-
- The Cancer Genome Atlas
-
- TSA
-
- trichostatin A
-
- UV
-
- ultraviolet
1 INTRODUCTION
Gastric cancer (GC) remains an important cancer worldwide and is responsible for over 1 million new cases in 2020 and an estimated 769,000 deaths, ranking fifth in incidence and fourth in mortality globally.1 Rates are twofold higher in men than in women. It is the most commonly diagnosed cancer in men and the leading cause of cancer-related deaths in several South-Central Asian countries, including Iran, Afghanistan, Turkmenistan, and Kyrgyzstan.1 The incidence rates are the highest in Eastern Asia and Eastern Europe.1 Differences in dietary patterns, food storage, availability of fresh produce, and prevalence of Helicobacter pylori (H. pylori) infection contribute to regional variations. Chronic H. pylori infection is the strongest risk factor for GC, with approximately 90% of new cases of non-cardia GC worldwide attributed to this bacterium.2
The past decade has seen significant progress in chemotherapy, radiotherapy, and surgical techniques for GC treatment; however, the survival rate of patients with GC remains unsatisfactory.3 With a lack of appropriate molecular biomarkers and poor compliance with gastroscopy results in most patients with GC being diagnosed at an advanced stage, missing the best opportunity for curative surgery. The mechanism of gastric carcinogenesis is complicated and poorly understood and is influenced by H. pylori, genetic factors, and epigenetic mechanisms.4, 5 Thus, it is imperative to decipher the different mechanisms involved in the progression of GC. The discovery of novel molecular markers is critical for the early detection and prognostic prediction of this disease.
Long noncoding RNAs (lncRNAs) are a heterogeneous class of transcripts with a minimum length of 200 bases and limited protein-coding potential.6, 7 The abundant and diverse lncRNAs in the cell execute a variety of regulatory roles at different stages of gene expression, including sensory, guiding, scaffolding, and allosteric capacities.8, 9 Numerous lncRNAs bind to chromatin-modifying proteins and recruit their catalytic activity to specific sites in the genome, thus modulating chromatin states and impacting gene expression.8, 9 Considering this regulatory potential in combination with the abundance of lncRNAs suggests that lncRNAs may be part of a broad epigenetic regulatory network.8, 10, 11
Accumulating evidence has demonstrated that lncRNAs are dysregulated in GC, and their aberrant expression is associated with tumorigenesis, metastasis, diagnosis, or prognosis.12-20 LINC00355 has been demonstrated to be involved in the tumorigenesis and progression of various tumors.21-41 Most studies have shown that LINC00355 acts as a ceRNA by sponging miRNA to modulate the expression of downstream genes.22, 27, 31 More specific mechanisms of LINC00355, which is also found to be enriched in the nucleus, may include chromatin interactions, transcriptional regulation, and RNA processing. In GC it has been shown that LINC00355 promotes proliferation and invasion through TP53 and wnt/β-catenin. Here, we identified another novel cell cycle regulatory pathway of LINC00355 and how it regulates N6-methyladenosine (m6A) modification to promote proliferation and migration of GC.
In this study, we investigated LINC00355 expression in gastric tumors and paired adjacent normal tissues and confirmed that LINC00355 was upregulated in gastric tumors and that its expression was associated with the prognosis of patients with GC. In addition, we determined that LINC00355 was upregulated in the serum of patients with GC compared to healthy controls, indicating that LINC00355 could act as a serological marker for GC. The role of LINC00355 in GC proliferation, cell cycle progression, and metastasis was assessed in vitro and in vivo. The molecular mechanisms underlying LINC00355 regulation in GC were explored. Mechanistically, RNA sequencing (RNA-seq) combined with integrative analysis revealed that LINC00355 regulated the transcription of cell division cycle 42 (CDC42) by recruiting histone acetylase (HAT) p300 to the CDC42 promoter. In addition, HNRNPA2B1, which is upregulated by LINC00355, recognized the m6A sites of CDC42 and enhanced the stability of the CDC42 mRNA transcript. LINC00355 controls gastric carcinogenesis by promoting the expression of CDC42 guanosine triphosphatase (GTPases), thereby activating the downstream pathways. Thus, our study demonstrates that LINC00355 has biological, mechanistic, and clinical effects on human GC.
2 MATERIALS AND METHODS
2.1 Patient specimens
All GC specimens were obtained from patients who underwent surgical resection. Informed consent was obtained before the surgeries were performed at the Xinhua Hospital, Shanghai Jiao Tong University School of Medicine (Shanghai, China) between 2016 and 2021. Primary tumor and adjacent nontumor tissues were collected from each patient and validated by pathological examination. Twenty paired gastric tumor and adjacent normal tissues were prepared for in situ hybridization (ISH), whereas 53 paired tissues were frozen immediately after collection for RNA extraction. LINC00355 fold enrichment in paired GC tumor tissue and normal tissue was calculated by the 2−Δ(ΔCt) method, where ΔCt = Ct (LINC00355)–Ct (ACTIN) and Δ(ΔCt) = ΔCt (Paired Tumor tissue) – ΔCt (normal tissue). The study protocol conformed to the ethical guidelines of the 1975 Declaration of Helsinki and was approved by the Institutional Review Board and Ethics Committee of Xinhua Hospital (XHEC-NSFC-2018-057).
2.2 Cell lines and culture conditions
Six GC cell lines (BGC-823, SGC-7901, MGC-803, HGC-27, MKN-45, and AGS) derived from gastric tumors, one cell line derived from normal epithelial cell of human gastric mucosa (GES-1), and one cell line derived from fetal kidney (HEK-293T) used in this investigation were purchased from the Chinese Academy of Sciences Cell Bank of Type Culture Collection. Cell lines were cultured in Dulbecco's modified Eagle's medium (DMEM; Hyclone, USA) supplemented with 10% fetal bovine serum (FBS; Gibco, USA), 100 U/ml penicillin, and 100 μg/mL streptomycin. All cell lines were maintained at 37°C in a humidified incubator with 5% CO2.
2.3 Cell transfection
Cell transfection was performed using LipofectamineTM 3000 Transfection Reagent (Invitrogen, USA) according to the manufacturer's protocol. The concentrations used for siRNA/smart silencing and vector transfection into GC cell lines were 50 nM and 2 μg/ml, respectively.
2.4 Treatment with trichostatin A (TSA) or C646
We used HDAC inhibitor TSA or p300 inhibitor C646 to treat GC cells and investigated whether H3K27Ac modification in the vicinity of CDC42 promoter could regulate CDC42 transcription. Cell lines were treated with 0.3 μM TSA (Sigma-Aldrich, USA) for 24 h, or 10 μM/20 μM C646 (Selleck, USA) for 24 h. Cell lines treated with dimethyl sulfoxide (DMSO; Sigma-Aldrich, USA) were used as controls. All experiments were repeated at least thrice.
2.5 RNA extraction and quantitative reverse transcription-polymerase chain reaction (qRT-PCR)
Total RNA was extracted with TRIzol@ reagent (Invitrogen, USA) according to the manufacturer's instructions. The concentration and quality of total RNA were assessed using a Nanodrop Spectrophotometer (NanoDrop 2000c, Thermo Fisher Scientific, USA).
Reverse transcription was performed in 10 μl reaction volume using PrimeScript RT master mix (TaKaRa, Japan) with a total of 0.5 μg of RNA. Gene expression was detected by qRT-PCR using a 7900 HT Real-Time PCR System (Applied Biosystems, USA) and SYBR green dye (Takara, Japan), according to the manufacturer's protocols. The amplified transcript levels of each specific gene were normalized to those of ACTIN. The 2–ΔΔct calculation method was used to analyze the relative expression levels. The primers (Supporting Information: Table S1) used for the experiments were provided by Biosune (Shanghai, China). All experiments were repeated at least thrice.
2.6 Western blot
Forty-eight hours after transfection, cell lysates were collected and separated on an 8%–10% gel by SDS-PAGE and then transferred to a 0.2-μm PVDF membrane (Bio-Rad, USA). After blocking with Odyssey Blocking Buffer (Li-COR Biosciences, USA), the membrane was incubated with the primary antibody (1:1000) at 4°C overnight, followed by incubation with IRDye 800CW or 680 secondary antibodies (1:5000, LI-COR Biosciences, USA). ACTIN was used as the endogenous control. The Odyssey Infrared Imaging System was used to visualize the target protein bands. The CDC42, ACTIN, P27, and Cyclin D1 antibodies used in Western blot are listed in Supporting Information: Table S2. All experiments were repeated at least thrice.
2.7 RNA Immunoprecipitation (RIP)
RIP experiments were performed using a Magna RIPTM RNA-binding Protein Immunoprecipitation Kit (Millipore, USA). The anti-p300 antibody and m6A antibody used for RIP were purchased from Cell Signaling Technology (Danvers, MA, USA). The HNRNPA2B1 antibody used for RIP was purchased from Proteintech (USA). Co-precipitated RNAs were detected by qRT-PCR. Normal rabbit IgG was used as a control. The specific primers used to detect LINC00355 and CDC42 are listed in Supporting Information: Table S1. All experiments were repeated at least thrice.
2.8 ISH
The in situ detection of LINC00355 was performed on 6-μm formalin fixed, paraffin-embedded sections using digoxin (DIG)-labeled LINC00355 Detection probe (Shenggong, China). The gene specific probe for LINC00355 was 5‘-GCTCCACCATACCGGCAAGTCCCAAGT-3.' After the tissue paraffin sections were dewaxed, they were digested with Proteinase K, and endogenous peroxidase was blocked with 3% methanol-H2O2. DIG-labeled RNA probe was added for hybridization and normal rabbit serum was used for blocking following pre-hybridization. Finally, anti-DIG- Horseradish Peroxidase (HRP) was added and incubated overnight. Fresh 3,3'-Diaminobenzidine (DAB) was added for color development. Automated image acquisition was performed using an AperioScanScope XT slide scanner with a 20× objective (Aperio Technologies).
2.9 Cell viability and adhesion-dependent colony formation assay
Control and treated GC cells were seeded in 96-well plates at 1500–3000 cells/well for 5 d and cell viability was detected using a Cell Counting Kit-8 (CCK8) (Dojindo Laboratories, Japan). The optical density at 450 nm was measured to determine cell viability at 24-h intervals.
Control and treated GC cells were plated in 60-mm dishes at a density of 0.5–1 × 10⁴ cells per well for the adhesion-dependent colony formation assay. G418 (Life technology, USA) was added to the culture medium to a final concentration of 0.6–1.2 mg/ml. The culture medium containing G418 was changed every 3–4 d. Then to 3–4 weeks later, the remaining colonies were fixed with 4% paraformaldehyde and stained with crystal violet. Colonies were counted according to defined colony sizes. All experiments were repeated at least thrice.
2.10 Cell cycle and cell apoptosis analysis
Forty-eight hours after transfection, the cells were harvested, and cell cycle distribution analysis was performed using a BD Fluorescence Activated Cell Sorting (FACS) Canto II Flow cytometry system (BD Biosciences, USA) using the BD Cycletest Plus DNA Reagent Kit (BD Biosciences, USA). All data were analyzed using FlowJo7.6.1 software. All experiments were repeated at least thrice.
Forty-eight hours after transfection, the cells were collected and cell apoptosis analysis was performed using a BD FACS Canto II Flow cytometry System (BD Biosciences, USA) with an Annexin V-PE Apoptosis Detection Kit (BD Biosciences, USA), according to the manufacturer's protocol. All data were analyzed using FlowJo7.6.1 software. All experiments were repeated at least thrice.
2.11 In vitro cell migration assay
The cell migration assay was performed on 24-well Transwell inserts with 8-μm sized pores (BD Biosciences). Twenty-four hours after transfection, the control and treated GC cells were trypsinized and washed thrice with DMEM with 1% FBS. Next, 1 × 10⁵ cells were suspended in 500 μl DMEM with 1% FBS and added to the upper chamber, and 750 μl DMEM with 10% FBS and 10 μg/ml fibronectin (BD Biosciences, USA) was placed in the lower chamber as a chemoattractant. After 48 h of incubation, the cells remaining in the upper chamber were removed using flat-bottomed cotton swabs. The cells on the lower surface of the chamber were fixed with 4% paraformaldehyde and stained with 0.5% crystal violet. At least six random microscopic fields (magnification, ×200) were photographed and the cells were counted. All experiments were repeated at least thrice.
2.12 In vivo tumorigenicity
Xenograft mouse tumor model was established by inoculating MKN-45 cells transfected with LV Sh355 lentivirus or control LV ShNC lentivirus (2 × 10⁶ in 200 μl sterile 1×phosphate-buffered saline [PBS]) subcutaneously into the right armpit of 5–6-week-old male BALB/c nude mice (Shanghai Experimental Animal Center, China). Tumor formation kinetics were estimated by measuring the tumor size at 3–4-d intervals. A digital caliper was used to measure tumor size, and tumor volume was calculated using the following formula: volume = 0.5 × width2 × length. After euthanasia, the tumors were collected and weighed.
GC pulmonary metastatic model was established by injecting MKN-45 cells transfected with LV Sh355 lentivirus or control LV ShNC lentivirus (2 × 10⁶ in 200 μl sterile 1 × PBS) into the caudal vein of 5–6-week-old male BALB/c nude mice (Shanghai Experimental Animal Center, China). The survival times of the two groups were recorded. One month after injection, mouse was injected with a corresponding amount of 15 mg/ml d-Luciferin (Yeasen, China) solution, 10 µl/g of body weight. Imaging analysis was performed 10–15 min after the intraperitoneal injection.
All animal procedures were approved by the Institutional Committee of Shanghai Jiao Tong University School of Medicine for Animal Research.
2.13 Immunofluorescence assay
Phalloidin binds to F-actin with high selectivity. We stained the cells with phalloidin to visualize changes in polymerized actin. Alexa Fluor 488 phalloidin (Invitrogen, USA) was used to analyze the F-actin content in GC cells according to the manufacturer's protocol. The stained cells were observed under a Leica TCS SP5 confocal microscope (Leica microsystems, Germany).
2.14 SiRNAs, smart silencer, plasmids, and lentivirus construction
All the siRNAs were designed and synthesized by GenePharma (Shanghai, China). The LINC00355 smart silencer (SL355 and SLNC as controls) was provided by the RiboBio Company (Guangzhou, China). Vectors GV146-LINC00355 (NCBI Reference Sequence: NR_145420.1), GV362-CDC42 (NCBI Reference Sequence: NM_001791.4), GV248-SH355-1, GV248-SH355-2, and GV344-LV Sh355 were constructed by GeneChem (Shanghai, China). The siRNA sequences and targets of GV248-SH355-1 and GV248-SH355-2 are listed in Supporting Information: Tables S3 and S4, respectively. GV248-SH355-1 and GV248-SH355-2 vectors were constructed to knock down LINC00355 expression.
2.15 Luciferase reporter assay
A luciferase reporter assay was performed using the Luciferase Assay System (Promega, USA) according to the manufacturer's instructions, and luciferase activity was detected using a Glomax 20/20 luminometer (Promega, USA). A 2000-bp sequence from −2000 bp to 0 bp upstream of the CDC42 transcription initiation site was cloned into the PGL3-basic vector (Promega, USA) between the XhoI and HindIII sites upstream of the firefly luciferase gene. The recombinant plasmids were confirmed through sequencing. All experiments were repeated at least thrice.
2.16 RNA-seq
RNA-seq analysis was performed to compare the gene expression profiles of MKN-45 cells transfected with LINC00355 siRNA (Si355-1) and control siRNA (SiNC). Total RNA from MKN-45 cells (SiNC/Si355-1, each group with three replicates) was isolated using the TRIzol reagent (Thermo Fisher Scientific, USA) 48 h after transfection and purified using the RNeasy Mini Kit (Qiagen, Germany). Library construction and high-throughput transcriptome sequencing were performed at the BGI Genomics Corporation (Shenzhen, China) using an MGISEQ-2000 (BGI, China) to screen for differentially expressed genes (DEGs), followed by computational analysis. Specific analysis process is as follows. Use the filtering software SOAPnuke to filter the sequencing data to obtain Clean reads, then use HISAT to compare Clean reads to the reference genome sequence; Use Bowtie2 to compare Clean reads to the reference sequence, and then use RSEM to calculate the expression levels of genes and transcripts. The criteria for DEGs were defined as p < 0.05, fold change >1.5, or fold change <−1.5. Then we used BGI Dr. Tom data analysis and mining platform (BGI, China), a web-based solution for the convenient analysis, visualization, and interpretation of transcriptome, lncRNA, and miRNA, and so on, to cluster the expression of the DEGs, map protein-protein interaction (PPI) network regulation, plot the Kyoto Encyclopedia of Genes and Genomes (KEGG) Pathway annotation classification, and functionally classify the DEGs according to the GO annotation results and the official classification.
2.17 Chromatin immunoprecipitation (ChIP)
ChIP assays were performed using the EZ-ChIP assay (Millipore, Billerica, MA, USA). The cells were crosslinked with 1% formaldehyde at room temperature for 10 min and quenched with glycine. DNA was immunoprecipitated from sonicated cell lysates and quantified using SYBR Green (Takara, Japan) in an ABI 7900HT Fast Real-Time PCR System (Applied Biosystems, USA). The H3K27Ac and p300 antibodies used for ChIP were purchased from Cell Signaling Technology (Danvers, MA, USA). Primer sequences for ChIP (CDC42PR5 F/R, CDC42RP9 F/R, and CDC42PR12 F/R) are listed in Supporting Information: Table S1. Fold enrichment was calculated using the 2−Δ(ΔCt) method, where Δ Ct = Ct (IP) − Ct (Input) and Δ (ΔCt) = Δ Ct (antibody) − Δ Ct (IgG).
2.18 Triplex pulldown assay
An in vitro triplex pulldown assay was performed according to a previously described method.42 A -1647 to -1535 bp sequence of CDC42 promoter DNA was synthesized using PCR with genomic DNA as the template and purified with a DNA Purification Kit (Beyotime Biotechnology, China). A biotinylated sequence ranging 957–1069 bp of LINC00355 was generated through in vitro transcription (Takara, Japan). RNA–DNA complexes were isolated using Pierce Nucleic-Acid Compatible Streptavidin Magnetic Beads (Thermo scientific, USA). Poly(A)25 RNA was used as a negative control. The recovered DNA was used for qPCR analysis and normalized to input DNA.
2.19 Crosslinking Immunoprecipitation (CLIP) assay
CLIP qRT-PCR assays were performed using a CLIP-qPCR kit from Bersin Bio (Guangzhou, China). The cells were crosslinked under 256 nm ultraviolet (UV) irradiation on ice for 10 min. RNA was immunoprecipitated from cell lysates and quantified using SYBR Green (Takara, Japan) in an ABI 7900HT Fast Real-Time PCR System (Applied Biosystems, USA). The m6A and HNRNPA2B1 antibodies used for the CLIP assays were purchased from Cell Signaling Technology (USA) and Proteintech (USA), respectively. The primer sequences for CLIP (M246 F/R, M406/427 F/R, and M505 F/R) are listed in Supporting Information: Table S1. Fold enrichment was calculated using the 2−Δ(ΔCt) method, where Δ Ct = Ct (IP) – Ct (Input) and Δ (ΔCt) = Δ Ct (antibody) − Δ Ct (IgG).
2.20 Bioinformatics analysis
The expression data of LINC00355 in GC and normal gastric tissues were obtained from The Cancer Genome Atlas (TCGA). Gene Set Enrichment Analysis (GSEA) was performed using GSEA software. The top 32 and bottom 32 gastric tissues from the public data set (GSE65801) were scored according to LINC00355 expression for GSEA. Kaplan-Meier analysis of the overall survival (OS) of patients with GC was conducted based on LINC00355 levels (data from TCGA and Gene Expression Omnibus [GEO] datasets) using GraphPad Prism software.
2.21 Statistical analysis
Statistical significance between groups was determined using two-tailed Student's t-test and one-way analysis of variance (ANOVA). All statistical data were analyzed using GraphPad Prism software (version 5.0) and are displayed as means ± standard deviation (SD) from at least three independent experiments, unless otherwise stated. Statistical significance was set at p < 0.05.
3 RESULTS
3.1 LINC00355 is highly expressed in GC tissues and serum from patients with GC
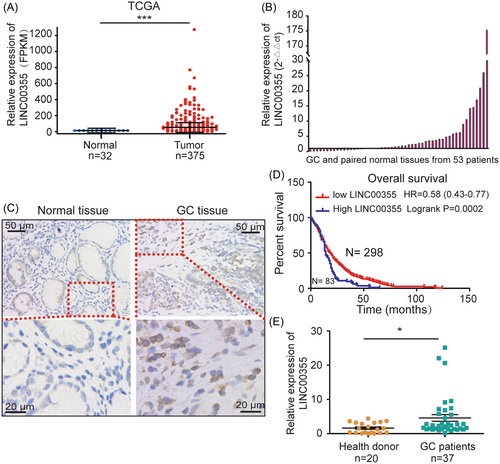
To identify LINC00355 expression in gastric tumors, TCGA data set was selected for LINC00355 level evaluation in GC and paired adjacent normal tissues. LINC00355 was significantly upregulated in gastric tumors compared to paired adjacent normal tissues (logFC 5.187, p = 9.65E-10) (Figure 1A, Supporting Information: Table S5). We confirmed this result by analyzing LINC00355 levels using qRT-PCR and ISH in GC and paired adjacent normal tissues collected from Xinhua Hospital (Figure 1B, C). Kaplan-Meier analysis of OS in the LINC00355 high and low groups showed that higher LINC00355 expression in patients with GC was correlated with shorter survival times according to TCGA data (p < 0.01, Figure 1D, Supporting Information: Table S6). LINC00355 was significantly increased in the serum of patients with GC compared with healthy controls by qRT-PCR (p < 0.05, Figure 1E), indicating that LINC00355 in the serum may be used as a marker for the diagnosis of GC. Further research on this topic will be conducted in the future. Through comparison with the Basic Local Alignment Search Tool (BLAST), it was determined that the 1210 bp–1572 bp of LINC00355 cDNA was highly conserved in Sumatran orangutans, chimpanzees, and other mammals (Supporting Information: Figure S1), indicating that they play important roles in biological development. These data demonstrated that LINC00355 was abundant in GC and serum as has been shown previously.
3.2 LINC00355 enhanced GC cell proliferation and migration in vitro and in vivo
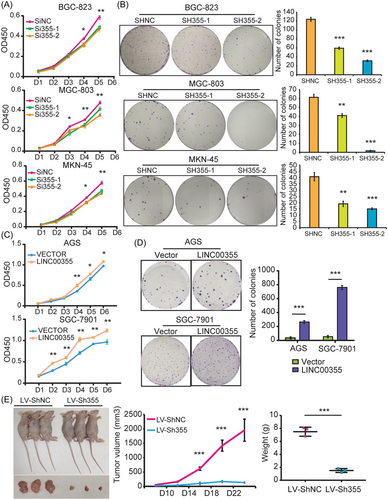
To test the biological function of LINC00355 in gastric carcinogenesis, we transfected LINC00355 siRNAs (Si355-1 and Si355-2) or shRNA (SH355-1 and SH355-2) into the GC cell lines BGC-823, MGC-803, and MKN-45 (Supporting Information: Figure S2B and S2C). All three cell lines expressed high levels of LINC00355 (Supporting Information: Figure S2A). The results showed the depletion of LINC00355 significantly impaired GC cell proliferation and colony formation in BGC-823, MGC-803, and MKN-45 cells (Figure 2A, B). Knockdown of LINC00355 dramatically reduced tumor growth and weight in xenograft mouse tumor models in vivo (p < 0.01, Figure 2E). In accordance with this, overexpression of LINC00355 promote GC cell proliferation and colony formation in AGS and SGC-7901 cells (Figures 2C, D, and Supporting Information: S2D). These data suggest that LINC00355 may be an oncogenic lncRNA in GC that is associated with GC proliferation as has been shown previously.
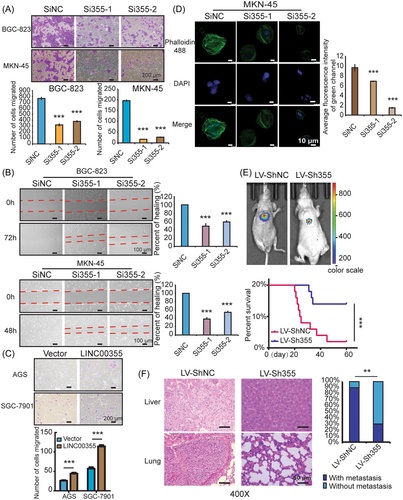
Next, we examined the effect of LINC00355 on GC migration and metastasis. Transwell migration and wound healing assays showed that the depletion of LINC00355 significantly reduced the migration ability of GC cells (p < 0.01, Figure 3A, B). LINC00355 overexpression increased the migration of SGC-7901 and AGS cells in vitro (p < 0.01, Figure 3C). In addition, the F-actin clumps in the cells were significantly weakened after LINC00355 knockdown (p < 0.01, Figures 3D and Supporting Information: S3A), which indicated that LINC00355 may regulate the migration of GC cells by regulating F-actin remodeling. Cytoskeletal F-actin remodeling is closely associated with tumor metastasis. In a GC pulmonary metastatic model, mice inoculated with LV-Sh355-expressing tumor cells had a longer OS time than mice that received control LV-ShNC-expressing tumor cells (p < 0.01, Figures 3E and Supporting Information: S2E). There were fewer metastatic foci in the lungs and livers of nude mice after the injection of GC cells infected with LV-Sh355 than in the control groups (p < 0.01, Figures 3F and Supporting Information: S3B). We verified that LINC00355 promoted GC progression by regulating GC cell proliferation and migration in vitro and in vivo as has been shown previously.
3.3 LINC00355 regulated the G1-S transition of the cell cycle
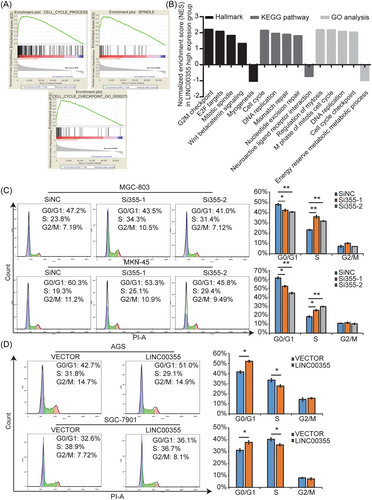
To explore the mechanism by which LINC00355 regulates cell proliferation, we performed GSEA using public datasets (GSE65801), which showed that high LINC00355 expression was positively associated with the cell cycle, G2/M checkpoint, cell cycle progression, DNA replication, mitosis, mitotic spindles, and E2F targets (Figure 4A, B). Subsequently, we used FACS to analyze the effects of LINC00355 knockdown or overexpression on GC cell cycle progression. The results showed that siRNA-mediated LINC00355 knockdown significantly promoted the G1-S transition in MGC-803 and MKN-45 cells, whereas ectopic LINC00355 expression delayed the G1-S transition in AGS and SGC-7901 cells (Figure 4C, D). We determined that cell cycle genes being regulated by LINC00355 in GC including P27 and CCND1 (Supporting Information: Figure S3C), as previously described.28 FACS analysis indicated that LINC00355 did not affect the apoptosis of GC cells (Supporting Information: Figure S4). Collectively, it was determined that LINC00355 could regulate cell cycle progression by influencing the G1-S transition in GC cells.
3.4 LINC00355 affects GC cell proliferation and migration by regulating CDC42 expression
To elucidate the molecular mechanism of the role that LINC00355 plays in GC tumorigenesis, an RNA-seq analysis was performed to compare the gene expression profiles of MKN-45 cells transfected with Si355-1 and control SiNC. A total of 366 downregulated and 458 upregulated genes (≥1.5-fold) were detected after LINC00355 knockdown (Figure 5A, Supporting Information: Table S7). Raw RNA-seq data were accessible through the National Center for Biotechnology Information (NCBI) website (PRJNA936628). The PPI network indicated that CDC42 may be a critical downstream effector of LINC00355 in GC (Figure 5B). KEGG pathway classification and enrichment revealed that cell growth and death, cell cycle, cell motility, tight junctions, and cancers, correlated with LINC00355, which is in accordance with the functional analysis of LINC00355 (Supporting Information: Figure S5A and S5B). Ten significantly downregulated genes (SDHD, PDIA3, SERINC3, MAP4K2, CHERP, HOXA7, GSR, CDC42, LBR, and HNRNPAB) and three significantly upregulated genes (PCNX3, GANAB, and TPM4) detected using RNA-seq were randomly selected and confirmed using real-time qRT-PCR (Figure 5C). All of these genes were associated with cancer. The consistency between the results of RNA-seq and qRT-PCR indicates the reliability of high-throughput sequencing and bioinformatics analysis. The Smart Silencer against LINC00355 (SL355) from RiboBio also decreased the expression of CDC42 (p < 0.01, Supporting Information: Figure S6A). Analysis using GENEPIA2 (http://gepia2.cancer-pku.cn/#index) showed that CDC42 was not only upregulated in GC samples but was also associated with poor outcomes (http://kmplot.com/analysis/index.php?p=service) (Figures 5D and Supporting Information: S5C). As a member of the Rho GTPase family, CDC42 has been reported to act as a key regulator of GC cell proliferation, migration, and invasion43, 44 and has been demonstrated to be involved in the adherens junctions and tight junctions of KEGG pathways associated with cell proliferation and migration (Supporting Information: Figure S7A and S7B), which is consistent with LINC00355 function in GC. However, the correlation and regulation of LINC00355 and CDC42 have not yet been reported.
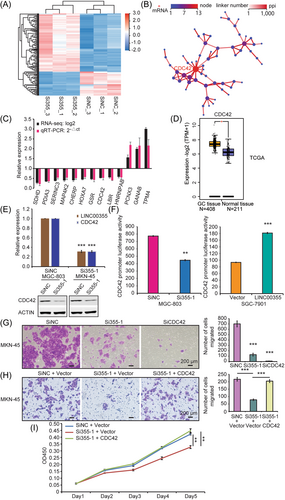
Western blot confirmed that the siRNA-mediated LINC00355 knockdown significantly reduced CDC42 expression (p < 0.01, Figure 5E). Luciferase reporter assays showed that LINC00355 regulates CDC42 expression by manipulating its promoter. Moreover, the CDC42 promoter was repressed (approximately 45%) according to luciferase activity in MGC-803 cells cotransfected with LINC00355 siRNA (p < 0.01, Figure 5F). In contrast, cotransfection of LINC00355 with the CDC42 promoter construct led to an almost 2-fold increase in luciferase activity compared to that in the control (p < 0.01, Figure 5F). We confirmed that knockdown of CDC42 with siRNA (SiCDC42) markedly attenuated GC cell migration (p < 0.01, Figures 5G and Supporting Information: S6B). In addition, ectopic expression of CDC42 in LINC00355 silencing cells could reverse the migration and proliferation of MKN-45 cells (p < 0.01, Figures 5H, I and Supporting Information: S6C). To the best of our knowledge, this is the first study to show that LINC00355 regulates GC cell proliferation and migration by regulating CDC42 GTPase expression.
3.5 LINC00355 regulates CDC42 transcription by interacting with p300 epigenetic modification complex
The subcellular locations of lncRNAs determine their molecular functions. We used ACTIN and small nuclear RNA U1(RNU1) as controls for cytoplasmic and nuclear RNA, respectively. LINC00355 was predominant in the nucleus like RNU1 (p < 0.01, Figures 6A and Supporting Information: S6D), which is consistent with a previous report.24 Nuclear LncRNAs can function by interacting with chromatin-modifying complexes, histone regulators, transcriptional factors, and other cellular factors.42, 45-48 As shown in Figure 5F LINC00355 can enhance CDC42 expression by manipulating its promoter. To further explore the molecular mechanism by which LINC00355 enhances carcinogenesis in GC, we sought to determine whether LINC00355 could bind to epigenetic regulators. TSA treatment induced CDC42 expression in both BGC-823 and MKN-45 cells (p < 0.01, Figure 6B). In addition, C646, a specific p300 HAT inhibitor, attenuated CDC42 expression in HGC-27, MGC-803, and MKN-45 cells (p < 0.01, Figure 6C).
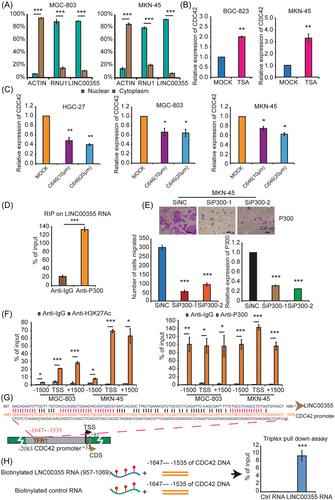
The Layered H3K27Ac tracks from the ENCODE project on the UCSC genome browser showed enrichment of the H3K27Ac histone mark across the genome, as determined by a ChIP-seq assay.49 This showed that the area around the CDC42 promoter was marked by the H3K27Ac modification (chr1:22,051,201–22,054,200) (Supporting Information: Figure S6E). H3K27ac is related to gene activation, mainly concentrated in the enhancer and promoter regions.50 Acetylation of H3K27 is almost exclusively acetylated by CBP/p300.51 Thus, we hypothesized that LINC00355 may regulate CDC42 expression by recruiting p300. We used an online algorithm RPISeq52 to predict the binding ability of LINC00355 to p300. Using the EZH2-HOTAIR interaction pair as a positive control (interaction ability=0.75), we determined that the LINC00355-p300 interaction pair had a higher score of 0.85. Another online algorithm, catRAPID, was used to confirm the prediction results.53 Then RIP was performed using an antibody against p300, which showed significant enrichment of LINC00355 compared with the nonspecific IgG control antibody (p < 0.01, Figure 6D). Furthermore, we showed that p300 depletion significantly reduced the migration ability of GC cells (p < 0.01, Figure 6E). ChIP-qPCR was performed on the CDC42 promoter in MGC-803 and MKN-45 GC cell lines using H3K27ac and p300 antibodies. The results indicated that H3K27Ac and p300 (responsible for the acetylation of H3K27) were enriched in the CDC42 promoter (Figure 6F). Alignment between the LINC00355 and CDC42 promoters using BLAST (https://blast.ncbi.nlm.nih.gov/Blast.cgi) indicated that the 957-1069 sequence of LINC00355 could pair with the -1647- −1535 sequence of the CDC42 promoter, suggesting that LINC00355 may form a DNA-RNA triple strand structure with the CDC42 promoter (Figure 6G). Furthermore, an in vitro triplex pull-down assay was performed to verify that the 957–1069 sequence of LINC00355 could pair with the −1647 to −1535 sequence of the CDC42 promoter to demonstrate that LINC00355 may form a DNA-RNA triple strand structure with the CDC42 promoter (p < 0.01, Figure 6H). In addition, we used the LongTarget online service to analyze lncRNA/DNA binding between LINC00355 and the CDC42 promoter and identified other possible binding sites between LINC00355 and the CDC42 promoter. The predicted binding motifs and their binding sites are referred to as TFO and TTS, respectively. Supporting Information: Figure S6F shows the distribution of the LINC00355 TTSs in the CDC42 promoter region.
These results implied that LINC00355, acting as an oncogenic lncRNA, enhanced CDC42 transcription by combining with the CDC42 promoter to form a DNA-RNA triple strand structure and recruit p300, which mediates H3K27ac modification.
3.6 HNRNPA2B1 could promote CDC42 expression through m6A-dependent stabilization of CDC42 mRNA
Correlation analysis using GENEPIA2 (http://gepia2.cancer-pku.cn/#index) showed a correlation between HNRNPA2B1 and LINC00355 (Figure S8B). M6A modification is the most frequent RNA modification in eukaryotic RNAs affecting gene expression.54 HNRNPA2B1 has been demonstrated to be a nuclear reader of m6A, which is highly expressed in several cancers and participates in regulating cancer progression through multiple processes of mRNAs metabolism, including alternative splicing, cytoplasmic RNA trafficking, transcription, translation, and mRNA stability.55-58 HNRNPA2B1 is generally overexpressed in GC, controlling alternative splicing of antiapoptotic factor BIRC5 and promoting GC progression.59, 60 Our results demonstrated that HNRNPA2B1 was also significantly reduced after LINC00355 depletion using siRNA (Si355-1) (p < 0.01, Figure 7A). GENEPIA2 analysis showed that HNRNPA2B1 was upregulated in GC samples and associated with poor outcomes (http://kmplot.com/analysis/index.php?p=service) (p < 0.05, Figure 7B, C). Correlation analysis using GENEPIA2 revealed a correlation between HNRNPA2B1 and CDC42 (p < 0.01, Supporting Information: Figure S8A). In this study, we explored the potential functions and regulatory mechanisms of HNRNPA2B1 in GC and CDC42 expression.
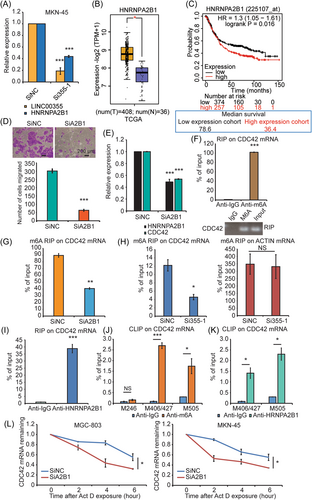
Migration assay was performed to examine the effect of HNRNPA2B1 on GC migration. The results showed that depletion of HNRNPA2B1 with siRNA (SiA2B1) significantly reduced the migratory ability of GC cells (p < 0.01, Figure 7D). Knockdown of HNRNPA2B1 markedly downregulated the CDC42 expression (p < 0.01, Figure 7E). RIP and qRT-PCR analyses detected m6A modification of CDC42 mRNA (p < 0.01, Figure 7F) and revealed that CDC42 mRNA was downregulated of m6A in HNRNPA2B1 knockdown GC cells compared to that in controls (p < 0.01, Figure 7G). Furthermore, the m6A modification of CDC42 mRNA was reduced when LINC00355 was downregulated by Si355-1 (p < 0.05, Figure 7H). RIP qRT-PCR using the HNRNPA2B1 antibody demonstrated that HNRNPA2B1 bound to CDC42 mRNA (p < 0.01, Figure 7I). We then used an online sequence-based m6A modification site predictor (SRAMP) to predict the m6A modification sites on the CDC42 mRNA. Nineteen m6A sites were predicted; seven sites with very high or high confidence are shown in Figure S8C. The CLIP assay was used to demonstrated that m6A modification at the M406/427 and M505 sites of CDC42 mRNA and that HNRNPA2B1 could bind to these two sites (Figure 7J, K). After adding actinomycin D, qRT-PCR was performed to demonstrate the decreased stability of CDC42 mRNA after downregulation of HNRNPA2B1 and m6A modification on CDC42 in GC cells (p < 0.05, Figure 7L).
To date, CDC42 m6A modification and its relationship with HNRNPA2B1 have not been reported. Based on the above results, we speculated that LINC00355 induced CDC42 expression by promoting HNRNPA2B1 expression, and that HNRNPA2B1 enhanced the stability of CDC42 mRNA transcripts upon recognition and binding to m6A sites.
4 DISCUSSION
Multiple molecular pathways are involved in GC carcinogenesis.20, 61, 62 Understanding the gene expression profile and identifying abnormally expressed genes in GC will contribute to its diagnosis and therapeutic intervention of gastric cancer. LncRNAs have been demonstrated to play a critical role in cancer by functioning as oncogenes63-65 or tumor suppressors.66, 67 Numerous dysregulated lncRNAs have been reported in GC and are involved in tumorigenesis, metastasis, invasion, drug resistance, stem cell progression, and immune escape.20, 47, 68-73 LncRNAs are emerging as a new class of promising biomarkers for the diagnosis and prognosis of GC and as therapeutic targets for GC precision medicine.72, 74, 75 However, the functions and mechanisms of most lncRNAs remain to be clarified.
Through analysis of TCGA data set, we determined that LINC00355 was aberrantly upregulated in gastric tumors, which was confirmed using GC samples collected from our hospital. LINC00355 expression in patients with GC was correlated with shorter survival times according to Kaplan-Meier analysis of OS. Downregulation of LINC00355 significantly suppressed cell growth and metastasis, both in vitro and in vivo. Thus, these data confirm that high LINC00355 expression contributes to GC aggressiveness.
RNA-seq analysis showed that CDC42 is involved in the molecular mechanism by which LINC00355 promoted gastric carcinogenesis. CDC42 is a small GTPase that has been linked to multiple human cancers, cell cycle progression, tumor growth, migration/invasion, tumor growth, and angiogenesis.76 Usually, CDC42 in cancer is overexpressed or hyperactivated, including GC, targeting Rac, and CDC42 represents a promising strategy for precise cancer therapy.77-79 Consistent with these reports, our results showed that LINC00355 could promote CDC42 transcription, and CDC42 is functionally responsible for LINC00355 mediated GC carcinogenesis. The involvement of other genes in LINC00355-associated biological functions cannot be ruled out, because LINC00355 may be linked to gene regulatory networks. More work needs to be done to better understand all gene regulatory networks.
Most lncRNAs are located in the nucleus and exert their biological function by binding to RNA-binding proteins such as PRC2,68, 80, 81 WDR547, and p300.82 RIP experiments demonstrated that LINC00355 directly interacts with p300. Protein p300 can acetylate histones through its inner HAT activity, which results in chromatin remodeling and the accessibility of transcription factors to DNA templates.83, 84 Moreover, a luciferase reporter assay and qRT-PCR confirmed that LINC00355 could regulate CDC42 expression through its promoter. We propose a model in which LINC00355 guides chromatin-modifying complexes, including p300, to the CDC42 promoter to epigenetically regulate transcription. In addition, the nuclear reader of m6A HNRNPA2B1, upregulated by LINC00355, could bind to the m6A sites of CDC42 to enhance its stability and increase the expression of CDC42 mRNA (Supporting Information: Figure S9). However, the mechanism by which LINC00355 regulates HNRNPA2B1 remains to be illustrated.
5 CONCLUSIONS
Because of the role of LINC00355 in GC, we concluded that LINC00355 and its associated pathways are important for gastric carcinogenesis and progression and that targeting this pathway may be crucial for GC treatment.
AUTHOR CONTRIBUTIONS
Lisong Shen, Hui Chen, and Yi Liu conceived the project and led the execution of all experiments, data analysis, and manuscript production. Lanshu Xiao and Hui Chen collected and handled the GC tissue samples. Yi Liu and Peng Zhang performed bioinformatics and statistical analyses. Lanshu Xiao and Guohua Xie performed the experiments and acquired and analyzed the data.
ACKNOWLEDGMENTS
The authors acknowledge the families and patients who contributed to this study. This project was support by grants from the National Natural Science Foundation of China (grant numbers: 81874152, 81903038, 81402332, 81072009, 81372641, and 81772525) to Lisong Shen, Hui Chen, Yi Liu, and Xiangliang Yuan, Shanghai Key Clinical Specialty Construction Project (grant number: shslczdzk03304) to Lisong Shen, Youth Medical Talents (Clinical Laboratory Practitioners Program) of Shanghai “Rising Stars of Medical Talent” Youth Development Program to Hui Chen in 2018, and the Shanghai Sailing Program (grant number 19YF1432700) to Yi Liu. We would like to thank Editage (www.editage.cn) for English language editing.
CONFLICT OF INTEREST STATEMENT
The authors declare no conflict of interest.
Open Research
DATA AVAILABILITY STATEMENT
The data that supports the findings of this study are available in the supplementary material of this article. TCGA data used are publicly available.


