YTHDF1 enhances stemness and chemoresistance in triple-negative breast cancer cells by upregulating SIAH2
Anhao Wu, Xi Wang, and Fang Zhang contributed equally to this study.
Abstract
Triple-negative breast cancer (TNBC) is the most lethal and aggressive subtype of breast cancer, and chemoresistance is the major determinant of TNBC treatment failure. This study explores the molecular mechanism of TNBC chemoresistance. The Cancer Genome Atlas, breast cancer integrative platform, and GEPIA databases were used to analyze the expression and correlation of YTHDF1 and seven in absentia homology 2 (SIAH2) in breast cancer. Knockdown of YTHDF1 and SIAH2, or overexpression of SIAH2 in vitro and in vivo, was conducted to evaluate the impact of changes in YTHDF1 and SIAH2 expression on TNBC cell proliferation, apoptosis, stemness, drug resistance, and Hippo pathway gene expression. YTHDF1 and SIAH2 were highly expressed in breast cancer patients and TNBC cells. Knockdown of YTHDF1 and SIAH2 significantly inhibited proliferation and stemness and promoted apoptosis and chemosensitivity of TNBC cells. Mechanistically, the knockdown of YTHDF1 inhibited the expression of SIAH2, thereby downregulating the Hippo pathway, which inhibited proliferation and stemness and promoted apoptosis and chemosensitivity of TNBC cells. The current findings revealed the regulatory mechanism of YTHDF1 in TNBC and clarified the role of the YTHDF1/SIAH2 axis in TNBC drug resistance and stemness. This could provide new insights into the vital role of targeting YTHDF1/SIAH2 to suppress drug resistance and stemness in TNBC cells.
1 INTRODUCTION
Triple-negative breast cancer (TNBC) is considered to be the most lethal and aggressive subtype of breast cancer (BC).1, 2 The lack of human epidermal growth factor 2 (HER2) gene amplification and progesterone receptor (PR) and estrogen receptor (ER) expression in TNBC renders TNBC insensitive to hormones and anti-HER2-targeted therapy.3, 4 Therefore, the treatment of TNBC is mainly based on surgical resection combined with radiotherapy and/or chemotherapy. Currently, taxanes or platinum salts are the most commonly used chemotherapeutic drugs in clinical practice.5 Unfortunately, many patients develop chemoresistance due to the adaptive and rapid acquisition of chemoresistance characteristics of TNBC cells. Therefore, understanding the key molecules involved in the process of TNBC development and chemoresistance to taxanes or platinum salts can contribute to the clinical development of effective therapies for treating TNBC patients.
N 6-methyladenosine (m6A) is the most common and abundant posttranscriptional modification in RNA.6, 7 The m6A is catalyzed by a multicomponent protein complex including methyltransferases (METTL3, METTL14, and KIAA1429), demethylases (FTO and ALKBH5), and m6A-binding proteins (YTHDF1-3, YTHDC1, and YTHDC2).8 Studies have found that the upregulation of YTHDF1 promotes tumorigenesis and metastasis, which is related to poor prognosis of various tumors.9, 10 In addition, the upregulation of YTHDF1 promotes the stemness features and chemotherapy resistance of tumor cells.11, 12 However, the role of YTHDF1 in TNBC is currently unclear.
Seven in absentia homology 2 (SIAH2) is a subtype of the SIAH family protein, and studies have confirmed that SIAH2 promotes tumor progression through multiple pathways.13, 14 Meanwhile, the inhibition of SIAH2 improves the chemosensitivity of tumor cells.14 Large tumor suppressor 1/2 (LATS1/2) is a key component of the Hippo pathway. LATS1/2 is phosphorylated when the Hippo pathway is activated, and the phosphorylated LATS1/2 phosphorylates and inactivates the oncoprotein YAP, thereby inhibiting cell growth and tumorigenesis. Notably, SIAH2 can activate YAP by binding to LATS2 and promoting the degradation of LATS2 to guarantee the continued survival and growth of tumor cells under hypoxic conditions.15, 16 However, the effect of SIAH2 on TNBC via LATS2 is unclear.
In the current study, we found that YTHDF1 and SIAH2 were highly expressed in TNBC and were shown to played key roles in TNBC stemness and chemoresistance in vitro and in vivo. Interestingly, it was also found that YTHDF1 regulated stability of YAP and LATS2 expression by regulating SIAH2. Collectively, this study provides new insights into the potential of YTHDF1 and SIAH2 as a biomarker and a therapeutic target for TNBC development and chemoresistance.
2 MATERIALS AND METHODS
2.1 Cell culture and transfection
All cell lines (MCF-10A, nontumorigenic breast epithelial cell line: Cat. No. CRL-10317; MCF-7, hormone receptor-positive [ER+] breast cancer cell line: Cat. No. HTB-22; HCC-1806, TNBC cell line [ER-/PR-/HER2-]: Cat. No. CRL-2335; MDA-MB-231, TNBC cell line [ER-/PR-/HER2-]: Cat. No. HTB-26 and HCC1937, TNBC cell line [ER-/PR-/HER2-]: Cat. No. CRL-2336) used in this study were purchased from American Type Culture Collection and validated by short tandem repeat analysis. All cell lines were cultured in 1640 medium (Cat. No. 11875093; Gibco; Thermo Scientific) or L-15 medium (Cat. No.25030081; Gibco) with 10% fetal bovine serum (Cat. No. FSP500; ExCell Bio Co., Ltd.), 1% penicillin/streptomycin (Cat. No. 15140163; Thermo Fisher Scientific, Inc.) at 37°C under a humidified atmosphere with 5% CO2. Cell transfection and drug treatment were performed when the cells reached a confluence of 80%. All experiments were performed with mycoplasma-free cells.
sh-YTHDF1, sh-SIAH2, and negative control lentiviruses were purchased from HanHeng Trading Co. Ltd. pcDNA-YTHDF1 (1680bp), pcDNA-SIAH2 (975 bp), and pcDNA empty vector and corresponding lentiviruses were also purchased from HanHeng Trading Co. Ltd. Plasmid DNA was transfected using Lipofectamine 2000 (Cat. No. 11668019; Thermo Fisher Scientific) according to the manufacturer's instructions. Lentiviruses were added to MDA-MB-231, HCC-1806, and HCC-1973 cells. After infection for 48 h, cells were selected with 2 μg/mL puromycin (Sigma) to obtain stably transfected cells. Detection was performed by RT-qPCR and western blot analysis.
2.2 Cell viability assay
The CCK8 assay was employed to determine the viability of HCC-1806, HCC-1937, and MDA-MB-231 cells treated with Paclitaxel (PTX; Cat. No. 21122511; purchased from Yangze River Pharmacy Company) and Cisplatin (DDP; Cat. No. 3A0045B02; purchased from Qilu Pharmaceutical Co., Ltd.) for 24 h (PTX and DDP were individually dissolved in DMSO), and transfected with sh-YTHDF1, sh-SIAH2, and pcDNA-SIAH2 lentiviruses for 48 h. Briefly, 2 × 10³/mL suspended cells were seeded in 96-well plates and were treated. Next, 10 μL of Cell Counting Kit-8 (Cat. No. CK04; Dojindo Molecular Technologies) was added into every well for another 1 h following the manufacturer's protocol. The absorbance was measured at 450 nm using an enzyme-linked immunometric meter (Thermo Scientific).
2.3 Western blot analysis assay
Cells (MCF-10A, MCF-7, HCC-1806, HCC-1937 and MDA-MB-231 cells without any treatment, and HCC-1806, HCC-1937, MDA-MB-231 cells transfected with sh-YTHDF1, sh-SIAH2 and pcDNA-SIAH2 for 48 h or treated with PTX and DDP for 24 h) and tissues proteins were extracted in 1x RIPA lysis buffer (Cat. No. R0278; Sigma-Aldrich), Protein concentration was determined by Bio-Rad protein assay reagent (Cat. No. 5000006). The proteins were separated by 10% SDS-polyacrylamide gel and transferred to polyvinylidene fluoride membranes (Merck Millipore). The membranes were incubated overnight with primary antibody, followed by incubation with secondary antibodies. Antibodies are as follow: YTHDF1 (1:2000; Cat. No. ab230330; Abcam; 61KDa), SIAH2 (1:2000, Cat. No. ab230523; Abcam; 34KDa), YAP (1:2000, Cat. No. ab230523; Abcam; 72KDa), LATS2 (1:1000, Cat. No. ab243657; Abcam; 140KDa), β-actin (1:2000, Cat. No. ab8226; Abcam; 42KDa).
2.4 Apoptosis assay
HCC-1806, HCC-1937, and MDA-MB-231 cells transfected with sh-YTHDF1, sh-SIAH2 and pcDNA-SIAH2 for 48 h or treated with PTX, DDP for 24 h were collected. Analyze cell apoptosis with Annexin V-FITC/PI Apoptosis Kit (Cat. No. G1511-50T; KeyGEN, BioTECH) was performed in accordance with the manufacturers' instructions. Briefly, all cells were incubated in 500 μL binding buffer containing Annexin V-FITC (5 μL)-PI (5 μL) at room temperature for 15 min (in the dark). The number of apoptotic cells was detected by a flow cytometer (FACScan; BD Biosciences). The analysis was replicated thrice and the percentage of cells in the upper right (representing late apoptotic cells) and lower right quadrants (representing early apoptotic cells) were summed to obtain the apoptosis rate for HCC-1806, MDA-MB-231 cells.
2.5 ALDH analysis
The Assay Kit (Cat. No. 01711; Stemcell Technologies) was employed to determine the ALDH activity of HCC-1806, HCC-1937, and MDA-MB-231 cells. These cells were either transfected with sh-YTHDF1, sh-SIAH2, and pcDNA-SIAH2 for 48 h or treated with PTX and DDP for 24 h. Briefly, treated cells were resuspended in Aldefluor assay buffer containing the ALDH substrate for 45 min at 37°C. Cells incubated with diethylaminobenzaldehyde served as a negative control. The ALDH-positive cell population was detected by a flow cytometer (FACScan; BD Biosciences).
2.6 Mammosphere formation assay
A Mammosphere Culture Kit (Cat. No. 05620; Stemcell Technologies) was utilized for conducting the mammosphere assay. To initiate the formation of spheres, HCC-1937 cells (HCC-1937 cells transfected with sh-YTHDF1 and sh-SIAH2 lentiviruses for 48 h) were enzymatically dissociated into individual cells and seeded onto 24-well ultralow attachment plates (Cat. No. 3473) at a density of 1000–2000 cells per well. The cells were cultured in 500 μL of complete MammoCult medium (Cat. No. 05620; Stemcell Technologies). Following a 7-day incubation period, the mammospheres >50 μm were photographed and counted using inverted microscope.
2.7 RNA extraction and qRT-PCR
Total RNA was extracted from differently treated HCC-1806, MDA-MB-231, and HCC-1937 cells using TRIzol reagent (Cat. No.15596026; Thermo Fisher Scientific Inc.), and the absorbance and concentration of RNA were detected by a spectrophotometer. Next, the cDNA First Strand Synthesis Kit (Cat. No. RR036A; TaKaRa) was used to synthesize cDNA. the SYBR Green PCR Kit (Cat. No. RR420L; TaKaRa) was used to qRT-PCR. GAPDH was used as an internal reference, and the method was used to calculate the relative quantification of the target gene.
2.8 Immunohistochemical assay
Protein expression of Ki67 was evaluated by IHC. Briefly, paraffin tissue samples were sectioned at the thickness of 5 μm, dehydrated. Next, treated with 3% H2O2 solution at room temperature for 10 min and blocked with normal goat serum. The sections were incubated with the primary antibodies (anti-Ki67, 1:200 abcam) at 4°C overnight. Followed by incubation with secondary antibodies. Stained images were obtained using a microscope after sections were counterstained with hematoxylin and dehydrated.
2.9 Xenograft tumor model
Female nude mice (6–8 weeks) were purchased from SJA Laboratory Animal Co., Ltd. The animal protocol was approved by the animal ethics committee of Kunming Medical University (Kmmu20220280). A total of 88 nude mice were subcutaneously injected into the mammary gland fad pads with HCC1806 cells (1 × 10⁶) transfected with the corresponding lentiviruses of sh-NC, sh-YTHDF1-1#, sh-YTHDF1-2#, sh-SIAH2-1#, sh-SIAH2-2#, pcDNA3.1-vector, pcDNA3.1-YTHDF1 (n = 8 mice each). Mice weight were measured every 5 days, tumor size was measured every 4 days, and the tumor volume was calculated using the following equation: volume = (length × width2)/2. After 30 days of injections, all the mice were killed, and the tumors were weighted.
When treated with PTX and DDP (PTX and DDP were individually dissolved in DMSO), the tumor volume reached approximately 50 mm3 (6 days), the mice were intraperitoneally injected with PTX (1 mg/kg, twice a week) and DDP (1 mg/kg, twice a week)17 and DMSO as a control for 4 weeks. After 34 days, all the mice were killed, and the tumors were weighted.
2.10 Database analysis
TCGA (The Cancer Genome Atlas; https://www.cancer.gov/ccg/research/genome-sequencing/tcga) database and GEPIA (gene expression profiling interactive analysis; http://gepia.cancer-pku.cn/) database was interrogated for YTHDF1 mRNA and SIAH2 mRNA expression in breast cancer samples (n = 1085) and normal mammary tissues (n = 291). The correlation between YTHDF1 and SIAH2 was analyzed in the BCIP (breast cancer integrative platform; http://www.omicsnet.org/bcancer/) database, and the expression of YTHDF1 and SIAH2 in TNBC tissues after postneoadjuvant chemotherapy (NCT) was detected.
2.11 Statistical analysis
All data were presented as mean ± SD. t-test, one-way analysis of variance (ANOVA) and two-way ANOVA were used to compare cells and animals with different treatments. A value of p < 0.05 or p < 0.01 were considered as statistically significant.
3 RESULTS
3.1 Expression and correlation of YTHDF1 and SIAH2 in breast cancer patients
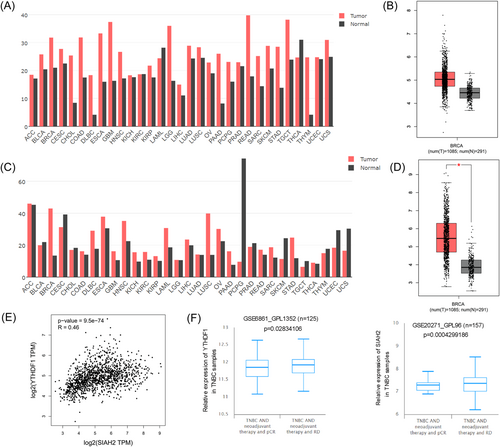
We assessed YTHDF1 and SIAH2 expression in the TCGA, BCIP, and GEPIA database. The results showed that YTHDF1 and SIAH2 are highly expressed in BRCA (breast cancer) tissues compared to normal tissues (Figure 1A–D, and Supporting Information S1: Figure S1A,B). Meanwhile, we found that YTHDF1 and SIAH2 expression is positively correlated in BRCA tissues, R = 0.46, p = 9.5e-74 (Figure 1E). In addition, comparing the expression of YTHDF1 and SIAH2 before and after treatment, clinically, analysis of a cohort (GSE6861_GPL1352 and GSE20271_GPL96) expectedly showed that YTHDF1 and SIAH2 expression in samples from basal-like breast cancer (BLBC) patients with pCR post-NCT was lower than that of BLBC patients with residual disease post-NCT (Figure 1F).
3.2 Expression and regulation of YTHDF1 and SIAH2 in TNBC cells
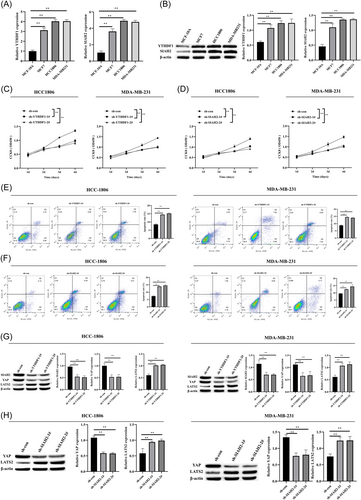
To examine the role of YTHDF1 and SIAH2 in the breast cancer cells, we detected the expression of YTHDF1 and SIAH2 in breast cancer cells and found that the expression of YTHDF1 and SIAH2 was the highest in TNBC cells (Figure 2A,B). Thus, we used MDA-MB-231 and HCC-1806 cell lines to knockdown YTHDF1 and SIAH2 with sh-RNA (Supporting Information S1: Figures S2A–D, S3A–D). knockdown of YTHDF1 and SIAH2 inhibited MDA-MB-231, HCC-1806 cell proliferation and promoted apoptosis (Figure 2C–F). Simultaneously, we also determined knockdown of YTHDF1 downregulated the expression level of SIAH2 (Figure 2G). Hippo-YAP pathway is strongly associated with breast cancer, and upregulation of protein levels and activities of YAP/TAZ promotes breast cancer proliferation, metastasis, and EMT.18 Remarkably, SIAH2 promotes tumor cell survival and growth by activating YAP.15 Thus, we examined whether the effects of YTHDF1 and SIAH2 in breast cancer cells were related to the Hippo-YAP pathway. Western blot analysis analysis showed that the YAP expression level was significantly reduced and the LATS2 expression level was significantly increased when YTHDF1 and SIAH2 were knocked down (Figure 2G,H).
3.3 Effect of YTHDF1 on TNBC cell stemness through SIAH2
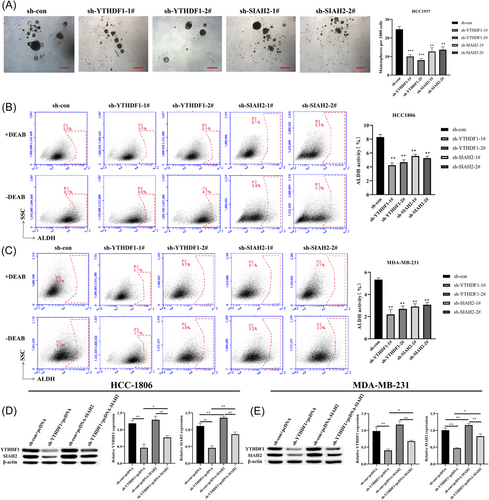
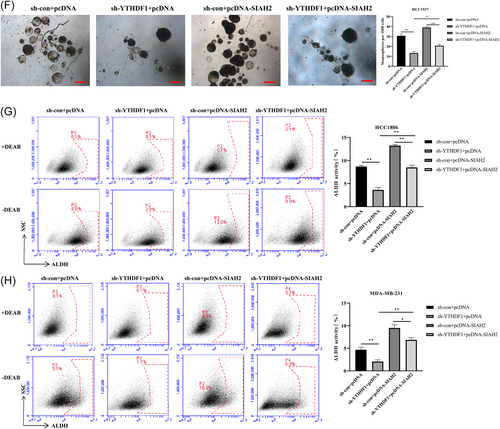
Previous study has reported that YTHDF1 is involved with cancer stemness in human colorectal cancer model.19 Thus, to examine whether YTHDF1 mediates breast cancer cell stemness by regulating SIAH2, we transfected MDA-MB-231, HCC-1806 and HCC-1937 cells (Due to the lower sphere-forming ability of HCC1806 and MDA-MB-231, we choose HCC1937 to do the sphere formation experiment) with sh-RNA lentiviruses of YTHDF1 and SIAH2 (Supporting Information S1: Figure S4A–D) and grew them under spheroid-formation conditions. The results showed that transfection of sh-YTHDF1 and sh-SIAH2 in cells resulted in a reduction in the number of mammosphere compared to control cells (Figure 3A). In addition, we found that YTHDF1 and SIAH2 were highly expressed in HCC-1937 cells compared with MCF-10A cells, knockdown of YTHDF1 and SIAH2 downregulated the expression levels of YTHDF1 and SIAH2 in HCC-1937 cells, and inhibited HCC-1937 cells proliferation and promoted apoptosis (Supporting Information S1: Figure S5A–D). Meanwhile, the proportion of subpopulation of cells expressing ALDH+ cells in MDA-MB-231, HCC-1806, and HCC-1937 cells transfected with sh-YTHDF1 and sh-SIAH2 were significantly lower than that in the control group (Figure 3B,C and Supporting Information S1: Figure S5H). We then further transfected MDA-MB-231, and HCC-1806 cells with pcDNA-SIAH2 and sh-YTHDF1 (Figure 3D and Supporting Information S1: Figure S6). Overexpression of SIAH2 in HCC-1937 cells resulted in increases number of mammosphere compared to that in the transfection of sh-YTHDF1 cells (Figure 3E). In addition, the subpopulations of ALDH+ cells were significantly increased in MDA-MB-231, HCC-1806, and HCC-1937 cells with SIAH2 overexpression (Figure 3F,G and Supporting Information S1: Figure S5I). These results indicated that YTHDF1 promotes the stemness of cells through SIAH2.
3.4 Effect of YTHDF1 and SIAH2 on drug resistance of TNBC cells
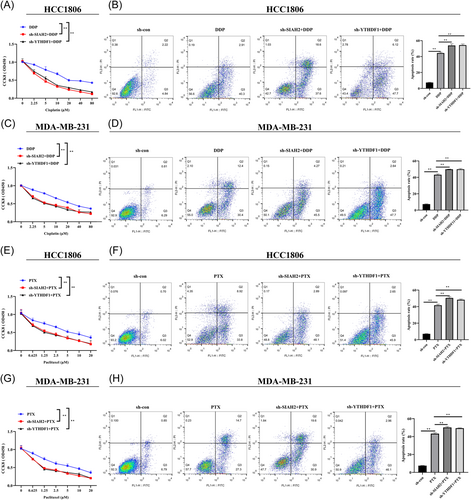
Next, to investigate the potential implication of YTHDF1 and SIAH2 in therapy resistance, DDP, and PTX were applied to measure the influence of YTHDF1 and SIAH2 on chemotherapy sensitivity of MDA-MB-231 and HCC-1806. The results revealed that the viabilities of MDA-MB-231 and HCC-1806 cells transfected with sh-YTHDF1 and sh-SIAH2 after treatment with DDP (treat cells for 24 h) and PTX (treat cells for 24 h) were significantly lower than that of the control group (Figure 4A,C,E,G). In addition, Transfection of sh-YTHDF1 and sh-SIAH2 increased the sensitivity of MDA-MB-231 and HCC-1806 cells to DDP (10 μM; 24 h) and PTX (2.5 μM; 24 h). Inhibition of YTHDF1 and SIAH2 promoted the apoptotic rate of MDA-MB-231 and HCC-1806 cells (Figure 4B,D,F,H).
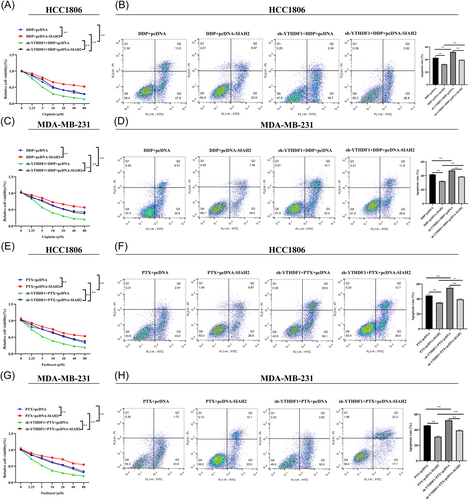
We further overexpressed SIAH2 in YTHDF1-knockdown MDA-MB-231 and HCC-1806 cells to detect the chemosensitivity of cells to DDP and PTX. The results showed that overexpression of SIAH2 in MDA-MB-231 and HCC-1806 cells led to increased cell survival, while decreased cell apoptosis compared with sh-YTHDF1 transfection group and SIAH2 empty (control) group (Figure 5A–H). The data suggested that YTHDF1 contributes to chemoresistance and SIAH2 appears to be part of the mechanism.
3.5 Effect of YTHDF1 and SIAH2 on tumorigenicity in animals
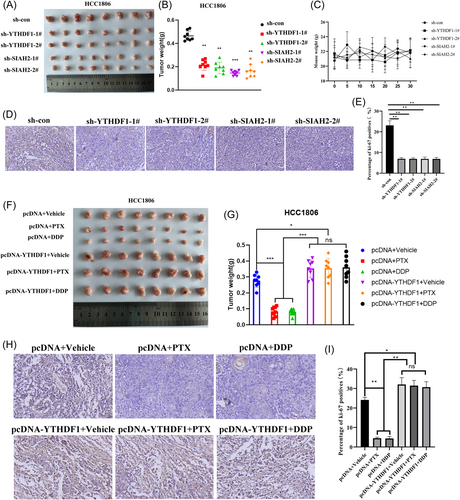
We next evaluated the influence of YTHDF1 and SIAH2 on the tumourigenesis of TNBC in vivo. We transfected HCC1806 cells with sh-YTHDF1 and sh-SIAH2, or sh-NC. HCC1806 cells (1 × 10⁶) were inoculated into the mammary fat pads of NOD/SCID mice. Results determined that knockdown of YTHDF1 and SIAH2 decreased tumor volume in vivo (Figure 6A,B), and did not impact mice weight (Figure 6C). Western blot analysis detected the expression levels of YTHDF1 and SIAH2 in tissues and tumor cell proliferation was determined by Ki67 immunostaining. The sh-YTHDF1 and sh-SIAH2 lead to decreased Ki67 positive cells rate and expression of YTHDF1, SIAH2, YAP, and increased LATS2 expression compared with sh-NC tissues (Supporting Information S1: Figure S7A–B and Figure 6D,E). Next, we further assessed the effect of YTHDF1 on chemoresistance of TNBC in vivo. When the volume of the transplantation tumor reached 50 mm3, PTX (1 mg/Kg, twice a week) and DDP (1 mg/Kg, twice a week) were used for treatment. The results showed that PTX and DDP significantly inhibited tumor growth. Overexpression of YTHDF1 can resist tumor growth inhibited by PTX and DDP (Figure 6F–I).
4 DISCUSSION
Chemotherapy-induced drug resistance is the main reason for the failure of current TNBC treatment. The m6A modification is involved in TNBC development and drug resistance.20, 21 Among them, the m6A methylation binding protein YTHDF1 is highly expressed in different types of breast cancer and drives the genesis, proliferation, and metastasis of breast cancer.22-24 However, the role of YTHDF1 in TNBC drug resistance is still unclear. This study confirmed the key molecular mechanism by which YTHDF1 mediates the effect of SIAH2/Hippo-YAP on TNBC growth, stemness, and drug resistance through bioinformatics analysis and cell/animal experiments. In this study, it was observed that YTHDF1 and SIAH2 were highly expressed in TNBC cells, and the transfection of sh-YTHDF1 and sh-SIAH2 in cells inhibited proliferation, stemness, and promoted apoptosis and chemosensitivity. Interestingly, pcDNA-SIAH2 reversed the effect of sh-YTHDF1 on tumor cells. Meanwhile, LATS2 was upregulated and YAP was downregulated in the cells transfected with sh-YTHDF1 and sh-SIAH2 (Figure 7).
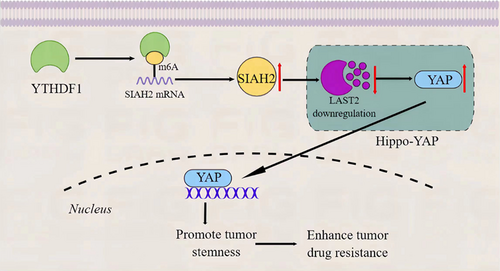
m6A RNA methylation is a key biological process in tumor progression and drug resistance. The m6A RNA methylation reader YTHDF1 plays oncogenic roles in a variety of tumors and is involved in tumor drug resistance.25, 26 In breast cancer, YTHDF1 can promote glycolytic metabolism to drive breast cancer by binding to PKM2,22 it can also promote breast cancer progression by promoting FOXM1 translation.27 In the hypoxic microenvironment, YTHDF1 can be induced to up-regulate and promote the proliferation and metastasis of breast cancer cells.22 Furthermore, In CRC, YTHDF1 was amplified in CRC tissues and cells and led to DDP resistance.12 In lung cancer, upregulated YTHDF1 induces metastasis and drug resistance of lung cancer cells.28 In this study, we found that YTHDF1 was highly expressed in breast cancer cells MCF-7 and TNBC cells, especially in TNBC cells. This result is consistent with the study by Yao et al.22 This suggests that YTHDF1 plays an important role in development of breast cancer, especially in TNBC. Therefore, we will focus on the regulation mechanism of YTHDF1 on TNBC cells. Knockdown of YTHDF1 in HCC-1806, HCC-1937, and MDA-MB-231 cells suppressed TNBC cell proliferation, stemness, tumorigenicity in nude mice, and resistance to DDP and PTX, and promoted cell apoptosis. Subsequently, we further found that SIAH2 is the downstream regulatory target of YTHDF1, and YTHDF1 could promote the development of TNBC by upregulating the expression of SIAH2.
SIAH family proteins are analogs of Drosophila SINA proteins, which have E3 ubiquitin ligase activity and can mediate the degradation of various proteins through the ubiquitination pathway.29, 30 SIAH is divided into two subtypes, SIAH1 and SIAH2,31 among which SIAH2 has the effect of promoting tumor cell growth, and can promote the development of ovarian cancer, breast cancer, gastric cancer, and other malignant tumors through various pathways.13, 32-34 In breast cancer, SIAH2 primarily shows tumorigenic functions. Studies have found that SIAH2 silencing reduced breast tumor growth in vivo.35 At the same time, the high expression of SIAH2 has a strong correlation with ER+ breast cancer, and is involved in the chemosensitivity of MCF-7 cells to tamoxifen.36 This is consistent with our results, and this study also confirmed that SIAH2 was highly expressed in MCF-7 cells. In addition, the results of this study found that the expression of SIAH2 was higher in TNBC cells, but the regulation and chemosensitivity of SIAH2 in TNBC were not clear. In this study, we found that Knockdown of SIAH2 in HCC-1806 and MDA-MB-231 cells suppressed TNBC cell proliferation, stemness, tumorigenicity in nude mice, and resistance to DDP and PTX, and promoted cell apoptosis. This indicated that knockdown of SIAH2 exerted the same tumor suppressor effect as knockdown of YTHDF1. Since YTHDF1 and SIAH2 are highly expressed in TNBC and regulate the malignant biological behavior of TNBC, we speculated that YTHDF1 and SIAH2 may have related regulation or a common downstream regulation mechanism in TNBC. Interestingly, we found that YTHDF1 knockdown could suppress the expression of SIAH2, while the effect of YTHDF1 knockdown on HCC-1806 and MDA-MB-231 cells was reversed by pcDNA-SIAH2. The results of this study indicate that the processes of YTHDF1 and SIAH2 promote the malignant biological behavior of TNBC cells are related to the upregulation of SIAH2 expression by YTHDF1.
SIAH2 mediates the ubiquitination and degradation of substrates, including key proteins of multiple signaling pathways.13 Among them, the key protein LATS2 of the Hippo pathway was confirmed to interact with SIAH2 and be degraded by SIAH2.37 Together with LATS2 downregulation induced by SIAH2, YAP-S127 phosphorylation was significantly reduced but YAP nuclear translocation was enhanced, which suggests that SIAH2 activates YAP and antagonizes Hippo signaling by facilitating the ubiquitination and degradation of LATS2.15 This is consistent with the current study of TNBC cells. It was also found that the knockdown of SIAH2 in HCC-1806 and MDA-MB-231 cells upregulated LATS2 and downregulated YAP. Furthermore, the knockdown of YTHDF1 in HCC-1806 and MDA-MB-231 cells had the same impact on the expression of LATS2 and YAP as the knockdown of SIAH2.
In conclusion, YTHDF1 confers cell stemness and chemoresistance in TNBC. Further experiments revealed the regulatory mechanism of the YTHDF1/SIAH2/Hippo pathway on TNBC. It is the first time to demonstrate that YTHDF1 promotes the Hippo pathway by upregulating SIAH2 to promote TNBC cell proliferation, stemness, tumorigenicity, and resistance to DDP and PTX in nude mice. Therefore, this study identifies YTHDF1 and SIAH2 as therapeutic targets for overcoming chemoresistance in TNBC.
AUTHOR CONTRIBUTIONS
Jian Sun and Maohua Wang conceived the study. Anhao Wu, Xi Wang, and Fang Zhang performed animal models and cells experiment. Xin Yang, Yuhang Quan, and Junyu Dong performed cells experiment. Yafang Lai and Dechun Yang provided acquisition, analysis of data. Anhao Wu, Xi Wang, Fang Zhang, Jian Sun, and Maohua Wang performed writing, review, and revision of the paper.
ACKNOWLEDGMENTS
This work was supported by Yunnan Fundamental Research Projects (Grant Nos. 202201AU070007 and 202201AY070001-147 to Anhao Wu, 202201AY070001-146 to Maohua Wang).
CONFLICT OF INTEREST STATEMENT
The authors declare no conflict of interest.
Open Research
DATA AVAILABILITY STATEMENT
The data that support the findings of this study are available from the corresponding author upon reasonable request.


