DNA stable-isotope probing reveals potential key players for microbial decomposition and degradation of diatom-derived marine particulate matter
Graphical Abstract
By combining DNA stable-isotope probing and Illumina Miseq high-throughput sequencing, we identified 14 bacterial taxonomic groups actively involved in the decomposition of particulate organic matter (POM) at different pressures. Both particle-attached and free-living microorganisms were able to decompose POM and assimilate the released dissolved organic matter, suggesting the decoupling between microbial lifestyles and ecological functions. Our results provide direct evidence linking the specific microbial lineages to decomposition and degradation of POM and identified the potential mediators of POM fluxes in the ocean.
Abstract
Microbially mediated decomposition of particulate organic carbon (POC) is a central component of the oceanic carbon cycle, controlling the flux of organic carbon from the surface ocean to the deep ocean. Yet, the specific microbial taxa responsible for POC decomposition and degradation in the deep ocean are still unknown. To target the active microbial lineages involved in these processes, 13C-labeled particulate organic matter (POM) was used as a substrate to incubate particle-attached (PAM) and free-living microbial (FLM) assemblages from the epi- and bathypelagic zones of the New Britain Trench (NBT). By combining DNA stable-isotope probing and Illumina Miseq high-throughput sequencing of bacterial 16S rRNA gene, we identified 14 active bacterial taxonomic groups that implicated in the decomposition of 13C-labeled POM at low and high pressures under the temperature of 15°C. Our results show that both PAM and FLM were able to decompose POC and assimilate the released DOC. However, similar bacterial taxa in both the PAM and FLM assemblages were involved in POC decomposition and DOC degradation, suggesting the decoupling between microbial lifestyles and ecological functions. Microbial decomposition of POC and degradation of DOC were accomplished primarily by particle-attached bacteria at atmospheric pressure and by free-living bacteria at high pressures. Overall, the POC degradation rates were higher at atmospheric pressure (0.1 MPa) than at high pressures (20 and 40 MPa) under 15°C. Our results provide direct evidence linking the specific particle-attached and free-living bacterial lineages to decomposition and degradation of diatomic detritus at low and high pressures and identified the potential mediators of POC fluxes in the epi- and bathypelagic zones.
1 INTRODUCTION
Organic matter produced by phytoplankton in the surface ocean is exported to the deep ocean and the seabed via, mostly, sinking particulate organic matter (POM) by the processes of the biological pump (Azam & Malfatti, 2007; Eppley & Peterson, 1979; Falkowski, 1998; Volk & Hoffert, 1985). It is estimated that sinking particulate organic carbon (POC) (102–104 μm diameter; Verdugo et al., 2004) is transported to the deep ocean with a global rate of 2–13 Pg C year−1 (Boyd & Trull, 2007; Eppley & Peterson, 1979; Lima, Lam, & Doney, 2014). During descent, the sinking POC flux attenuates sharply with depth as a result of decomposition of POC and release of dissolved organic carbon (DOC) from abiotic (disaggregation and fragmentation) and biotic processes (zooplankton consumption and microbial remineralization) (Burd & Jackson, 2009; DeLong, Franks, & Alldredge, 1993; Simon, Grossart, Schweitzer, & Ploug, 2002; Steinberg et al., 2008; Turner, 2015; Wilson, Steinberg, & Buesseler, 2008). Approximately 90% of the sinking POC is remineralized in the upper 1,000 m, and only 0.1%–0.3% of the POC can reach the seafloor and is ultimately buried in sediments (Arístegui, Agustí, Middelburg, & Duarte, 2005; Arístegui, Gasol, Duarte, & Herndld, 2009; Hedges, 1992; Wakeham & Lee, 1993).
Marine microorganisms play a critical role in the decomposition and remineralization of POC (Anderson & Ryabchenko, 2009; Anderson & Tang, 2010; Azam & Malfatti, 2007; Fang et al., 2015). It has been hypothesized that the particulates act as carbon- and nutrient-rich hotspots, and the particle-attached microorganisms (PAM) secrete exoenzymes to decompose the particles and release dissolved organic carbon (Simon et al., 2002). PAM solubilize POM faster than they are able to take up the released DOC, leading to the formation of carbon- and nutrient-rich DOC plumes, streaming behind the POC particulates. The released DOC supports PAM and the free-living microorganisms (FLM) in the surrounding water for their growth and respiration (Azam & Long, 2001; Fang et al., 2015; Kiørboe & Jackson, 2001; Li et al., 2015). Thus, microbial decomposition and transformation of POM controls organic carbon (OC) fluxes delivered from the surface ocean to the deep ocean, and heterotrophic microorganisms play an essential role in the process (e.g., Belcher et al., 2016; Karl, Knauer, & Martin, 1988; Steinberg et al., 2008). Understanding POC decomposition and degradation processes is critical to assess the sequestration and storage of carbon in the ocean and oceanic carbon cycling.
Hydrostatic pressure is a critical parameter in affecting microbial physiology (Bubendorfer et al., 2012; Marietou & Bartlett, 2014), abundance (Grossart and Gust, 2009; Marietou & Bartlett, 2014), metabolic activity (Tamburini, Garcin, Ragot, & Bianchi, 2002; Tamburini et al., 2006; Tamburini et al., 2003; Turley, 1993), diversity, and community structure (Grossart and Gust, 2009; Marietou & Bartlett, 2014; Tamburini et al., 2006, 2009). Piezophiles refer to pressure-loving microorganisms, which grow preferentially at high pressure than atmospheric pressure. Piezotolerant bacteria had optimal growth at atmospheric pressure (Fang et al., 2010). For instance, deep-sea bacterium Photobacterium profundum SS9 increased the proportion of unsaturated fatty acids at high pressure (Allen et al., 1999), Shewanella putrefaciens CN-32 possesses dual flagellar system (Bubendorfer et al., 2012) under high pressure conditions. High pressure reduced bacterial cell numbers (Grossart and Gust, 2009; Marietou & Bartlett, 2014), decreased microbial metabolic activity (Tamburini et al., 2006; Tamburini et al., 2002; Tamburini et al., 2003; Turley, 1993) and organic matter degradation rates (Tamburini, Boutrif, Garel, Colwell, & Deming, 2013). High pressure increased the relative abundance of Gammaproteobacteria and Cytophaga-Flavobacter cluster when prokaryotes incubated with diatom detritus (Tamburini et al., 2006) or fecal pellets (Tamburini et al., 2009). Laboratory experiments showed that high pressure caused an increase in the relative proportion of Alphaproteobacteria in a coastal environment (Marietou & Bartlett, 2014).
Despite its importance, it remains a principal challenge to identify and quantify the relative importance of various microbes involved in these processes. There has been no direct evidence linking specific bacterial lineages to POM decomposition and DOM degradation. Some studies indicate that bacterial activity on sinking particles in the deep ocean is inadequate to account for the attenuating POC flux with depth (Karl et al., 1988). Others suggest that the free-living bacteria, rather than particle-attached bacteria, are the primary mediators of particulate decomposition in the ocean's interior (Cho & Azam, 1988; Karl et al., 1988). Furthermore, there have been contrasting estimates on the contributions of PAM in particle decomposition and remineralization. Smith, Simon, Alldredge, and Azam (1992) estimated that 97% of the hydrolysates produced by bacteria in marine snow were released, with 3% being utilized by PAM in the aggregates (Smith et al., 1992). In another study, Belcher et al. (2016) showed that PAM respiration represents a minor portion (3%–16%) of POC attenuation in the upper water column, but becomes more important (10%–65%) in the deep, suggesting great variations in rates of the processes with depth (Belcher et al., 2016). Knowing which types of microorganisms break down POM and degrade DOM may be useful in the assessment of factors that control OC flux from the surface ocean to the deep ocean. As the succession of microbial communities often occurs with depth in the ocean, studying the response of microbial communities to POM at different depths can provide clues about linkages between microbial niche specialization and their resource utilization (e.g., Lauro et al., 2009).
Stable-isotope probing (SIP) is a powerful technique that directly links specific functional microorganisms to a particular biogeochemical process (Radajewski, Ineson, Parekh, & Murrell, 2000). This method is based on the premise that metabolically active microbes that assimilate stable-isotope-labeled substrates would incorporate the rare isotope (e.g., 13C) into cellular macromolecules (e.g., DNA, phospholipid fatty acids, etc.), that can be detected by molecular microbiological techniques, thereby enabling the identification and quantification of the functionally active microorganisms (Radajewski et al., 2000). In the present study, we used DNA stable-isotope probing to target the active microbial taxa involved in decomposition and degradation of POM and DOM by incubating microorganisms enriched from shallow (75 m) and deep waters (2,000 and 4,000 m) of the New Britain Trench with 13C-labeled POM. We hypothesize that PAM and FLM perform different functions in the ocean, that is, POC decomposition by the former and DOC degradation by the latter. We further postulate that the divided functions between PAM and FLM become undivided with increasing pressure in the deep ocean, that is, both groups of microbes can perform the same functions, POC decomposition and DOC degradation. The objective of this study was to gain insight into the microbial-mediated decomposition and degradation processes of diatom-derived marine particulate organic carbon (POC), by mimicking POC sinking from the surface ocean to the deep ocean (increase in hydrostatic pressure) and examining the changes in community structure of particle-attached and free-living microorganisms, the processes they participated in (decomposition and degradation), and the rates of carbon utilization by these microbes.
2 MATERIALS AND METHODS
2.1 Sampling
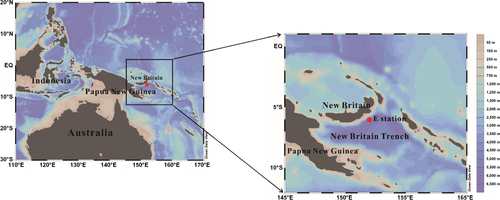
Seawater samples were collected from the E station (06°02.1243′S, 151°58.5042′E) (Figure A1) of the New Britain Trench (NBT) during the cruise of M/V Zhangjian in September 2016. Samples were taken at three depths, 75-, 2000-, and 4000-m, by using a SBE-911Plus CTD with Niskin bottles (Sea-Bird Inc.). The seawater samples were not kept under in situ pressure prior SIP incubations. The physical and chemical parameters of the seawater samples in the water column of NBT can be seen in Table A1.
About 1 L seawater sample from each depth was filtered sequentially through a 47-mm 3 μm pore size polycarbonate (PC) membrane (Merck Millipore Ltd.) to collect the particle-attached microbes, and a 47-mm 0.22 μm pore size PC membrane to collect the free-living bacterial assemblages (Eloe et al., 2011). A total of six filters were used for collecting PAM or FLM from seawater at each depth. Three filters were used for the total DNA extraction and community diversity analysis. The other three filters were used for subsequent SIP incubations (see below).
2.2 Stable-isotope probing experiments
2.2.1 Production of 13C-labeled particulate organic matter (POM)
The planktonic diatom species Thalassiosira weissflogii (strain CCMA-102), one of the most common diatom species in the global surface ocean, was selected for the 13C-labeled tracer experiment. The diatoms were cultured either with added 13C-labeled NaHCO3 or nonlabeled NaHCO3 (control), in the f/2 media prepared in a 5.5 L Erlenmeyer flask, with 5 L sterile artificial seawater (ASW). The ASW contained (w/v%) the following: 2.12 NaCl, 0.34 Na2SO4, 0.06 KCl, 0.008 KBr, 0.0058 H3BO3, 0.00028 NaF, 0.96 MgCl2 ▪ 6H2O, 0.13 CaCl2 ▪ 2H2O, 0.0022 SrCl2 ▪ 6H2O, 0.029 NaH13CO3 in distilled water (Berges, Franklin, & Harrison, 2001), supplement with NaSiO3 (Guillard, 1975), 250 ml Thalassiosira weissflogii suspension (precultured for 20 days). The NaH13CO3 solution was prepared by dissolving 1.5 g NaH13CO3 in 50 ml sterile double-distilled H2O (ddH2O) and filtered through a 0.22 μm polycarbonate filter (Pasotti, Troch, Raes, & Vanreusel, 2012). After 30 days of growing in an illumination incubator at 20°C and a 12-hr, 12-hr light/dark regime, diatom detritus, 13C-labeled and nonlabeled (control) were collected by centrifugation (Beckman Coulter) at 11,180 g for 10 min. The collected diatom detritus was lyophilized in a Lyophilizer (Christ Corp.) at −44°C for 48 hr. The dry diatom detritus was ground with liquid nitrogen, and autoclaved at 121°C for 20 min, and then stored at −20°C until use. The percentage of the 13C-labeled and 12C-control for diatom detritus was determined to be 71.7% and 1.3%, respectively.
2.2.2 High pressure incubation
Particle-attached microbial and FLM were obtained from serial filtrations as described above, the three filters for collecting PAM or FLM via filtration of seawater were added directly into the pouches for SIP incubations. The collected particle-attached and free-living microbes were incubated with the added bacteria-free detrital particulate organic matter in separate cultures, designated as 75 (2000/4000)-m-13C (12C)-PAM (FLM), at in situ pressure (0.1, 20, and 40 megapascal, MPa) and 15°C under dark condition for 30 days, using air-tight pouches. The media contained 60 ml sterile artificial seawater, 0.2 g 13C-labeled diatom detritus (≥0.7 μm pore size), and 20 ml Fluorinert™ (3M™ Corp.). Fluorinert was added to the pouches to serve as a source of oxygen to the cultures (Fang, Uhle, Billmark, Bartlett, & Kato, 2006; Kato, Sato, & Horikoshi, 1995). Prior to use, Fluorinert was saturated by bubbling high-purity oxygen for 8–10 hr at 4°C and then filtered through a 0.22 μm polycarbonate filter (Fang et al., 2006). The control was prepared using nonlabeled detritus as a growth substrate. All cultures were done in triplicate. Growth of PAM and FLM plateaued after 30 days.
It must be emphasized that the in situ temperature was around 2°C at 2,000 and 4,000 m depths at our sampling sites (Table A1), much lower than the incubation temperature (15°C). For this test of concept study, we used 15°C, instead of the in situ temperature, in microbial cultivation, in order to generate enough biomass for subsequent molecular microbiological study.
2.3 Determining the concentration and δ13C of POC and DOC
An aliquot of 10 ml culture was filtered through 25-mm 0.7 μm pore size glass fiber filter (Whatman) which was precombusted in a muffle furnace at 450°C for 5 hr. The collected filter membrane and filtrate were used for POC and DOC concentration measurements, respectively. In preparation for POC and DOC analysis, the collected filters were pickled with 12 M HCl for 24 hr in fume cupboards and then dried at 50°C for 24 hr in an oven, and the filtrate was acidized with 20 μl 12 M HCl. The concentration of POC and DOC was measured by a PE2400 Series II CHNS/O analyzer (Perkin Elmer) and a TOC-VCHP analyzer (Shimadzu Corp.), respectively, at the Institute of Soil Science, Chinese Academy of Sciences, Nanjing, China. The δ13C of POC and DOC was determined by an Isotope Ratio Mass Spectrometer (Thermo Scientific) at the Third Institute of Oceanography, Xiamen, China.
2.4 DNA extraction and SIP gradient fractionation
After 30 days incubation, an aliquot of 10 ml culture was centrifuged at 10,000 rpm for 5 min to collect cell biomass. The PC filters for PAM and FLM filtrations at day 0 were cut into pieces and then transferred to 2 ml sterilized centrifuge tubes. DNA was extracted with FastDNA™ SPIN Kit for Soil (MP Biomedical) according to the manufacturer's instructions. The total DNA concentration was determined by NANO DROP 2000 (Thermo Scientific) at 260 nm wavelength and the DNA was stored at −80°C until further analysis.
The DNA-SIP gradient fractionation was performed by following the protocol described previously (Jia & Conrad, 2009; Neufeld, Vohra, et al., 2007). In brief, about 2.0 μg of particle-attached or free-living bacterial DNA at day 30 was mixed with Gradient Buffer (GB) and CsCl to achieve a buoyant density of 1.725 g/ml. After symmetry and balance, the mixtures in the ultracentrifuge tube were centrifuged at 190,000 g at 20°C for 44 hr. After centrifugation, each gradient was fractionated from the bottom of the tube using a peristaltic pump operating at 380 μl/min on continuous mode to collect 14 fractions (~380 μl each). The refractive index of the 14 DNA gradient fractions was measured using AR200 digital refractometer (Reichert, Inc.). Each DNA gradient fraction was purified and then dissolved in 30 μl sterile ddH2O (Jia & Conrad, 2009; Neufeld, Vohra, et al., 2007), and preserved at −20°C until subsequent treatment.
2.5 Real-time quantitative PCR
The copy number of bacterial 16S rRNA gene in the 3th-14th fractionated DNA of PAM and FLM was determined on a CFX 96 Optical Real-Time Detection System (Bio-Rad Laboratories Inc.). DNA samples were amplified using primer set Bac331F (5´-TCCTACGGGAGGCAGCAGT-3´) and 797R (5´-GGACTACCAGGGTCTAATCCTGTT-3´) (Nadkarni, Martin, Jacques, & Hunter, 2002). Each 20-μl reaction system contained 1 μl DNA template, 0.3 μl of each primer (0.5 μM), 10 μl SYBR Premix Ex Taq™ (Takara Biotech, Dalian, China), and 8.4 μl sterile ddH2O. Each sample was performed in triplicate. The qPCR amplification condition was as follows: initial denaturation (95°C) for 30 s; 40 cycles of denaturation (95°C) for 5 s, annealing at 55°C for 30 s, and extension at 72°C for 1 min. The construction of standard curves (Ct value vs. gene copy number) was performed with plasmids DNA including amplicon fragment of Bac27F/1492R. The amplification efficiency of the bacterial 16S rRNA gene was around 100% and the R2 was <.99.
2.6 Illumina MiSeq sequencing
Before Illumina high-throughput sequencing, DNA from PAM and FLM at day 0 and the 4th-10th layers of the DNA gradient fractions at day 30 were amplified using the primer pair 515F (5′-GTGCCAGCMGCCGCGG-3′) and 907R (5′-CCGTCAATTCMTTTRAGTTT-3′) (Lane, 1991; Stubner, 2002), targeting the V4-V5 regions of the bacterial 16S rRNA gene. The 12 bp unique barcode sequences that were adhered to the 5′ end of 515F were used to demultiplex sequences. The 50-μl PCR amplification system was conducted in triplicate, with each containing 2.5 μl of DNA template, 1 μl of each primer (10 μM), 25 μl Premix TaqTM (Takara), and 20.5 μl sterile ddH2O. The PCR amplification conditions were as follows: 94°C for 5 min; 32 cycles of 94°C for 30 s, 55°C for 30 s, and 72°C for 45 s; 72°C for 8 min. All PCR amplicons were visualized on 1% (w/v) agarose gels, then pooled and purified using E.Z.N.A Cycle Pure Kit (OMEGA bio-tek). Finally, the purified DNA was quantified by QuantiFluorTM-ST (Promega). The sequencing of purified DNA samples was performed with an Illumina MiSeq platform (Illumina) at the Institute of Soil Science, Chinese Academy of Sciences, Nanjing, China.
The raw high-throughput sequencing data were processed using Quantitative Insights Into Microbial Ecology (QIIME version: 1.9.1) to filtrate effective reads (Caporaso et al., 2010; http://www.qiime.org) with default parameters. The optimizing reads were clustered to operational taxonomic unit (OTU) with a cutoff value of 97% similarity using UPARSE (version 7.1). The representative sequences of OTUs were aligned using the Ribosomal Database Project (RDP) classifier (http://rdp.cme.msu.edu/) against the Silva16S rRNA database (SSU123) (www.arb-silva.de/) using a confidence threshold of 70%.
2.7 Statistical analysis
To analyze the α-diversity (Shannon, Simpson, Coverage, Ace and Chao) of PAM and FLM communities, all samples in the OTU table were subsampled to the same number of sequences based on the fewest sequences (n = 4,099) using QIIME software (Caporaso et al., 2010; http://www.qiime.org). The variations of shared and unique OTUs in PAM and FLM were calculated by using Venny 2.1 (http://bioinfogp.cnb.csic.es/tools/venny/index.html). Nonmetric multidimensional scaling (NMDS) analysis was used to evaluate the dissimilarity of different samples based on the Bray-Curtis similarity matrix using the software R program (v3.2.3) with vegan package (Pinheiro, Bates, Debroy, Sarkar, & Team, 2012). The analysis of similarity (ANOSIM) was used to test the dissimilarity between samples. The heatmap plot was performed by Heatmap Illustrator 1.0 software (http://hemi.biocuckoo.org/down.php). Phylogenetic tree of the active OTUs in PAM and FLM was constructed through neighbor-joining methods with 1,000 bootstrap values using MEGA 7.0 software (Kumar, Stecher, & Tamura, 2016).
In our study, the active OTUs are defined as those with relative abundance ≥1% that the abundance of an OTU in the 13C-heavy DNA fraction minus the corresponding abundance in the 12C-heavy DNA fraction in PAM and FLM after incubation (Orsi et al., 2016).
3 RESULTS
3.1 POC decomposition and DOC degradation
Microbial decomposition and degradation of POC and DOC resulted in drastic changes in concentrations of POC and DOC in the cultures (Figure 1 and Table A2). For PAM cultures, the reduction of POC concentrations decreased with pressure, averaging 52% (from 54.0 to 25.7) in the 0.1-MPa culture, 27% (55.6 to 40.4) and 24% (53.3 to 40.5 mg/L) in the 20- and 40-MPa-PAM cultures, respectively (Figure 1a). The FLM cultures showed a slightly different pattern, POC concentrations decreased by 29% (0.1 MPa), 41% (20 MPa), and 46% (40 MPa) (Figure 1b). On the other hand, the concentrations of DOC in PAM and FLM cultures decreased in the 0.1-MPa, and increased in the 20-MPa and 40-MPa (Figure 1a and b).
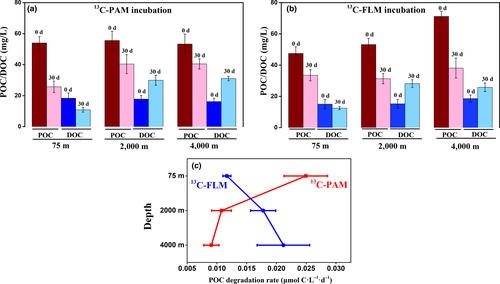
Biodegradation rates by PAM and FLM assemblages were calculated based on the incorporation of 13C into microbial biomass as described by Suroy, Panagiotopoulos, Boutorh, Goutx, and Moriceau (2015). The POC degradation rates by PAM ranged from 0.009 to 0.025 μmol C L−1 day−1 at the three pressures, with the maximum rate at atmospheric pressure (Figure 1c). POC degradation rates by FLM were relatively higher, ranging from 0.012 to 0.021 μmol C L−1 day−1, with the maximum rate at high pressure (40 MPa). Thus, POC degradation rates by the PAM communities decreased markedly with pressure, whereas POC degradation rates by the FLM communities increased with pressure (Figure 1c). Overall, POC degradation rates were much higher at atmospheric pressure than that at high pressure at 15°C (Figure 1c).
Furthermore, the variations in δ13C values of POC showed that the percentage of 13C-labeled substrate (the atom percent of 13C) utilized by the PAM and FLM were 4.2 and 2.6%, 2.1 and 2.2%, and 1.2 and 3.5% at 0.1, 20, and 40 MPa under 15°C, respectively (Table A3).
3.2 Identifying PAM and FLM that utilized POC
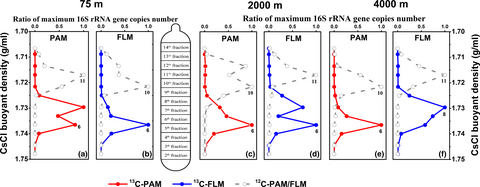
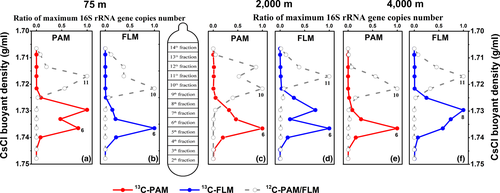
Results of real-time quantitative PCR showed that the maximum copy number of bacterial 16S rRNA gene appeared in the 6th or 8th “heavy” DNA fractions of the PAM- and FLM-13C cultures (Figure 2), with the maximum value of 5 × 10⁶ copies/ml in 13C-PAM culture at 0.1 MPa, while the bacterial abundance peaked in the 10th or 11th “light” fractionated DNA for 12C-control treatment, with the highest value of 1.2 × 10⁷ copies/ml in 12C- FLM culture at 0.1 MPa (Table A4). The bacterial copy number in 13C-PAM culture was higher than that of 13C-FLM culture at 0.1 and 40 MPa, whereas the bacterial copy number of PAM was lower than that of FLM at 20 MPa (Table A4). The CsCl buoyant density (BD) shift, defined as the difference in buoyant density between the (13C-12C) peak layers, ranged from 0.013–0.02 g/ml in PAM and FLM at three different pressures, with the highest in the 13C-PAM culture at 0.1 MPa and 13C-FLM culture at 20 MPa, and lowest in the 13C-FLM culture at 40 MPa (Table A5).
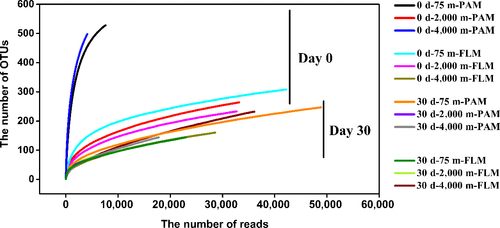
By Illumina sequencing, a total of 2,112,639 high-quality reads in 90 samples were obtained with an average length of 421 bp. The reads were clustered into 3,533 operational taxonomic unit (OTU) based on 97% sequence similarity. Alpha-diversity index showed that the diversity index (Shannon and Simpson) of PAM and FLM decreased markedly after cultivation. However, the microbial richness (Ace and Chao) and diversity (Shannon and Simpson) between PAM and FLM were similar in day 30 (Table A6 and Figure A2).
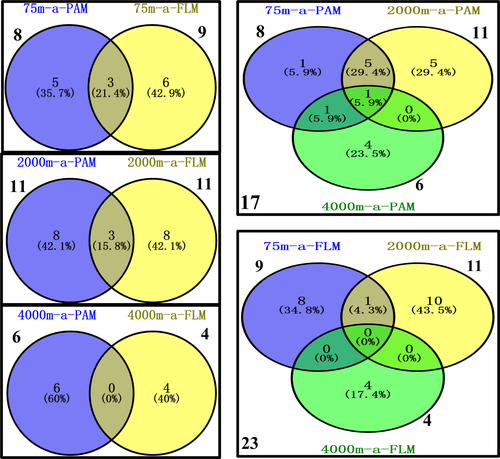
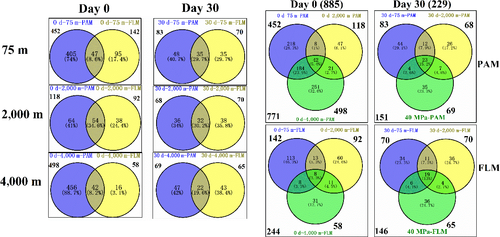
The Venn diagrams indicate that before incubation, a total of 771 and 244 OTUs were identified in the PAM and FLM assemblages, respectively. Around 452, 118, and 498 OTUs in the PAM fraction were distributed at 75-, 2,000-, and 4,000-m depths, respectively. Correspondingly, only 142, 92, and 58 OTUs in the FLM fraction were identified at 75, 2,000, and 4,000 m depths (Figure A3). However, after 30-d cultivation, only 17 and 23 active OTUs were identified in PAM and FLM fractions, with 8, 11, and 6 active OTUs for PAM, and 9, 11, and 4 active OTUs for FLM at 0.1-, 20-, and 40-MPa pressures, respectively (Figure 3). At day 0, the OTUs of PAM only, FLM only, and the transient form (occurs in both the PAM and FLM fractions) were 405, 47, and 95 for 75-m culture, respectively; the unique OTUs of PAM, the unique OTUs of FLM, and the shared OTUs between the PAM and FLM were 64, 54, and 38 for 2,000-m culture, respectively; and only PAM OTUs, only FLM OTUs, and the common OTUs of PAM and FLM were 456, 42, and 16 for 4,000-m culture, respectively (Figure A3). After 30-days incubation, the corresponding number of active OTUs were reduced to 5, 3, 6; 8, 3, 8; and 6, 0, 4 (Figure 3). Among 31 OTUs, 8 and 14 OTUs existed exclusively as PAM and FLM, respectively, and 9 as transient form (Table A7).
The nonmetric multidimensional scaling (NMDS) analysis was performed to compare the similarities between PAM and FLM at 0.1, 20, and 40 MPa and 15°C before and after incubation (Figure 4a). Two clusters were formed: the PAM and FLM in day 0 (I) and day 30 (II), suggesting significant dissimilarity in microbial communities before and after incubation (Figure 4a). Analysis of similarity (ANOSIM) also revealed significant differences in microbial communities between day 0 and day 30 (R = .6583, p = .003, Table 1). The active PAM and FLM for POC decomposition at 0.1, 20, and 40 MPa and 15°C in day 30 also formed two clusters, active PAM (I), and active FLM (II) (Figure 4b). However, ANOSIM analysis (R = 0, p = .529, Table 1) revealed much less differences between the two.

| ANOSIM | R value | P value | |||
|---|---|---|---|---|---|
| Comparison 1 | Total OTUs | Day 0 | PAM vs. FLM | .1481 | .391 |
| Comparison 2 | Total OTUs | Epipelagic (75 m) vs. Bathypelagic (2,000–4,000 m) | .5 | .075 | |
| Comparison 3 | Total OTUs | Day 0 vs. Day 30 | .6583 | .003 | |
| Comparison 4 | Total OTUs | Day 30 | PAM vs. FLM | .0741 | .384 |
| Comparison 5 | Total OTUs | 75 m vs. 2,000–4,000 m | .3214 | .292 | |
| Comparison 6 | Active OTUs | PAM vs. FLM | 0 | .529 | |
| Comparison 7 | Active OTUs | 75 m vs. 2,000 m | .5 | .338 | |
| Comparison 8 | Active OTUs | 75 m vs. 4,000 m | .25 | .32 | |
| Comparison 9 | Active OTUs | 2,000 m vs. 4,000 m | .125 | .346 | |
Note
- The R value indicates differences between the two groups, while the p value shows the level of significant difference.
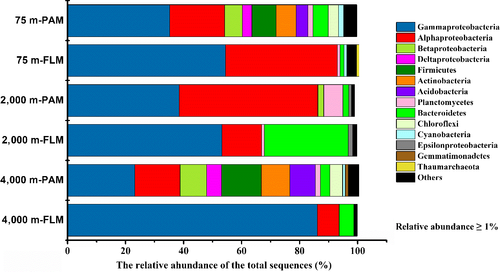
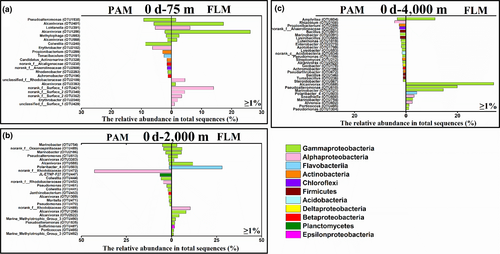
Before incubation, the PAM assemblage was dominated by Gammaproteobacteria (genus Pseudoalteromonas) and Alphaproteobacteria (genus Erythrobacter), Alphaproteobacteria (Rhodobiaceae) and Gammaproteobacteria (genus Marinobacter), and Gammaproteobacteria (genus Amphritea) and Actinobacteria (genus Propionibacterium) at 75-, 2,000-, and 4,000-m depths, respectively (Figures A4 and A5). The preincubation FLM assemblages were dominated by Gammaproteobacteria (genus Alcanivorax) and Alphaproteobacteria (genus Surface 1), Bacteroidetes (genus Polaribacter 4) and Gammaproteobacteria (genus Alcanivorax), and Gammaproteobacteria (genus Alcanivorax) at 75-, 2,000-, and 4,000-m depths, respectively (Figures A4 and A5). Archaea had an abundance of <1% (data not shown) and will not be discussed thereafter.
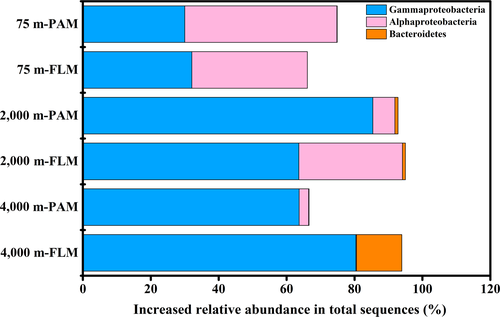
After the 30-day incubation, the PAM communities responsible for POC utilizing were dominated by Alphaproteobacteria (genus Ruegeria) and Gammaproteobacteria (genera Pseudomonas and Halomonas) in the 0.1-MPa culture, Gammaproteobacteria (genera Pseudomonas, Marinobacter and Halomonas) and Alphaproteobacteria (genus Labrenzia) in the 20-MPa culture, and Gammaproteobacteria (Halomonas and Marinobacter genera) in the 40-MPa communities (Figures 5 and 6). On the other hand, the active FLM community was dominated by Gammaproteobacteria (Marinobacter) and Alphaproteobacteria (unclassified Rhodobacteraceae and Ruegeria), Gammaproteobacteria (Pseudomonas) and Alphaproteobacteria (Labrenzia), and Gammaproteobacteria (Pseudoalteromonas) and Bacteroidetes (Zunongwangia) in the 0.1-, 20-, and 40-MPa cultures, respectively (Figures 5 and 6).

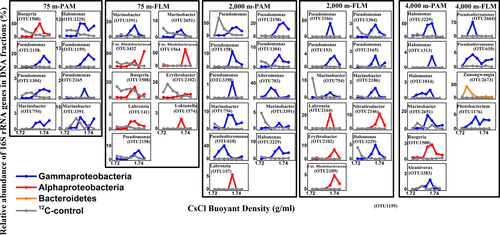
Thirty-one active OTUs responsible for POC decomposition were identified in PAM and FLM assemblages after 30 days (Figures 7 and 8 and Table A8). These active OTUs were affiliated with 14 genera in three classes: Gammaproteobacteria, Alphaproteobacteria, and Flavobacteria (Table A8). The relative abundance of dominant active OTUs in the 4th-10th fractionated DNA along the different buoyant density gradients can be seen in Figure 7. This result indicates that the relative abundance of each OTU was much higher in the “heavy” fractionated DNA of the 13C-labeled treatment than the corresponding abundance in the 12C-control treatment (Figure 7). It also revealed that these active microorganisms had sufficient cell division and incorporated enough 13C-labeled POC into cell biomass, for detection by DNA-SIP. Phylogenetic analysis (Figure 8) showed that the similarity of each OTU sequence could reach up to 99%–100% when aligned in the NCBI database, which implies that most of the marine microbes involved in POC decomposition and utilization were known microbial strains.
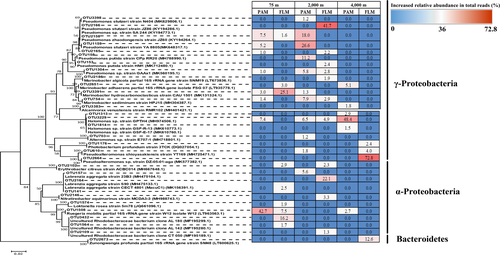
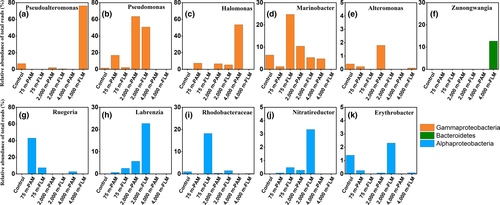
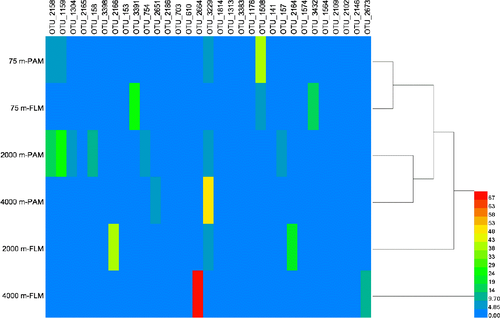
As shown in the hierarchically clustered heatmap, the active OTUs decomposing POC in PAM and FLM incubated at three different pressures and 15°C formed two distinct clusters; one for PAM and FLM incubated at atmospheric pressure (0.1 MPa), and the other for PAM and FLM incubated at high pressures (20 and 40 MPa) (Figure A6). We found that members of Alphaproteobacteria and Gammaproteobacteria were mainly responsible for POC decomposition at atmospheric pressure, whereas microbial taxa affiliated with Gammaproteobacteria predominated POC decomposition at high pressures (Figure 5). The relatively high proportion of Ruegeria (Alphaproteobacteria) appeared at atmospheric pressure in particle-associated fraction (42.9% of the total sequences), and their abundance decreased sharply with pressure. Similarly, Marinobacter showed much higher relative abundance at 0.1 MPa than at high pressures, with the maximum value of 24.7% in the free-living fraction. Pseudomonas was the most abundant taxa for POC decomposition at 20 MPa pressure in the particle-attached (63.5%) and free-living (50.7%) fractions. In addition, Labrenzia, Nitratireductor, Erythrobacter were the dominant genera at 20 MPa in the free-living fraction, with the relative abundances of 22.7%, 3.3%, and 2.3%, respectively (Figure 9). At 40 MPa, Pseudoalteromonas (76.2%) and Zunongwangia (12.7%) were the most dominant free-living taxa utilizing POC while Halomonas (53.6%) were the most abundant bacterial taxon assimilating POC in particle-attached fraction (Figure 9).
4 DISCUSSION
Diatom-derived detrital particles form a vertical POM-DOM continuum (Azam, 1998; Fang et al., 2015; Grossart, 2010; Verdugo et al., 2004) and provide important nutrient- and carbon-rich hotspots for the growth and metabolism of heterotrophic prokaryotes (Azam & Long, 2001), from the surface waters to the bathypelagic zones in the ocean. Here, we investigated the specific bacterial lineages actively participated in the POC decomposition and DOC degradation at low and high pressures under 15°C condition, and demonstrated that most of the active microbial taxa were those previously detected in organic particle decomposition and utilization.
4.1 POC decomposers, PAM or FLM?
Our results revealed that not only PAM, but also FLM decomposed diatom-derived POC and assimilated the released DOC at low and high pressures under 15°C conditions (Figures 1, 5, and 6). These results further support a previous hypothesis that PAM almost immediately attached to organic particles and secreted exoenzyme to hydrolyze POC and produce DOC (Azam & Long, 2001; Fang et al., 2015; Grossart, Tang, Kiørboe, & Ploug, 2007; Kiørboe & Jackson, 2001; Smith et al., 1992). It is important to note that, due to motility (Grossart, 2010; Grossart & Ploug, 2001) and chemotaxis (Kiørboe, Grossart, Ploug, & Tang, 2002), the FLM assemblages were also able to attach to diatom detrital particles, and produce extracellular enzyme (Grossart et al., 2007) to decompose POC and take advantage of the released DOC when PAM was absent (Figure 1). These results suggest that microbial lifestyles (i.e., particle-attached and free-living) were not strictly correlated with their ecological functions, different from the original hypothesis: PAM for decomposing POC and FLM for degrading the released DOC (Azam & Long, 2001; Fang et al., 2015; Kiørboe & Jackson, 2001). These findings also added to our current understanding that either particle-associated microorganisms (Karl et al., 1988) or free-living microorganisms (Cho & Azam, 1988) were responsible for POC decomposition.
Our DNA-SIP results revealed that POC decomposition was accomplished by members of Gammaproteobacteria, Alphaproteobacteria, and Bacteroidetes at low and high pressures (Figure 5), in agreement with findings in previous studies that these microbial taxa had the specialized capability in decomposition of phytoplankton-derived organic matter (e.g., Buchan, LeCleir, Gulvik, & González, 2014; Mayali, Stewart, Mabery, & Weber, 2016; Orsi et al., 2016; Tamburini et al., 2006; Teeling et al., 2012).
Even though the original PAM communities differed greatly from the FLM communities at phylum- or genus-level (Figures A4 and A5), much more similar microbial taxa, of both PAM and FLM, actively participated in POC decomposition (Figure 4b and Table 1). For instance, in the PAM fraction, the microbial POC decomposers were mainly affiliated with Ruegeria (43%, 0.1 MPa), Pseudomonas (63%, 20 MPa), and Halomonas (53%, 40 MPa) (Figure 6). Similarly, the FLM microbial taxa that mediated POC decomposition and degradation were dominated by Marinobacter (28%, 0.1 MPa), by Pseudomonas (49%, 20 MPa), and by Pseudoalteromonas (77%, 40 MPa) (Figure 6). This result suggests the functional commonality of microbial communities of the two lifestyles (i.e., PAM and FLM) under the conditions of this work (15°C temperature and high concentrations of substrates) (Ghiglione, Conan, & Pujopay, 2009; Hollibaugh, Wong, & Murrell, 2000; Liu, Wang, et al., 2018; Riemann & winding, 2001).
Our results indicated that most of the active microbial taxa involved in POC decomposition were dominated in either the particle-attached or free-living mode (Table A7). We hypothesize that switching of lifestyles (particle-attached vs. free-living) reflects microbial adaptation to the changing environmental conditions (e.g., hydrostatic pressure; Ghiglione et al., 2007; Moeseneder, Winter, & Herndl, 2001) and/or seeking and utilization of growth substrates (e.g., Lauro et al., 2009). For instance, the copiotrophic Marinobacter occurred in both PAM and FLM fractions and changed their lifestyle from the free-living state at atmospheric pressure to particle-attached at high pressure, and became undetectable in the FLM fraction at 40 MPa (Figure 9). This result supports the notion that a particle-attached lifestyle may be preferentially selected by deep-sea microorganisms (DeLong et al., 2006; Herndl & Reinthaler, 2013; Liu, Wang, et al., 2018). On the other hand, the four active Alphaproteobacterial taxa, Labrenzia, Rhodobacteraceae, Nitratireductor, and Erythrobacter that assimilated 13C-labeled POC seem to be presented nearly exclusively in free-living lifestyle, as do Pseudoalteromonas and Zunongwangia (Figure 9).
Our data also showed that only 7% of PAM and 10% of FLM OTUs were actively involved in POC decomposition and remineralization processes (Table A7). However, on average, 34% and 52% of the total sequences appeared in active PAM and FLM OTUs, respectively, with the overlap fractions reaching up to 31% in the two size fractions (Table A7), suggesting that particle-attached and free-living microbial communities were interacting assemblages, with active succession of lifestyles between the two (Ghiglione et al., 2009; Riemann & Winding, 2001). Our results accord with previous studies that showed high proportions of shared OTUs between PAM and FLM in the euphotic waters (25%, Crespo, Pommier, Fernández-Gómez, & Pedrós-Alió, 2013), mesopelagic waters (30%, Moeseneder et al., 2001), and bathy- and abyssopelagic waters (82%, Liu, Wang, et al., 2018).
At the OTU level, the representative OTU 1508 affiliated with Ruegeria genus assimilated more 13C-POC than other 7 OTUs in the PAM fraction at 0.1 MPa, with the relative abundance of 43% and BD shift of 0.02 g/ml (Figures 7 and 8), implying that Ruegeria probably playing an important role in POC decomposition (Reisch et al., 2013; Reisch, Moran, & Whitman, 2011). In contrast, the most abundant active OTU 3391, affiliated with Marinobacter and known for being able to degrade algae exudate (Nelson & Carlson, 2012), was responsible for POC decomposition in the FLM fraction at 0.1 MPa and accounted for 25% of the total sequences, with BD shift of 0.015 g/ml (Figures 7 and 8). OTU1159 and OTU2166 from the marine bacteria Pseudmonas were the most dominant and active taxa for POC incorporated in both particle-attached and free-living bacterial communities at 20 MPa, with the relative proportion of 27% and 42%, respectively (Figures 7 and 8). Our results are apparently different from a previous report which showed that the Pseudomonas species have limited ability to degrade high molecular weight organic matter (Fukami, Simidu, & Taga, 1981). OTU 3229 affiliated with Halomonas genus was the most dominant taxon for utilizing POC in particle-associated fraction at 40 MPa, constituting 49% of the total reads, whereas OTU2664 affiliated to Pseudoalteromonas was the most abundant group for decomposing POC exclusively in the free-living fraction, with a percentage of 73% (Figures 7 and 8). The BD shifts of active OTU3229 and OTU2664 were 0.015 and 0.013 g/ml for particle-associated and free-living bacteria at 40 MPa, respectively, much less than that at 0.1 and 20 MPa (Figure 7). By NCBI blast, we found that the OTU2664 had 100% similarity to Pseudoalteromonas sp. strain DZ-05-01-aga (MK577382.1) (Figure 8), an isolate which was identified as a macroalgae–polysaccharide-degrading bacterium (Martin et al., 2015). It has been shown that Pseudoalteromonas can produce a large number of ectoenzymes to hydrolyze POC (Chen, Zhang, Gao, & Luan, 2003; Qin et al., 2011) and high molecular weight DOC (Alonso & Pernthaler, 2005; Covert & Moran, 2001; Nelson & Carlson, 2012).
It seems likely that POC decomposition was mediated mainly by members of the “rare biosphere” (Sogin et al., 2006), those that were of a rather low abundance in the epi- and bathypelagic waters of the NBT (Ghiglione et al., 2007, 2009). For instance, the bacterial taxon Ruegeria (0% of the total community in day 0 vs 43% of the active community in day 30) at 0.1 MPa, Pseudomonas (2% vs. 63%) at 20 MPa, and Halomonas (0% vs. 53%) and Pseudoalteromonas (7% vs. 77%) at 40 MPa (Figure 6 and Figure A5). It is also possible that our incubation conditions favored microbes that prefer nutrient-rich environments (i.e., copiotrophs).
4.2 Effects of pressure and temperature on POC decomposition rates
Particulate organic carbon degradation rates of PAM and FLM were remarkably affected by hydrostatic pressure, that is, POC decomposition was accomplished primarily by PAM communities at atmospheric pressure and by FLM at high pressures (20 and 40 MPa) and temperature of 15°C (Figure 1 and Table A2). It has been assumed that the PAM assemblages had higher metabolic rates and extracellular enzyme activities than FLM in organic carbon remineralization at atmospheric pressure, which had also been observed in previous studies in the surface ocean (Fandino, Riemann, Steward, Long, & Azam, 2001; Grossart et al., 2007; Herndl & Reinthaler, 2013; Lapoussière, Michel, Starr, Gosselin, & Poulin, 2011). Recent reports claimed that the particle-attached microorganisms in the deep ocean originated from the surface water by adhering to the sinking particles (Duret, Lampitt, & Lam, 2019; Mestre et al., 2018; Thiele, Fuchs, Amann, & Iversen, 2015). When these heterotrophic prokaryotes reached to the deep ocean along with sinking particles, their extracellular enzyme activity declined significantly with elevated pressure (Liu, Fang, et al., 2018; Tamburini et al., 2006); therefore, POC degradation rate by PAM at atmospheric pressure was usually higher than that at high pressure (Tamburini et al., 2013). On the other hand, free-living bacteria, the in situ colonizers of the deep ocean, may show optimal metabolic activity for POC decomposition and remineralization under high pressure (Dang & Lovell, 2016; Lauro & Bartlett, 2008). Thus, POC degradation rates by deep-sea FLM were generally higher than by PAM. In addition, some previous studies noted that particle-attached bacteria were typical copiotrophs which can grow rapidly under high nutrient conditions such as nutrient-enriched particles in the surface waters, whereas free-living bacteria were oligotrophs that may adapt better to the bathypelagic realm (Herndl & Reinthaler, 2013; Lauro et al., 2009).
Furthermore, variations of DOC concentrations showed that DOC concentrations decreased at low pressure (0.1 MPa) and increased at high pressures (20 and 40 MPa) (Figure 1), suggesting that DOC utilization by PAM and FLM was likely less efficient at higher pressures than at atmospheric pressure under 15°C condition. These results also revealed that microbial decomposition of POC was accompanied by the release of DOC, and that there was a tight coupling between POC decomposition and DOC utilization (Azam & Long, 2001; Fang et al., 2015).
It must be emphasized that in the present study, we set 15°C as the incubation temperature, much higher than the in situ temperature of the deep sea (around 2°C), in order to produce enough biomass for subsequent analysis. Previous studies also reported that increasing incubation temperature generally increased bacterial activity and metabolism, and could significantly improve bacterial growth and carbon utilization (Middelboe & Lundsgaard, 2003; Pomeroy & Wiebe, 2001). Other findings showed that increasing temperature would enhance the adhesive properties of marine microbes (Garrett, Bhakoo, & Zhang, 2008), facilitating bacteria attachment to particles. Elevated temperature may also increase the rate of enzymatic reactions, thus, the hydrolytic activity of ectoenzymes that secreted mainly by particle-attached bacteria can be enhanced (see e.g., Garrett et al., 2008), further increasing the efficiency of microbial decomposition of POC and degradation of DOC (Middelboe & Lundsgaard, 2003). Thus, it is likely that the measured POC degradation rates were higher than the actual rates in the bathypelagic zone of the NBT. Future studies should focus on how temperature affects microbial-mediated POC degradation rates and microbial exoenzymatic activities.
4.3 Pressure effects on active PAM and FLM communities involved in POC decomposition
Hydrostatic pressure significantly affected particle-attached and free-living microbial communities responsible for POC decomposition and DOC degradation (see Figures 5, 6 and 9, and Figure A6). The microbial communities incubated at atmospheric pressure (0.1 MPa) and high pressures (20 and 40 MPa) formed two distinct clusters (Figure A6).
The members of Gammaproteobacteria (e.g., copiotrophic genera Halomonas, Marinobacter, and Pseudoalteromonas) were mainly POC decomposers at high pressures (20 and 40 MPa) (Figures 5, 6, and 9). Similarly, a series of the latest findings demonstrated that the PAM and FLM communities were dominated by Gammaproteobacteria (e.g., Colwellia, Moritella, Shewanella, Alteromonas, Halomonas, Pseudoalteromonas, and Marinobacter) in the bathypelagic zone of the Pacific Ocean (Boeuf et al., 2019), the New Britain Trench (Liu, Wang, et al., 2018) and the global ocean (Salazar et al., 2016), the abyssopelagic zone of the Puerto Rico Trench (Eloe et al., 2011), the bottom waters of the Mariana Trench and the Kermadec Trench (Peoples et al., 2018). Other studies also revealed that high pressure led to the increase in the relative abundance of Gammaproteobacteria in prokaryotic assemblages when incubated with diatom detritus (Tamburini et al., 2006) or sinking fecal pellets (Tamburini et al., 2009), which were consistent with our study.
On the other hand, members of Alphaproteobacteria (genus Ruegeria) and Gammaproteobacteria (genus Marinobacter) dominated the diatom-associated and free-living POC decomposers at atmospheric pressure (Figures 5, 6, and 9). However, previous reports indicated that particle-attached and free-living bacteria were mainly affiliated with Bacteroidetes, Gammaproteobacteria, and Alphaproteobacteria during diatom or dinoflagellate blooms (Bidle & Azam, 2001; Fandino et al., 2001; Grossart, Levold, Allgaier, Simon, & Brinkhoff, 2005).
Nevertheless, Marietou and Bartlett (2014) investigated the effects of pressure on coastal bacterial community, and reported that the relative abundance of Alphaproteobacteria increased significantly with pressure while Gammaproteobacteria dominated the microbial communities at atmospheric pressure, in opposition to our observations in this study. The microbial communities may be originated from the water column of the open ocean (the NBT), significantly different from those in the California coastal water. Other contributing factors may include the incubation conditions, such as temperature (15°C in our study) and pressure.
The effects of incubation temperature on PAM and FLM communities for POC decomposition must be considered here. It has been demonstrated that temperature plays an important role in shaping the microbial community structure in the ocean. For instance, an investigation showed that the shallow coast-water microbial community formed two distinct clusters when incubated at 3 and 16°C at atmospheric pressure (Marietou & Bartlett, 2014). Therefore, the higher temperature (than in situ) incubations may change the community structure of PAM and FLM. Future studies should investigate how temperature affects the active microbial community structure involved in POC decomposition.
4.4 Limiting factors for the DNA-SIP approach and caveats of this study
The success of the DNA-SIP method depends on several factors among which incorporation of the isotopically labeled substrate into targeted macromolecules (e.g. DNA, RNA) is critical (Liu, Wawrik, & Liu, 2017; Radajewski, Mcdonald, & Murrell, 2003). One of the challenges is the incubation times and conditions that mirror the in situ environmental conditions (Neufeld, Wagner, & Murrell, 2007). As microbial DNA replication requires cell division, unlike using PLFA- or RNA-SIP, a successful DNA-SIP experiment requires sufficient cell division in the presence of isotopically labeled substrate for separation of labeled DNA from nonlabeled DNA (Neufeld, Dumont, Vohra, & Murrell, 2007; Neufeld, Wagner, et al., 2007). On the other hand, piezophilic and piezotolerant bacterial growth at in situ temperature and pressure conditions is typically rather slow (Fang et al., 2003, 2006). For these reasons, we added relatively high concentrations of growth substrate and incubated the PAM and FLM for 30 days at in situ pressure, but at 15°C, until early stationary phase, to generate high enough biomass.
Our results showed that sufficient isotopic labeling of nucleic acids relative to unlabeled substrates has been achieved. However, the long incubation time could have likely led to the cross-feeding of metabolic byproducts and microbial community shifts (Neufeld, Dumont, et al., 2007; Wang et al., 2015). Cross-feeding is one of the intercellular interactions among microbes to maintain the stability and ecological functions of microbial communities and can exist in any environment (Pande et al., 2016; Seth & Taga, 2014). Additionally, long incubation time often provides greater isotope incorporation, but at the same time, may result in the bottle effect. Previous work has shown that within a few hours, the bottle effect is seen for microbes (Lee & Fuhrman, 1991). In essence, this and other closely related microbiological interactions (e.g., producers and cheaters in microbial extracellular enzyme production and substrate utilization, Allison & Vitousek, 2005) warrant further exploitation in future DNA- or RNA-SIP studies.
In our experiment, we initially separated the total microbes into the PAM and FLM fractions and incubated the separated microbes with the 13C-labeled and unlabeled diatomic particulates. However, PAM and FLM assemblages were not separated after 30-days incubation. Indeed, there can be microbial successions (attachment and de-attachment to and from the particles) during the incubation. Thus, the specific roles of PAM and FLM in POC decomposition and DOC utilization cannot be exclusively specified in our study. Nevertheless, we used the sensitive SIP method to target both PAM and FLM communities simultaneously and overcome the limitation of their slow growth, to detect the potential primary players in POM decomposition and DOM degradation at low and high pressures under 15°C condition. The high degree of 13C-enrichment, evidenced by the BD shift (0.013–0.02 g/ml) of the fractionated DNA (Table A5) and the 13C-labeled POC utilization by PAM and FLM communities (Table A3), indicates the active 13C incorporation into bacterial DNA.
5 CONCLUSIONS
- A total of 14 active particle-attached and free-living bacterial taxonomic groups that actively participated in decomposition and assimilation of diatom-derived POM were identified. Both the particle-attached and free-living microorganisms were able to decompose POC and assimilate the released DOC.
- POM decomposition process appears to be significantly influenced by hydrostatic pressure, accomplished primarily by particle-attached microorganisms at atmospheric pressure and by free-living microorganisms at high pressure. Overall, the POC degradation rates were higher at low pressure than at high pressure. However, similar bacterial taxa in both the PAM and FLM assemblages were involved in POC decomposition and DOC degradation, suggesting the decoupling between microbial lifestyles and ecological functions.
- It appears that the microbial taxa actively involved in POC decomposition and degradation were typical of relatively low abundance among those that can perform the same function in processing organic matter in the pelagic zones, reflecting the functional redundancy of microbial communities in both the surface and deep waters of the ocean. Our study highlights the connectivity between microbial lifestyles (i.e., PA or FL) and POC degradation processes in the ocean.
ACKNOWLEDGEMENTS
This work was supported by the National Natural Science Foundation of China (Nos. 91951210, 41673085, 41773069), by the National Key R&D Program of China (Grant No. 2018YFC0310600), and by the International Exchange Program for Graduate Students, Tongji University (No. 20171115). We thank the captain and crew of the M/V Zhang Jian for assistance in sampling. We also thank Dongmei Wang for help in the execution of the SIP experiments.
CONFLICT OF INTEREST
None declared.
AUTHOR CONTRIBUTIONS
Ying Liu: Data curation (lead); formal analysis (lead); investigation (lead); methodology (lead); software (lead); writing-original draft (lead); writing-review & editing (equal); Jiasong Fang: Conceptualization (lead); funding acquisition (lead); project administration (lead); resources (lead); writing-review & editing (equal); Zhongjun Jia: formal analysis (equal); methodology (equal); software (equal); review & editing (equal); Songze Chen: formal analysis (equal); methodology (equal); software (equal); validation (equal); writing-review & editing (equal); Li Zhang: conceptualization (equal); funding acquisition (equal); project administration (equal); Wei Gao: data curation (equal); software (equal); writing-review & editing (equal).
ETHICS STATEMENT
None required.
APPENDIX A
| Depth (m) | Temperature (°C) | Salinity (PSU) | Oxygen (mg/L) | POC (mg/L) | Bacterial abundance (cells/ml) |
|---|---|---|---|---|---|
| 75 | 27.2 | 35.1 | 5.6 | 0.02 | 1 × 10⁵ |
| 2,000 | 2.3 | 34.6 | 3.8 | 0.02 | 1 × 10⁴ |
| 4,000 | 2.0 | 34.7 | 4.7 | 0.01 | 1 × 10⁴ |
| Pressure (MPa) | Time (day) | The concentration of 13C-POC | The concentration of 12C-POC | ||||||
|---|---|---|---|---|---|---|---|---|---|
| PAM (mg/L) | FLM (mg/L) | PAM (mg/L) | FLM (mg/L) | ||||||
| Mean | POC Degradation Rate (μmol C L−1 day−1) | Mean | POC Degradation Rate (μmol C L−1 day−1) | Mean | POC Degradation Rate (μmol C L−1 day−1) | Mean | POC Degradation Rate (μmol C L−1 day−1) | ||
| 0.1 | 0 | 54 | 0.025 | 47.5 | 0.012 | 65.1 | 0.028 | 55.7 | 0.028 |
| 30 | 25.7 | 33.5 | 28.4 | 23.9 | |||||
| 20 | 0 | 55.6 | 0.011 | 53.2 | 0.018 | 50.4 | 0.016 | 51.0 | 0.011 |
| 30 | 40.4 | 31.3 | 31.5 | 36.5 | |||||
| 40 | 0 | 53.3 | 0.009 | 71.2 | 0.021 | 55.4 | 0.006 | 57.3 | 0.030 |
| 30 | 40.5 | 38.1 | 46.8 | 23.4 | |||||
| Pressure (MPa) | Time (day) | The concentration of 13C-DOC | The concentration of 12C-DOC | ||
|---|---|---|---|---|---|
| PAM (mg/L) | FLM (mg/L) | PAM (mg/L) | FLM (mg/L) | ||
| 0.1 | 0 | 18.3 | 15.0 | 103 | 81 |
| 30 | 10.9 | 12.4 | 55 | 50 | |
| 20 | 0 | 17.8 | 15.2 | 77 | 81 |
| 30 | 29.9 | 28.2 | 161 | 142 | |
| 40 | 0 | 16.2 | 18.6 | 78 | 80 |
| 30 | 31.0 | 25.8 | 132 | 158 | |
| (a) | |||||||||
|---|---|---|---|---|---|---|---|---|---|
| Treatments | Depth (m) | The δ13C value of POC and DOC in PAM culture system at day 30 | The δ13C value of POC and DOC in FLM culture system at day 30 | ||||||
| POC | DOC | POC | DOC | ||||||
| δ13C (‰) | 13C atom (%) | δ13C (‰) | 13C atom (%) | δ13C (‰) | 13C atom (%) | δ13C (‰) | 13C atom (%) | ||
| 13C-labeled | 75 | 170,437.2 | 67.49 | 125,864.8 | 60.58 | 183,508.9 | 69.09 | 124,270.8 | 60.27 |
| 2,000 | 187,652.4 | 69.56 | 122,270.6 | 59.89 | 187,534.9 | 69.54 | 122,710.8 | 59.97 | |
| 4,000 | 196,041.6 | 70.47 | 129,673.6 | 61.28 | 175,908.1 | 68.18 | 109,681.8 | 57.28 | |
| 12C-control | 75 | 873.8 | 2.22 | 528.3 | 1.82 | 67.1 | 1.28 | 284.8 | 1.53 |
| 2,000 | 197.6 | 1.43 | 746.3 | 2.07 | 231.0 | 1.47 | 676.1 | 1.99 | |
| 4,000 | 392.1 | 1.66 | 652.8 | 1.96 | 115.9 | 1.33 | 623.0 | 1.93 | |
| (b) | |||||||
|---|---|---|---|---|---|---|---|
| Treatments | Depth (m) | The 13C atom% of DOC in PAM culture system (%) | The 13C atom% of DOC in FLM culture system (%) | ||||
| Day 0 | Day 30 | Utilization by PAM | Day 0 | Day 30 | Utilization by FLM | ||
| 13C | 75 | 71.7 | 60.58 | 11.1 | 71.7 | 60.27 | 11.4 |
| 2,000 | 71.7 | 59.89 | 11.8 | 71.7 | 59.97 | 11.7 | |
| 4,000 | 71.7 | 61.28 | 10.4 | 71.7 | 57.28 | 14.4 | |
| (a) | |||||||||||||
|---|---|---|---|---|---|---|---|---|---|---|---|---|---|
| DNA fraction | CsCl buoyant density (g/ml) | 13C-PAM | |||||||||||
| 0.1 MPa | 20 MPa | 40 MPa | |||||||||||
| 1 | 2 | 3 | Mean | 1 | 2 | 3 | Mean | 1 | 2 | 3 | Mean | ||
| 3 | 1.7479 | 6.29E+03 | 6.29E+03 | 6.29E+03 | 6.29E+03 | 6.37E+03 | 6.30E+03 | 7.32E+03 | 6.66E+03 | 3.11E+03 | 3.14E+03 | 4.33E+03 | 3.53E+03 |
| 4 | 1.7445 | 5.83E+03 | 5.83E+03 | 5.83E+03 | 5.83E+03 | 3.01E+04 | 2.53E+04 | 2.76E+04 | 2.77E+04 | 1.12E+04 | 1.11E+04 | 1.13E+04 | 1.12E+04 |
| 5 | 1.7399 | 5.13E+05 | 5.13E+05 | 5.13E+05 | 5.13E+05 | 3.93E+05 | 4.21E+05 | 4.24E+05 | 4.13E+05 | 4.05E+05 | 4.08E+05 | 3.81E+05 | 3.98E+05 |
| 6 | 1.7365 | 5.15E+06 | 5.15E+06 | 5.15E+06 | 5.15E+06 | 2.04E+06 | 2.13E+06 | 2.12E+06 | 2.10E+06 | 2.39E+06 | 2.56E+06 | 2.63E+06 | 2.53E+06 |
| 7 | 1.7331 | 1.97E+06 | 1.97E+06 | 1.97E+06 | 1.97E+06 | 9.63E+05 | 9.39E+05 | 1.01E+06 | 9.72E+05 | 6.71E+05 | 6.28E+05 | 7.02E+05 | 6.67E+05 |
| 8 | 1.7296 | 6.24E+06 | 6.24E+06 | 6.24E+06 | 6.24E+06 | 7.36E+05 | 6.26E+05 | 6.60E+05 | 6.74E+05 | 2.21E+05 | 2.08E+05 | 2.15E+05 | 2.15E+05 |
| 9 | 1.7250 | 5.54E+05 | 5.54E+05 | 5.54E+05 | 5.54E+05 | 1.06E+05 | 9.70E+04 | 1.03E+05 | 1.02E+05 | 5.54E+04 | 5.76E+04 | 5.34E+04 | 5.55E+04 |
| 10 | 1.7216 | 2.55E+04 | 2.55E+04 | 2.55E+04 | 2.55E+04 | 1.02E+04 | 9.79E+03 | 8.76E+03 | 9.58E+03 | 2.79E+03 | 2.61E+03 | 2.32E+03 | 2.57E+03 |
| 11 | 1.7170 | 1.16E+04 | 1.16E+04 | 1.16E+04 | 1.16E+04 | 2.33E+04 | 2.42E+04 | 2.45E+04 | 2.40E+04 | 1.94E+03 | 1.91E+03 | 2.04E+03 | 1.96E+03 |
| 12 | 1.7135 | 1.40E+04 | 1.40E+04 | 1.40E+04 | 1.40E+04 | 2.58E+04 | 3.27E+04 | 3.16E+04 | 3.00E+04 | 3.12E+03 | 2.48E+03 | 1.28E+04 | 6.14E+03 |
| 13 | 1.7088 | 1.65E+03 | 1.65E+03 | 1.65E+03 | 1.65E+03 | 2.81E+03 | 1.80E+03 | 2.29E+03 | 2.30E+03 | 3.43E+02 | 2.42E+02 | 2.11E+02 | 2.66E+02 |
| 14 | 1.7065 | 3.26E+02 | 3.26E+02 | 3.26E+02 | 3.26E+02 | 4.59E+02 | 4.76E+02 | 5.71E+02 | 5.02E+02 | 2.88E+02 | 3.03E+02 | 3.32E+02 | 3.07E+02 |
| (b) | |||||||||||||
|---|---|---|---|---|---|---|---|---|---|---|---|---|---|
| DNA fraction | CsCl buoyant density (g/ml) | 12C-PAM | |||||||||||
| 0.1 MPa | 20 MPa | 40 MPa | |||||||||||
| 1 | 2 | 3 | Mean | 1 | 2 | 3 | Mean | 1 | 2 | 3 | Mean | ||
| 3 | 1.7479 | 2.98E+02 | 2.98E+02 | 2.98E+02 | 2.98E+02 | 3.61E+03 | 3.75E+03 | 4.57E+03 | 3.98E+03 | 3.31E+02 | 4.14E+02 | 4.85E+02 | 4.10E+02 |
| 4 | 1.7445 | 1.83E+03 | 1.83E+03 | 1.83E+03 | 1.83E+03 | 5.44E+03 | 5.38E+03 | 4.90E+03 | 5.24E+03 | 2.20E+03 | 2.05E+03 | 2.19E+03 | 2.15E+03 |
| 5 | 1.7399 | 8.72E+02 | 8.72E+02 | 8.72E+02 | 8.72E+02 | 8.36E+03 | 6.90E+03 | 8.06E+03 | 7.77E+03 | 2.83E+03 | 2.57E+03 | 2.55E+03 | 2.65E+03 |
| 6 | 1.7365 | 7.41E+02 | 7.41E+02 | 7.41E+02 | 7.41E+02 | 1.19E+04 | 1.09E+04 | 1.06E+04 | 1.11E+04 | 3.13E+03 | 2.91E+03 | 2.25E+03 | 2.76E+03 |
| 7 | 1.7331 | 6.09E+03 | 6.09E+03 | 6.09E+03 | 6.09E+03 | 2.83E+04 | 2.81E+04 | 2.56E+04 | 2.73E+04 | 2.88E+03 | 2.78E+03 | 5.00E+04 | 1.86E+04 |
| 8 | 1.7296 | 7.98E+03 | 7.98E+03 | 7.98E+03 | 7.98E+03 | 1.90E+05 | 1.93E+05 | 2.08E+05 | 1.97E+05 | 7.49E+03 | 8.01E+03 | 8.46E+03 | 7.99E+03 |
| 9 | 1.7250 | 1.28E+05 | 1.28E+05 | 1.28E+05 | 1.28E+05 | 1.96E+06 | 1.79E+06 | 1.68E+06 | 1.81E+06 | 1.02E+05 | 7.95E+04 | 7.64E+04 | 8.58E+04 |
| 10 | 1.7216 | 2.58E+06 | 2.58E+06 | 2.58E+06 | 2.58E+06 | 4.67E+06 | 4.55E+06 | 4.41E+06 | 4.55E+06 | 5.67E+05 | 5.73E+05 | 5.94E+05 | 5.78E+05 |
| 11 | 1.7170 | 4.64E+06 | 4.64E+06 | 4.64E+06 | 4.64E+06 | 2.22E+06 | 2.38E+06 | 2.55E+06 | 2.38E+06 | 3.14E+05 | 3.30E+05 | 3.22E+05 | 3.22E+05 |
| 12 | 1.7135 | 9.24E+05 | 9.24E+05 | 9.24E+05 | 9.24E+05 | 4.13E+06 | 4.22E+06 | 3.54E+06 | 3.96E+06 | 4.33E+04 | 3.95E+04 | 3.92E+04 | 4.07E+04 |
| 13 | 1.7088 | 3.60E+05 | 3.60E+05 | 3.60E+05 | 3.60E+05 | 2.18E+05 | 2.07E+05 | 2.17E+05 | 2.14E+05 | 7.85E+03 | 8.23E+03 | 5.43E+03 | 7.17E+03 |
| 14 | 1.7065 | 4.32E+03 | 4.32E+03 | 4.32E+03 | 4.32E+03 | 2.31E+03 | 2.67E+03 | 2.33E+03 | 2.44E+03 | 4.11E+02 | 4.45E+02 | 4.13E+02 | 4.23E+02 |
| (C) | |||||||||||||
|---|---|---|---|---|---|---|---|---|---|---|---|---|---|
| DNA fraction | CsCl buoyant density (g/ml) | 13C-FLM | |||||||||||
| 0.1 MPa | 20 MPa | 40 MPa | |||||||||||
| 1 | 2 | 3 | Mean | 1 | 2 | 3 | Mean | 1 | 2 | 3 | Mean | ||
| 3 | 1.7479 | 4.39E+02 | 4.88E+02 | 4.57E+02 | 4.61E+02 | 1.58E+03 | 1.79E+03 | 1.77E+03 | 1.71E+03 | 1.49E+03 | 1.72E+03 | 1.66E+03 | 1.62E+03 |
| 4 | 1.7445 | 4.96E+03 | 5.05E+03 | 5.29E+03 | 5.10E+03 | 3.53E+03 | 3.07E+03 | 3.76E+03 | 3.45E+03 | 3.40E+03 | 3.71E+03 | 3.27E+03 | 3.46E+03 |
| 5 | 1.7399 | 5.30E+05 | 5.83E+05 | 5.83E+05 | 5.65E+05 | 7.21E+05 | 8.40E+05 | 8.19E+05 | 7.93E+05 | 2.37E+04 | 2.40E+04 | 2.43E+04 | 2.40E+04 |
| 6 | 1.7365 | 2.44E+06 | 2.53E+06 | 2.74E+06 | 2.57E+06 | 5.02E+06 | 5.31E+06 | 5.10E+06 | 5.14E+06 | 2.03E+05 | 1.77E+05 | 1.87E+05 | 1.89E+05 |
| 7 | 1.7331 | 5.40E+05 | 5.53E+05 | 5.19E+05 | 5.37E+05 | 1.10E+06 | 9.51E+05 | 1.06E+06 | 1.04E+06 | 2.60E+05 | 2.36E+05 | 2.28E+05 | 2.41E+05 |
| 8 | 1.7296 | 4.04E+05 | 3.56E+05 | 3.51E+05 | 3.71E+05 | 3.82E+06 | 3.55E+06 | 3.70E+06 | 3.69E+06 | 3.34E+05 | 3.23E+05 | 3.18E+05 | 3.25E+05 |
| 9 | 1.7250 | 3.79E+04 | 2.38E+04 | 3.56E+04 | 3.25E+04 | 1.42E+06 | 1.56E+06 | 1.35E+06 | 1.44E+06 | 7.18E+04 | 8.54E+04 | 8.52E+04 | 8.08E+04 |
| 10 | 1.7216 | 5.30E+03 | 5.54E+03 | 5.60E+03 | 5.48E+03 | 1.50E+05 | 1.58E+05 | 1.46E+05 | 1.52E+05 | 2.64E+03 | 2.57E+03 | 2.34E+03 | 2.52E+03 |
| 11 | 1.7170 | 7.03E+03 | 6.31E+03 | 6.77E+03 | 6.70E+03 | 7.33E+04 | 7.18E+04 | 6.91E+04 | 7.14E+04 | 1.93E+03 | 1.92E+03 | 1.87E+03 | 1.91E+03 |
| 12 | 1.7135 | 2.90E+03 | 3.00E+03 | 2.77E+03 | 2.89E+03 | 3.57E+04 | 3.29E+04 | 3.00E+04 | 3.29E+04 | 2.70E+03 | 2.53E+03 | 2.57E+03 | 2.60E+03 |
| 13 | 1.7088 | 6.64E+01 | 8.49E+01 | 1.15E+02 | 8.88E+01 | 3.30E+03 | 3.03E+03 | 3.15E+03 | 3.16E+03 | 2.19E+02 | 1.50E+02 | 2.03E+02 | 1.91E+02 |
| 14 | 1.7065 | 2.60E+02 | 1.58E+02 | 1.74E+02 | 1.98E+02 | 1.67E+03 | 1.25E+03 | 1.24E+03 | 1.39E+03 | 1.40E+02 | 1.42E+02 | 1.11E+02 | 1.31E+02 |
| (d) | |||||||||||||
|---|---|---|---|---|---|---|---|---|---|---|---|---|---|
| DNA fraction | CsCl buoyant density (g/ml) | 12C-FLM | |||||||||||
| 0.1 MPa | 20 MPa | 40 MPa | |||||||||||
| 1 | 2 | 3 | Mean | 1 | 2 | 3 | Mean | 1 | 2 | 3 | Mean | ||
| 3 | 1.7479 | 3.31E+02 | 2.72E+02 | 3.06E+02 | 3.03E+02 | 1.35E+02 | 4.49E+01 | 7.16E+01 | 8.38E+01 | 7.63E+02 | 1.01E+03 | 7.02E+02 | 8.24E+02 |
| 4 | 1.7445 | 3.27E+02 | 3.19E+02 | 4.92E+02 | 3.79E+02 | 1.69E+02 | 8.32E+01 | 7.58E+01 | 1.09E+02 | 2.39E+02 | 2.15E+02 | 2.03E+02 | 2.19E+02 |
| 5 | 1.7399 | 6.92E+02 | 6.31E+02 | 7.06E+02 | 6.76E+02 | 1.30E+02 | 1.12E+02 | 1.52E+02 | 1.31E+02 | 1.18E+03 | 1.17E+03 | 1.27E+03 | 1.21E+03 |
| 6 | 1.7365 | 4.58E+03 | 4.65E+03 | 2.11E+04 | 1.01E+04 | 2.11E+02 | 1.61E+02 | 9.43E+01 | 1.56E+02 | 1.11E+03 | 8.85E+02 | 1.14E+03 | 1.05E+03 |
| 7 | 1.7331 | 8.57E+03 | 8.40E+03 | 7.75E+03 | 8.24E+03 | 1.07E+02 | 8.82E+01 | 7.61E+01 | 9.03E+01 | 2.11E+03 | 1.69E+03 | 1.64E+03 | 1.81E+03 |
| 8 | 1.7296 | 3.15E+04 | 2.94E+04 | 2.57E+04 | 2.89E+04 | 1.42E+02 | 6.37E+01 | 7.43E+01 | 9.33E+01 | 2.66E+03 | 2.53E+03 | 2.44E+03 | 2.54E+03 |
| 9 | 1.7250 | 8.83E+05 | 8.41E+05 | 7.15E+05 | 8.13E+05 | 8.14E+02 | 8.25E+02 | 6.70E+02 | 7.70E+02 | 9.85E+04 | 8.67E+04 | 9.08E+04 | 9.20E+04 |
| 10 | 1.7216 | 1.31E+07 | 1.25E+07 | 9.90E+06 | 1.19E+07 | 1.10E+03 | 9.84E+02 | 1.01E+03 | 1.03E+03 | 1.17E+06 | 1.11E+06 | 1.04E+06 | 1.11E+06 |
| 11 | 1.7170 | 4.54E+06 | 4.76E+06 | 4.12E+06 | 4.47E+06 | 1.33E+04 | 1.32E+04 | 1.25E+04 | 1.30E+04 | 3.39E+06 | 3.34E+06 | 3.42E+06 | 3.38E+06 |
| 12 | 1.7135 | 4.22E+06 | 4.58E+06 | 4.48E+06 | 4.43E+06 | 5.42E+03 | 4.81E+03 | 4.88E+03 | 5.04E+03 | 1.64E+06 | 1.41E+06 | 1.55E+06 | 1.53E+06 |
| 13 | 1.7088 | 1.58E+06 | 1.32E+06 | 1.31E+06 | 1.40E+06 | 1.66E+03 | 1.66E+03 | 1.38E+03 | 1.57E+03 | 2.77E+05 | 2.71E+05 | 2.47E+05 | 2.65E+05 |
| 14 | 1.7065 | 3.14E+04 | 2.20E+04 | 2.31E+04 | 2.55E+04 | 2.67E+02 | 2.36E+02 | 1.80E+02 | 2.28E+02 | 5.00E+03 | 4.43E+03 | 3.62E+03 | 4.35E+03 |
| Sample ID | 13C-labeled treatment | 12C-control treatment | CsCl buoyant density (BD) shift from 12C-control to 13C-labeled (g/ml) | ||||
|---|---|---|---|---|---|---|---|
| The maximum 16S rRNA gene copy number | The 16S rRNA gene copy number | CsCl buoyant density (g/ml) | The maximum 16S rRNA gene copy number | The16S rRNA gene copy number | CsCl buoyant density (g/ml) | ||
| 30d-0.1MPa-PAM | The 6th fraction | 5.15E+06 | 1.7365 | the 11th fraction | 4.64E+06 | 1.7170 | 0.020 |
| 30d-20MPa-PAM | The 6th fraction | 2.10E+06 | 1.7365 | the 10th fraction | 4.55E+06 | 1.7216 | 0.015 |
| 30d-40MPa-PAM | The 6th fraction | 2.53E+06 | 1.7365 | the 10th fraction | 5.78E+05 | 1.7216 | 0.015 |
| 30d-0.1MPa-FLM | The 6th fraction | 2.57E+06 | 1.7365 | the 10th fraction | 1.19E+07 | 1.7216 | 0.015 |
| 30d-20MPa-FLM | The 6th fraction | 5.14E+06 | 1.7365 | the 11th fraction | 1.30E+04 | 1.7170 | 0.020 |
| 30d-40MPa-FLM | The 8th fraction | 3.25E+05 | 1.7296 | the 11th fraction | 3.38E+06 | 1.7170 | 0.013 |
| Time (day) | PAM/FLM | Depth (m) | Reads | OTUs | Shannon | Simpson | Ace | Chao | Coverage (%) |
|---|---|---|---|---|---|---|---|---|---|
| 0 | PAM | 75 | 4,099 | 452 | 4.65 | 0.03 | 585.65 | 598.99 | 98.6 |
| 2,000 | 4,099 | 118 | 2.66 | 0.20 | 512.64 | 418.50 | 99.7 | ||
| 4,000 | 4,099 | 498 | 5.26 | 0.01 | 620.64 | 598.56 | 96.6 | ||
| FLM | 75 | 4,099 | 142 | 2.80 | 0.13 | 548.46 | 495.04 | 99.8 | |
| 2,000 | 4,099 | 92 | 2.76 | 0.12 | 433.15 | 345.59 | 99.7 | ||
| 4,000 | 4,099 | 58 | 2.10 | 0.19 | 411.76 | 266.73 | 99.7 | ||
| 30 | PAM | 75 | 4,099 | 83 | 2.11 | 0.28 | 694.88 | 440.89 | 99.8 |
| 2,000 | 4,099 | 68 | 2.37 | 0.15 | 174.47 | 120.00 | 99.6 | ||
| 4,000 | 4,099 | 69 | 1.71 | 0.32 | 554.81 | 336.56 | 99.6 | ||
| FLM | 75 | 4,099 | 70 | 2.26 | 0.17 | 517.29 | 346.15 | 99.7 | |
| 2,000 | 4,099 | 70 | 2.19 | 0.23 | 229.91 | 157.11 | 99.6 | ||
| 4,000 | 4,099 | 65 | 1.19 | 0.55 | 729.83 | 482.80 | 99.6 |
| Active OTUs in three depths | The number of active OTUs | The total OTUs in day 30 | The proportion of active OTUs (%) | The number of reads in active OTUs | The total reads in day 30 | The relative abundance of active OTUs (%) |
|---|---|---|---|---|---|---|
| Only PAM | 8 | 229 | 3% | 6,676 | 228,121 | 3% |
| Only FLM | 14 | 6% | 47,886 | 21% | ||
| Shared PAM and FLM | 9 | 4% | 70,817 | 31% | ||
| SUM | 31 | 125,379 | 55% |
| Domain | Kingdom | Phylum | Classes | Orders | Family | Active Genera | Species | Active OTUs | 0.1 MPa | 20 MPa | 40 MPa | |||
|---|---|---|---|---|---|---|---|---|---|---|---|---|---|---|
| PAM | FLM | PAM | FLM | PAM | FLM | |||||||||
| Bacteria | norank | Proteobacteria | Gammaproteobacteria | Pseudomonadales | Pseudomonadaceae | Pseudomonas | unclassified_g__Pseudomonas | OTU2158 | 7.5 | 1.6 | 18.0 | 0.0 | 0.0 | 0.0 |
| Bacteria | norank | Proteobacteria | Gammaproteobacteria | Pseudomonadales | Pseudomonadaceae | Pseudomonas | unclassified_g__Pseudomonas | OTU1159 | 5.2 | 0.0 | 26.6 | 0.0 | 0.0 | 0.0 |
| Bacteria | norank | Proteobacteria | Gammaproteobacteria | Pseudomonadales | Pseudomonadaceae | Pseudomonas | Pseudomonas_pachastrellae | OTU1304 | 1.0 | 0.0 | 5.8 | 2.8 | 0.0 | 0.0 |
| Bacteria | norank | Proteobacteria | Gammaproteobacteria | Pseudomonadales | Pseudomonadaceae | Pseudomonas | unclassified_g__Pseudomonas | OTU2165 | 1.0 | 0.0 | 0.0 | 2.2 | 0.0 | 0.0 |
| Bacteria | norank | Proteobacteria | Gammaproteobacteria | Pseudomonadales | Pseudomonadaceae | Pseudomonas | unclassified_g__Pseudomonas | OTU158 | 0.0 | 0.0 | 11.2 | 0.0 | 0.0 | 0.0 |
| Bacteria | norank | Proteobacteria | Gammaproteobacteria | Pseudomonadales | Pseudomonadaceae | Pseudomonas | unclassified_g__Pseudomonas | OTU3398 | 0.0 | 0.0 | 1.2 | 0.0 | 0.0 | 0.0 |
| Bacteria | norank | Proteobacteria | Gammaproteobacteria | Pseudomonadales | Pseudomonadaceae | Pseudomonas | unclassified_g__Pseudomonas | OTU2166 | 0.0 | 0.0 | 0.0 | 41.7 | 0.0 | 0.0 |
| Bacteria | norank | Proteobacteria | Gammaproteobacteria | Pseudomonadales | Pseudomonadaceae | Pseudomonas | unclassified_g__Pseudomonas | OTU153 | 0.0 | 0.0 | 0.0 | 2.4 | 0.0 | 0.0 |
| Bacteria | norank | Proteobacteria | Gammaproteobacteria | Alteromonadales | Alteromonadaceae | Marinobacter | unclassified_g__Marinobacter | OTU3391 | 3.0 | 25.1 | 1.3 | 0.0 | 0.0 | 0.0 |
| Bacteria | norank | Proteobacteria | Gammaproteobacteria | Alteromonadales | Alteromonadaceae | Marinobacter | Marinobacter_sediminum | OTU754 | 1.4 | 0.0 | 7.9 | 2.9 | 0.0 | 0.0 |
| Bacteria | norank | Proteobacteria | Gammaproteobacteria | Alteromonadales | Alteromonadaceae | Marinobacter | Marinobacter_adhaerens_HP15 | OTU2651 | 0.0 | 3.0 | 0.0 | 0.0 | 5.1 | 0.0 |
| Bacteria | norank | Proteobacteria | Gammaproteobacteria | Alteromonadales | Alteromonadaceae | Marinobacter | Marinobacter_algicola | OTU2186 | 0.0 | 0.0 | 0.0 | 1.9 | 0.0 | 0.0 |
| Bacteria | norank | Proteobacteria | Gammaproteobacteria | Alteromonadales | Alteromonadaceae | Alteromonas | unclassified_g__Alteromonas | OTU703 | 0.0 | 0.0 | 1.2 | 0.0 | 0.0 | 0.0 |
| Bacteria | norank | Proteobacteria | Gammaproteobacteria | Alteromonadales | Pseudoalteromonadaceae | Pseudoalteromonas | Pseudoalteromonas_shioyasakiensis | OTU610 | 0.0 | 0.0 | 1.8 | 0.0 | 0.0 | 4.0 |
| Bacteria | norank | Proteobacteria | Gammaproteobacteria | Alteromonadales | Pseudoalteromonadaceae | Pseudoalteromonas | unclassified_g__Pseudoalteromonas | OTU2664 | 0.0 | 0.0 | 0.0 | 0.0 | 0.0 | 72.8 |
| Bacteria | norank | Proteobacteria | Gammaproteobacteria | Oceanospirillales | Halomonadaceae | Halomonas | unclassified_g__Halomonas | OTU3229 | 7.4 | 0.0 | 6.5 | 4.9 | 48.4 | 0.0 |
| Bacteria | norank | Proteobacteria | Gammaproteobacteria | Oceanospirillales | Halomonadaceae | Halomonas | unclassified_g__Halomonas | OTU1814 | 0.0 | 0.0 | 0.0 | 0.0 | 1.5 | 0.0 |
| Bacteria | norank | Proteobacteria | Gammaproteobacteria | Oceanospirillales | Halomonadaceae | Halomonas | unclassified_g__Halomonas | OTU1313 | 0.0 | 0.0 | 0.0 | 0.0 | 2.9 | 0.0 |
| Bacteria | norank | Proteobacteria | Gammaproteobacteria | Oceanospirillales | Alcanivoracaceae | Alcanivorax | Alcanivorax_venustensis | OTU3383 | 0.0 | 0.0 | 0.0 | 0.0 | 1.8 | 0.0 |
| Bacteria | norank | Proteobacteria | Gammaproteobacteria | Vibrionales | Vibrionaceae | Photobacterium | Photobacterium_profundum | OTU1176 | 0.0 | 0.0 | 0.0 | 0.0 | 0.0 | 2.4 |
| Bacteria | norank | Proteobacteria | Alphaproteobacteria | Rhodobacterales | Rhodobacteraceae | Ruegeria | Ruegeria_mobilis | OTU1508 | 42.7 | 7.5 | 0.0 | 0.0 | 2.7 | 0.0 |
| Bacteria | norank | Proteobacteria | Alphaproteobacteria | Rhodobacterales | Rhodobacteraceae | Labrenzia | Labrenzia_aggregata | OTU141 | 0.0 | 2.5 | 0.0 | 0.0 | 0.0 | 0.0 |
| Bacteria | norank | Proteobacteria | Alphaproteobacteria | Rhodobacterales | Rhodobacteraceae | Labrenzia | Labrenzia_aggregata | OTU157 | 0.0 | 0.0 | 5.6 | 0.0 | 0.0 | 0.0 |
| Bacteria | norank | Proteobacteria | Alphaproteobacteria | Rhodobacterales | Rhodobacteraceae | Labrenzia | Labrenzia_aggregata | OTU2164 | 0.0 | 0.0 | 0.0 | 22.1 | 0.0 | 0.0 |
| Bacteria | norank | Proteobacteria | Alphaproteobacteria | Rhodobacterales | Rhodobacteraceae | Loktanella | unclassified_g__Loktanella | OTU1574 | 0.0 | 1.9 | 0.0 | 0.0 | 0.0 | 0.0 |
| Bacteria | norank | Proteobacteria | Alphaproteobacteria | Rhodobacterales | Rhodobacteraceae | unclassified Rhodobacteraceae | unclassified_f__Rhodobacteraceae | OTU3432 | 0.0 | 16.2 | 0.0 | 0.0 | 0.0 | 0.0 |
| Bacteria | norank | Proteobacteria | Alphaproteobacteria | Rhodobacterales | Rhodobacteraceae | unclassified Rhodobacteraceae | unclassified_f__Rhodobacteraceae | OTU1564 | 0.0 | 1.7 | 0.0 | 0.0 | 0.0 | 0.0 |
| Bacteria | norank | Proteobacteria | Alphaproteobacteria | Rhodobacterales | Rhodobacteraceae | unclassified Rhodobacteraceae | unclassified_f__Rhodobacteraceae | OTU2109 | 0.0 | 0.0 | 0.0 | 1.3 | 0.0 | 0.0 |
| Bacteria | norank | Proteobacteria | Alphaproteobacteria | Sphingomonadales | Erythrobacteraceae | Erythrobacter | Erythrobacter_citreus | OTU2102 | 0.0 | 2.9 | 0.0 | 2.3 | 0.0 | 0.0 |
| Bacteria | norank | Proteobacteria | Alphaproteobacteria | Rhizobiales | Phyllobacteriaceae | Nitratireductor | uncultured_bacterium_g__Nitratireductor | OTU2146 | 0.0 | 0.0 | 0.0 | 3.3 | 0.0 | 0.0 |
| Bacteria | norank | Bacteroidetes | Flavobacteriia | Flavobacteriales | Flavobacteriaceae | Zunongwangia | Zunongwangia_profunda_SM-A87 | OTU2673 | 0.0 | 0.0 | 0.0 | 0.0 | 0.0 | 12.6 |
Open Research
DATA AVAILABILITY STATEMENT
The raw sequence datasets of the bacterial 16S rRNA gene from this project have been deposited at the National Center for Biotechnology Information (NCBI) Sequence Read Archive (SRA) with accession numbers SRR6027268 to SRR6027351 from DNA-SIP. The nucleotide sequences of 16S rRNA gene of PAM and FLM in the water column of the NBT have been deposited at the NCBI database with accession numbers SRR6031465 to SRR6031470.


