Enhanced Microstructural Uniformity in Sulfuric-Acid-Treated Poly(3,4-Ethylenedioxythiophene):Poly(Styrene Sulfonate) Films Using Raman Map Analysis
Abstract
Poly(3,4-ethylenedioxythiophene):poly(styrene sulfonate) (PEDOT:PSS) films have emerged as potential alternatives to indium–tin oxide as transparent electrodes in optoelectronic devices because of their superior transparency, flexibility, and chemical doping stability. However, pristine PEDOT:PSS films show low conductivities because the insulating PSS-rich domains isolate the conductive PEDOT-rich domains. In this study, the conductivities and corresponding spatially resolved Raman properties of PEDOT:PSS thin films treated with various concentrations of H2SO4 are presented. After the PEDOT:PSS films are treated with the H2SO4 solutions, their electrical conductivities are significantly improved from 0.5 (nontreated) to 4358 S cm−1 (100% v/v). Raman heat maps of the peak shifts and widths of the Cα═Cβ stretching mode are constructed. A blueshift and width decrease of the Cα═Cβ Raman mode in PEDOT are uniformly observed in the entire measurement area (20 × 20 µm2), indicating that microstructural transitions are successfully accomplished across the area from the coiled to linear conformation and high crystallinity upon H2SO4 treatment. Thus, it is proved that comprehensive Raman map analysis can be easily utilized to clarify microstructural properties distributed in large areas induced by various dopants. These results also offer valuable insights for evaluating and optimizing the performance of other conductive thin films.
1 Introduction
Transparent electrodes play significant roles in various optoelectronic devices, including solar cells, displays, and light-emitting diodes.[1] Indium–tin oxide (ITO) is a commonly used transparent electrode.[2] However, indium is expensive and the mechanical brittleness of ITO makes it unsuitable for flexible and foldable electronics applications.[3] Thus, extensive studies have targeted alternative conductive materials, such as graphene, carbon nanotubes, and conductive polymers, as potential replacements for ITO.[4] Among these alternatives, poly(3,4-ethylenedioxythiophene):poly(styrene sulfonate) (PEDOT:PSS) has emerged as a promising material across a wide range of industrial applications.[5]
PEDOT:PSS has a superior transparency to ITO and is exceptionally flexible and chemically stable. Recently, it has widely been studied for an efficient protection and hole transport layer in hybrid perovskite solar cells.[6] In addition, PEDOT:PSS is also considered to be a significant material for the commercialization of hybrid perovskite solar cells.[7] However, pristine PEDOT:PSS films show low conductivities, typically less than 1 S cm−1, because the insulating PSS-rich domains isolate the conductive PEDOT-rich domains.[8] To address this issue, polar organic solvents, such as dimethyl sulfoxide (DMSO) and ethylene glycol (EG), can be added to the PEDOT:PSS aqueous solution prior to film deposition.[9] For example, adding DMSO and EG increases the conductivities from a few to 400 and 700 S cm−1, respectively.[10] In addition, the post-treatment of PEDOT:PSS films with acids is also effective in improving their conductivities.[11] Kim et al. demonstrated a remarkable improvement to 4380 S cm−1 using H2SO4 treatment.[12]
The post-treatment of PEDOT:PSS films with H2SO4 leads to the phase separation of PEDOT and PSS and the reduction of excess unbound PSS. In detail, PEDOT:PSS films exhibit a Coulombic interaction between the positive charge of PEDOT and negative SO3− charge of the PSS unit (Scheme 1a). Treatment with highly concentrated H2SO4 induces autoprotolysis that produces H3SO4+ and HSO4− ions. They can bind to the negative and positive charges of PSS and PEDOT, respectively, leading to the stabilization of the phase separation of PEDOT and PSS. In addition, the unbound hydrophilic PSS can be washed by the treatment. Consequently, post-treatment facilitates the nanofibrillar formation of PEDOT:PSS in crystallographic and morphological structures (Scheme 1b).[12] In this process, the coiled benzoid conformation of the PEDOT transforms into the quinoid structure that favors a linear conformation as the concentration of H2SO4 increases.[13] This structural transformation leads to an increase in conductivity owing to the improved charge-transport pathway by dense π–π stacking of PEDOT chains.[14]

Previous Raman studies have extensively investigated the effect of various material treatments on the structural properties of PEDOT:PSS by identifying specific vibrational modes and peak shifts in Raman spectra.[15] However, there has been an apparent lack on the microstructural homogeneity of the films, which is crucial to achieve high electrical conductivities in PEDOT:PSS system. In this study, we employed Raman map analysis to unveil detailed spatially resolved information regarding the molecular structures and crystallinities of PEDOT:PSS films, which were treated with various concentrations of H2SO4. Our Raman heat maps successfully show that the microstructural uniformity is correlated to the conductivities of the films across the entire measurement area (20 × 20 µm2). These results offer valuable insights for evaluating and optimizing the performance of other conductive thin films.
2 Results
The electrical properties of pristine and H2SO4-treated PEDOT:PSS films were investigated. Figure 1 shows the thicknesses and conductivities of PEDOT:PSS films post-treated with different concentrations (0%, 20%, 40%, 60%, 80%, and 100%) of H2SO4. The thicknesses of the films treated with 60%, 80%, and 100% H2SO4 were 63, 27, and 23 nm, respectively. The film thicknesses decreased with increasing H2SO4 concentrations because PSS was separated from PEDOT by H2SO4 and washed away by the deionized water, which increases the density of PEDOT in the films.[11, 16] However, the thicknesses of the films treated with 20% and 40% H2SO4 were 97 and 101 nm, which were thicker than that of the pristine film (84 nm). This suggests that the observed result is related to the swelling due to the hydrophilic nature of the excess PSS. In addition, water molecules are easily adsorbed on the sulfonate groups of the PSS shell, causing further swelling.[17] Thus, only a small amount of PSS was removed with low concentrations (≤40%) of H2SO4 treatment, and the residual excess PSS in the film caused water uptake and volumetric expansion.[18] Post-treatment at higher concentrations increased the hydrophobicity of the film, which suppressed the absorption of water. In addition, the effect of H2SO4 post-treatment on the surfaces of the films was confirmed with atomic force microscopy (AFM) images (Figure S1, Supporting Information). The phase separation of PEDOT and PSS caused by acid treatment was observed in the surface morphology of the film. As PSS was eliminated by H2SO4 (40–80% concentrations), agglomerated particles of PEDOT became visible on the surface.[19] At an H2SO4 concentration of 100%, the film had a relatively smooth surface.
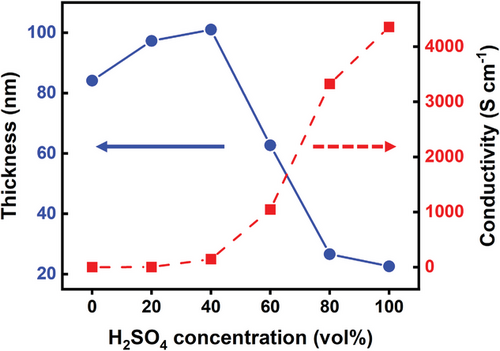
The conductivities of the PEDOT:PSS films treated with 0%, 20%, 40%, 60%, 80%, and 100% concentrations of H2SO4 were 0.5, 0.8, 145, 1046, 3323, and 4358 S cm−1, respectively. The conductivities increased with the increase of H2SO4 concentration, indicating a more linear π-conjugated PEDOT:PSS structure. At higher H2SO4 concentrations (≥80%), the delocalization of PEDOT chains and structural rearrangement into nanofibrils increased the charge-carrier mobility, leading to improved electrical conductivities.[20] In contrast, the films treated with lower concentrations of H2SO4 (≤40%) exhibited lower conductivities. This implies that these lower concentrations of H2SO4 are not enough for optimal generation of linearly stacked PEDOT:PSS domains. It leads to the increase of the π–π stacking distance between adjacent PEDOT chains by the swelling, resulting in the lower conductivities.[21]
Figure 2a shows UV–vis absorption spectra with an absorption band corresponding to the PEDOT oxidation state at ≈800 nm, which is associated with a polaron formation of the PEDOT chain.[22] Interestingly, the films treated with a high H2SO4 concentration (≥80%) showed an increased absorbance at ≈800 nm, presenting a notable enhancement in the polaron density. Furthermore, the intense absorption peak observed at ≈225 nm is attributed to the π–π* transition of the aromatic ring of PSS.[23] Thus, the absorbance decrease after the treatment with high H2SO4 concentrations shows the phase separation of PEDOT:PSS and the decrease in the residual PSS density.
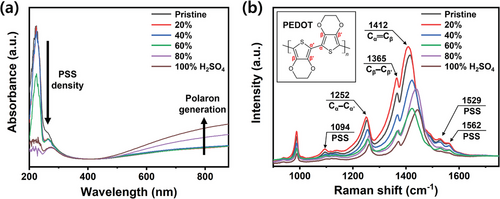
Figure 2b shows the Raman spectra of PEDOT:PSS thin films post-treated with H2SO4. The Raman peaks at 1252, 1365, and 1412 cm−1 are assigned to the Cα─Cα’ inter-ring, Cβ─Cβ’, and Cα═Cβ symmetrical stretching vibrational modes of PEDOT, respectively.[24] The peaks at 1094, 1529, and 1562 cm−1 are the vibrational modes of PSS, showing that Raman intensity of the peak decreases markedly with H2SO4 treatment concentrations above 40%. This result shows a significant reduction in the density of the residual excessive PSS domains, and the removal of most unbound PSS results in higher conductivities.[25]
The band at 1412 cm−1 (Cα═Cβ stretching vibrational mode) shows prominent differences in intensity with the H2SO4 concentrations. Recent Raman studies on PEDOT have shown that this vibrational mode is sensitive to the linearity of the backbone, which is correlated to the delocalization of π-conjugated electrons in PEDOT.[14] In other words, the central frequency and full-width at half maximum (FWHM) of the Cα═Cβ Raman mode are sensitive to the distribution of structural isomers with different conjugation lengths. Moreover, uniformity plays a critical role in achieving high electrical performances in devices based on PEDOT:PSS films. Thus, to measure the spatial uniformity of the thin film, we constructed Raman maps of the central frequency and FWHM of the Cα═Cβ stretching vibrational mode at 1412 cm−1.
Figure 3 shows the Raman central frequency heat maps of the peak at 1412 cm−1 in the PEDOT:PSS films treated with various concentrations of H2SO4. They were acquired at 400 microspots (20 × 20 µm2). The pristine film untreated with H2SO4 has an average central frequency of 1412 cm−1, indicating the dominance of the coiled conformation (Figure 3b).[24] A significant redshift was observed with 20% H2SO4 at 1407.3 (± 0.04) cm−1 (Figure 3c). This implies that the PEDOT chains have the highest level of structural entanglement, which still suppresses the development of efficient charge-carrier pathway (Figure 1). However, at higher H2SO4 concentrations (≥40%), the peaks shift to higher frequencies with increasing concentrations (Figure 3d–g), indicating a transition to an extended coil or linear conformation.[26] In this regime, the thiophene rings of PEDOT are nearly coplanar, showing that the π-conjugated electrons are highly delocalized throughout the chain, which improves the conductivity.[27] Interestingly, the films showed uniform Raman shifts over the entire area, corresponding to each H2SO4 concentration. This suggests that the initial structural homogeneity cannot be significantly affected by the H2SO4 treatment.
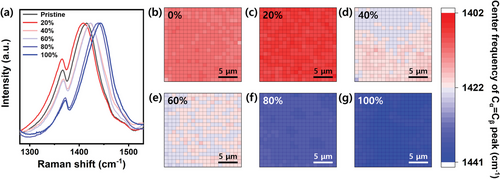
Figure 4 shows Raman FWHM heat maps, which visually provide the distributions of structural conformations induced by the H2SO4 post-treatment. In Figure 4b–d, the widths of the films treated with 20% and 40% H2SO4 were uniformly measured to be ≈79 (± 0.05) and ≈77 (± 0.06) cm−1, respectively, which are broader than that of the pristine film (≈74 (± 0.05) cm−1). A broader FWHM indicates a larger distribution of isomers or crystalline disorder.[28] Consequently, these findings present reduced crystallinities compared to that of the pristine film, which can be attributed to the swelling of PSS. Because the films treated with low H2SO4 concentrations (≤40%) still contain excessive PSS domains, they can cause further structural disorder by absorbing water.

However, above 40% concentrations, the linewidths correspondingly become narrow as the concentration increases (Figure 4e–g). Notably, the narrowest linewidth was measured to be 69.6 (± 0.06) cm−1 at 100% H2SO4. In this configuration, the smallest amount of PSS acts as a counter ion to acid-treated PEDOT, resulting in highly crystallized nanofibrils and, thus, enhanced conductivities.[12] Our Raman FWHM maps successfully demonstrate that the quinoid transformation of PEDOT:PSS occurs uniformly across the entire measurement area by H2SO4 treatment, as evidenced by the narrower Raman widths observed.
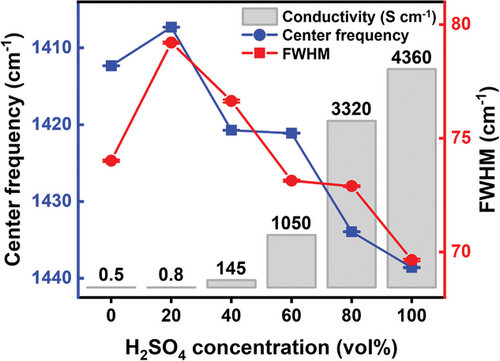
Figure 5 shows the representative central frequencies and FWHMs, as well as the standard errors averaged over the area, which are very small, indicating the high spatial uniformities in 20 × 20 µm2 in all the samples. The central frequencies were measured to be 1412.3 (± 0.04), 1407.3 (± 0.03), 1420.7 (± 0.04), 1421.1 (± 0.05), 1433.9 (± 0.05), and 1438.6 (± 0.06) cm−1 at the H2SO4 concentrations of 0%, 20%, 40%, 60%, 80%, and 100%, respectively. Compared to the pristine film, the 20% concentration of H2SO4 exhibited the frequency downshift, showing the fragmented and insufficient π-conjugation delocalization of PEDOT. The highest frequency is observed at 100% H2SO4, representing extended coil or linear conformations with higher carrier mobilities compared with that of the coiled conformation of pristine PEDOT:PSS.[20] The widths for H2SO4 concentrations of 0%, 20%, 40%, 60%, 80%, and 100% are 74.0 (± 0.05), 79.2 (± 0.05), 76.6 (± 0.06), 73.1 (± 0.05), 72.9 (± 0.04), and 69.6 (± 0.06) cm−1, respectively. The increased linewidth at 20% clearly shows the structural disorder and swelling of the PEDOT:PSS domains by the low-concentration H2SO4 treatment. Notably, the central frequency and width plots show similar decreasing patterns as the concentration increases to over 40%. The narrowest linewidth is observed at the H2SO4 concentration of 100%, suggesting a highly improved crystallinity. The H2SO4-induced higher carrier mobilities and crystallinities contribute to the enhanced conductivities.[15, 28]
3 Conclusions
In summary, we investigated the effect of H2SO4 post-treatment on the structure of PEDOT:PSS and the electrical properties using Raman map analysis. The conductivity of the PEDOT:PSS thin film was significantly enhanced from 0.5 to 4358 S cm−1 by treatment with H2SO4. The highest frequency and narrowest width of the Cα═Cβ Raman bands were observed with 100% H2SO4 treatment, which indicated that the PEDOT chains were delocalized. In addition, an improved crystallinity was noted over the entire measurement area. However, the use of low H2SO4 concentrations (<40%) resulted in broad Raman peaks and low conductivities because of disordered and swelled coil structures of PEDOT:PSS. Based on the high significance of the PEDOT:PSS system microstructures, comprehensive Raman map analysis can be easily utilized to clarify microstructural properties of π-conjugated polymers. In addition, Raman map analysis for PEDOT:PSS layer can be employed to improve the performance of next-generation perovskite solar cells and other advanced electronic devices.
4 Experimental Section
Sample Preparation
An aqueous PEDOT:PSS solution with a concentration of 1.3 wt% and weight ratio of 1:2.5 (Clevios PH1000, Heraeus) was purchased from Heraeus and kept in a refrigerator. PEDOT:PSS was spin-cast onto 2 × 2 cm2 glasses and dried at 130 °C for 10 min. PEDOT:PSS films were post-treated by immersing them in various volume ratios (0, 20, 40, 60, 80, and 100 vol%) of H2SO4 (>95%, DUKSAN) solutions for 10 min at room temperature (22 °C). Then, the films were sufficiently washed in a deionized water bath and dried at 130 °C for 10 min to remove residual water.
Characterizations
Raman spectra and maps were recorded using a Raman spectrometer (LabRAM, Horiba) equipped with a 100 × magnification objective (MPLN100XBD, Olympus) and a 30 mW@633 nm He–Ne laser. Raman scattered light was measured using a monochromator, diffraction grating (600 grooves/mm), and charge-coupled device (Syncerity 1024 × 256-OE, Horiba). The laser power irradiated on the thin film was ≈4.57 mW (9.5 W cm−2), and no laser-induced photodamage of the film was observed. Measurements were taken per 1 × 1 µm2 with an accumulation time of 0.5 s and collected to a size of 20 × 20 µm2. Raman spectra and maps were plotted using Origin 2023, and MATLAB R2022a software was used for fitting with a Gaussian amplitude function.
The thicknesses of the films were measured by a surface profiler (Alpha Step IQ, KLA Tencor). To obtain the electrical conductivity of the films, the sheet resistance was measured by a four-point probe method, and a current was applied using a Keithley 2401 source meter unit. Absorption spectra were obtained using a UV–vis spectrophotometer (UV-2600i, SHIMADZU). The surface morphology of the thin film was confirmed by AFM images using NX10 (Park Systems) in the non-contact mode.
Acknowledgements
H.K. and J.P. contributed equally to this study. This work was supported by National Research Council of Science & Technology (NST) grant by the Korea government (MSIT) (Grant No. CAP-18054-102), Industrial Strategic Technology Development Program (Program No. 20010685) funded by the Ministry of Trade, Industry & Energy (MOTIE), National Research Foundation of Korea (NRF) grant funded by Korea government (MSIT) (Grant No. RS-2023-00220748 and RS-2023-00252381), and Korea Research Institute of defense Technology planning and advancement (KRIT) grant funded by the Korea government (DAPA (Defense Acquisition Program Administration)) (Grant No. KRIT-CT-21-034, Smart CBRNe Sensor Research Laboratory, 2023). K.K. thanks for the support from National Research Foundation (NRF) of Korea (Grant No. NRF-2020R1A2C2010675 and NRF-2020R1A5A1019141).
Conflict of Interest
The authors declare no conflict of interest.
Open Research
Data Availability Statement
The data that support the findings of this study are available from the corresponding author upon reasonable request.


