Reorganization of Poly(Butylene Succinate) Containing Crystals of Low Stability
Abstract
Poly(butylene succinate) (PBS) forms small and imperfect crystals of low melting temperature at high supercooling of the melt. Slow heating allows reorganization of the obtained semicrystalline structure with the changes of the crystallinity and of the size and perfection of crystals analyzed by differential scanning calorimetry (DSC) and temperature-resolved X-ray scattering techniques. Crystals generated at 20 °C begin to melt and reorganize at a few K higher temperature with their initial imperfection and thickness unchanged upon heating to 70–80 °C. Slow heating to temperatures higher than 70–80 °C yields a distinct exothermic peak in the DSC scan, paralleled by detection of crystals of larger size/higher perfection, beginning to melt at ≈100 °C. These observations suggest that below 70–80 °C, reorganization of the semicrystalline morphology is constrained such that only minor and local improvement of the structure of crystals are possible. The formation of both perfect and thicker crystal lamellae at higher temperature proceeds via melting of imperfect crystals followed by melt-recrystallization as for PBS solid-state thickening is impossible. The study shows the limit of low-temperature reorganization processes when not involving both complete melting of crystals and rearrangement of the lamellar-stack structure.
1 Introduction
Poly(butylene succinate) (PBS) is a crystallizable aliphatic polyester which gains increasing attention because it can be fully synthesized from short-term renewable resources and because it is biodegradable, classifying it as an environment-friendly polymer.[1, 2] Related to the low glass transition temperature of ≈−35 °C,[3-6] which implies that at room temperature the amorphous phase is in its rubbery state, application of this material requires the presence of crystals. Crystals form on cooling the melt to below the equilibrium melting temperature of ≈130 °C,[5-9] with the crystallization process being fastest at ≈45 °C.[10, 11] Due to the low nuclei density, crystallization at rather high temperature allows spherulitic growth of lamellae with a thickness lower than 10 nm.[8, 12-15] With increasing supercooling of the melt, the nuclei density increases and formation of laterally extended lamellae and large spherulites becomes impossible. In contrast, on crystallization at subambient temperature, crystals organize within micrometer- or submicrometer-sized clusters.[16]
PBS crystals exhibit a monoclinic body-centered unit cell accommodating two chain repeat units.[12, 17, 18] The perfection and size of crystals decreases with decreasing crystallization temperature, as is concluded from wide-angle X-ray scattering (WAXS) patterns, revealing distinctly broadened diffraction peaks after low-temperature crystallization.[9, 16] With the present work, by using temperature-resolved WAXS, as well as small-angle X-ray scattering (SAXS), we attempt to analyze the metastability of such imperfect PBS crystals formed at low temperature on slow heating. This allows an improved interpretation of calorimetrically observed reorganization processes when evaluating the change of the perfection of crystals at the unit-cell-length scale, as well as of changes of the lamellar thickness.
In general, reorganization of crystals of low stability is a time-dependent process and is absent on heating the material faster than a critical heating rate, as confirmed by numerous independent studies.[19-24] Heating slower than the critical rate above which crystal reorganization is impossible may allow crystal reorganization by (complete or incomplete) melting and fast recrystallization of the melt.[20-27] In such a process, after melting of the original crystals or parts of them, the melt still contains a memory of the formerly ordered structures, which then serve as self-nuclei for the recrystallization process.[25, 26] Such melting and melt-recrystallization mechanism on continuous heating is often detectable by observation of multiple melting events.[28-31] In addition, on very slow heating, with the limiting case of isothermal annealing, slow local improvement of the perfection of crystals without their prior melting may occur, connected/indicated with an increase of the melting temperature, and often referred to as solid-state crystal reorganization.[16, 26, 32-36] Such processes include changes/perfection of the (internal) crystal structure,[33, 34] improvement of the fold-surface structure,[36, 37] or lamellar thickening.[38, 39] Often both processes, that is, slow improvement of the stability of crystals without melting, and melting and melt-recrystallization, may occur in sequence on heating, depending on temperature and heating rate.
For PBS containing crystals grown at 40 °C, the critical heating rate above which crystal reorganization cannot occur, is a few 104 K s−1.[40] Heating at a lower rate permits crystal reorganization, as manifested by observation of multiple melting events.[6, 7, 9, 15, 16, 40-45] Most studies focused on PBS samples crystallized at rather low supercooling of the melt at temperatures higher than 60–70 °C or on slow cooling, probably related to insufficient cooling capacity of the used instrumentation to supercool the melt highly. However, in a few works, reorganization of low-temperature crystallized PBS was analyzed.[9, 16, 40] On slow heating in differential-scanning-calorimetry (DSC) experiments, first, a rather small endothermic peak was detected a few K above the crystallization temperature, caused by beginning of melting of initially grown crystals. This melting process, we suggest, based on analysis of the melting temperature in the absence of reorganization,[40] is superimposed by exothermic re-crystallization/stabilization, with the associated net-heat-flow rate in the DSC experiment close-to-zero, fitting the interpretation of DSC curves, as suggested in the literature.[23] Then, on continued heating, a small exothermic event at distinctly higher temperature of ≈90 °C indicated a further, qualitatively different change of structure compared to the long-stretching recrystallization/reorganization process at lower temperature. The exothermic peak, finally, contiguously turned into the final endothermic melting process slightly above 100 °C.
The specific changes of structure occurring during slow heating of PBS containing crystals of low-stability are unknown, as these can include changes of their size and surface morphology, but also of internal perfection, as being parametrized in the Gibbs–Thomson equation.[19] With the application of temperature-resolved X-ray scattering techniques, we intend to shed further light on crystal reorganization, allowing, again, to assess the crystal perfection or the morphology in terms of the thickness of lamellae.
2 Results and Discussion
2.1 Crystal Structure of PBS Crystallized at Different Temperature
Figure 1a shows the temperature–time profile for preparation isothermally at different temperatures crystallized PBS films, for subsequent semi-quantitative analysis of the perfection of crystals as judged by the position of diffraction peaks. As such, the molten films, sandwiched between Teflon layers, were annealed/crystallized after their quick transfer from the compression-molding machine into a furnace, pre-heated to the temperature of interest, before quenching to ambient temperature. This route applied for crystallization temperatures above ambient temperature while crystallization at subambient temperatures involved quenching in a coolant, followed by isothermal crystallization and re-heating to room temperature. We are aware that the re-heating step to room temperature allowed crystal reorganization, not further discussed here. Figure 1b,c present WAXS diagrams, intensity as a function of the scattering angle 2θ, of the PBS films crystallized at the various temperatures in different angular ranges, for improved visibility of scattering peaks of low intensity by employing different intensity scales (see scale bars in the plots). For the sake of clarity, we vertically shifted the WAXS curves relative to each other. Red- and blue-toned curves refer to data recorded above and below room temperature, respectively.

The obtained data prove the presence of monoclinic crystals because the position of scattering peaks is in general agreement with the unit cell suggested in the literature.[18] However, we observed both disappearance of specific scattering maxima (see for example the peak in Figure 1c) and a distinct shift of peaks to lower scattering angles on lowering the crystallization temperature. For crystallization temperatures above ambient temperature, scattering peaks shifted gradually as a function of the crystallization temperature while for samples initially crystallized at subambient temperature, the shift appeared minor. The shift of peaks to lower scattering angles indicate an enlargement of the unit cell by presence of conformational defects when crystallizing at conditions associated to a high nuclei number and lowered mobility of molecule segments. In addition, we do not exclude line broadening due to growth of smaller crystals on lowering the crystallization temperature; though, a quantitative evaluation seemed complicated due to overlapping of peaks/assignment of peaks to multiple lattice planes. As the WAXS pattern of the sample crystallized at room temperature (black curve) is not much different from those crystallized at lower temperature, we selected this sample for analysis of possible reorganization of such imperfect crystals on slow heating.
2.2 Calorimetric Analysis of Reorganization of Low-Temperature Crystallized PBS on Slow Heating
Figure 2a shows apparent specific heat-capacity data of PBS, isothermally crystallized at 20 °C, as a function of temperature, obtained during heating at different rates between 1 and 20 K min−1, as indicated in the legend. The thin gray lines represent the specific heat capacity of solid (cp,solid) and liquid PBS (cp,liquid), available in the literature.[46] We used a logarithmic apparent-heat-capacity scale for improved illustration of rather small, compared to the large final melting peak, latent-heat effects associated with reorganization. In detail, the data reveal begin of endothermic melting at a temperature only slightly higher than the crystallization temperature (see vertical arrow), labeled “initial melting” below the shown curves. Melting at low temperature starts well below 50 °C; however, superimposes with exothermic reorganization. Continuous melting and reorganization occurr then in a broad temperature range up to ≈100 °C, before final melting. The effect of variation of the heating rate on the observed transitions is minor in the analyzed range from 1 to 20 K min−1 however, is in general agreement with earlier studies.[40] An increase of the heating rate leads to a shift of the initial melting event to slightly higher temperature, less pronounced reorganization, and a small decrease of the temperature of final melting. The latter observation proves that the final melting peak is associated with melting of reorganized crystals because faster heating suppresses reorganization.
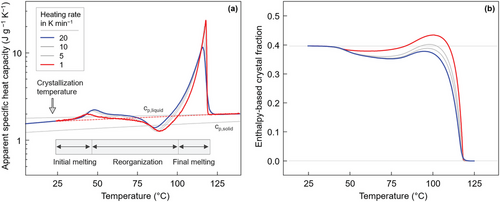
The DSC data of Figure 2a allowed estimation of the crystal fraction at the temperature of isothermal crystallization/aging at 20–25 °C, by integrating the curves from 25 °C to ≈125 °C, using a linear heat-capacity baseline (see dash red line) and bulk enthalpy of melting of 200 J g−1 for normalization. Figure 2b shows the temperature-dependence of the crystal fraction, revealing an initial enthalpy-based crystallinity of close to 40 %, a minor decrease of the crystallinity on heating up to 60–70 °C, followed by an increase of the crystallinity before final melting. Note that defective crystals, which grew at 20 °C, exhibit a lower bulk enthalpy of melting compared to crystals which formed at higher temperature. As such, the true crystal fraction at 20 °C may be slightly higher than the value calculated here. For conformationally disordered crystals, the bulk enthalpy of melting is expected to be 10–20 % lower than that of perfect crystals, referring to, for example, isotactic polypropylene or poly(l-lactic acid), which also form disordered crystals at low crystallization temperature.[47-49] We are aware of a more sophisticated enthalpy-based crystallinity-calculation route[50-52] though considering application of such evaluation scheme overprecise in the shed of light of the unknown enthalpy of bulk melting of defective crystals and its temperature dependence.
The small decrease in crystallinity below ≈60 °C is probably caused by a superposition of melting the originally formed crystals of low stability and immediate recrystallization into slightly more stable crystals. On heating, this process continues until ≈80 °C, resulting in a close to zero net heat-flow rate, and, consequently, negligible changes in the apparent specific heat capacity (see also Figure 9 in reference [23]). More specific knowledge about structural changes occurring in the reorganization-temperature-range is not available and, therefore, we applied temperature-resolved X-ray analyses, as described below. In these experiments, the applied heating rate to follow reorganization of PBS containing crystals formed at 20 °C was 1 K min−1, owing to the capabilities of the X-ray setup, justifying using such low heating rate also in DSC experimentation, which otherwise is not advised for heat-capacity measurements. As such, the use of higher heating rates in the DSC experiments described in Figure 2 mainly served to gain confidence in the observed heat-capacity data.
2.3 WAXS Analysis of Reorganization of Low-Temperature Crystallized PBS on Slow Heating
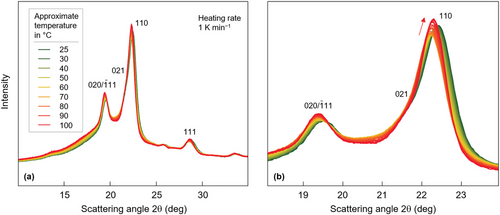
Figure 3a,b shows WAXS diagrams, intensity as a function of the scattering angle 2θ, obtained during continuous heating isothermally at 20 °C crystallized PBS films from 25 °C to 100 °C, using a rate of 1 K min−1, with panels (a,b) presenting data at different angular resolutions. The temperature increment is ≈2 K scan−1, and color-coding of curves indicates the analysis temperature, with the legend denoting only selected curves. Qualitative inspection of the data sets reveals the expected shift of peaks to lower scattering angle with increasing temperature, related to thermal expansion which, however, only is true for temperatures lower than 60–70 °C. At higher temperatures, depending on the lattice plane, the shift reverts, as indicated with the red arrow in Figure 3b for the 110 peak or changes in magnitude. Simultaneously, we observed an increase of the peak intensity and decrease of the peak width. These observations indicate major changes of the structure and, perhaps, of the fraction of crystals during heating, further evaluated below.
For separation of reversible and irreversible changes of structure during heating, associated to thermal expansion one on side and first-order phase transitions such as melting, crystallization, or reorganization on the other side, respectively, PBS containing crystals formed at 20 °C was heated at 1 K min−1 to selected temperatures and subsequently re-cooled to room temperature, before repeated X-ray analysis. Figure 4 shows with the gray curves WAXS diagrams before the heating step while the colored curves represent data obtained after re-cooling from the various maximum annealing temperatures, as indicated in the legend. As in Figure 3, panels (a) and (b) show the WAXS curves in different angular ranges, for improved illustration of changes of peak positions. The data reveal that peak positions and intensities remain nearly unchanged after heating to temperatures up to ≈70 °C while heating to higher temperature causes a major shift of scattering peaks to higher values, as indicated with the colored line for the 110 peak in Figure 4b. Simultaneously, the peak intensity increases, which together with the decreased intensity of the amorphous halo (see gray downward arrow), indicates an increase of the crystallinity.
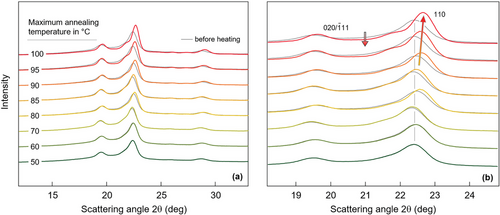
Figure 5 provides quantitative information about the change of the unit cell in selected lattice directions. Figure 5a shows the interplanar spacings d(hkl) of the (111) and (110) lattice planes as a function of temperature during continuous heating of PBS, crystallized at 20 °C, at a rate of 1 K min−1, based on sets of WAXS curves as shown in Figure 3. As such, the d-spacings increase almost linearly with temperature up to ≈70 °C (see dash lines) and then decrease on further heating to the temperature of melting. The increase of the d-spacings at low temperature is caused by (reversible) thermal expansion of the crystal lattice, with the different slope of the analyzed lattice planes related to the anisotropy of bonding. Though not in focus of the present work, for the temperature range from 25 °C to 65 °C, thermal expansion coefficients of 2.13 × 10⁻⁴ and 1.51× 10⁻⁴ K−1 for the (110) and (111) planes, respectively, are estimated by linear fitting. The change of the slope from positive to negative in a rather narrow temperature interval between ≈70 °C and 80 °C indicates that the unit-cell dimensions in the analyzed lattice directions decrease with temperature, which we interprete by an irreversible change of the crystal structure during the course of temperature-controlled reorganization. Whether the change of crystal structure proceeds via melting and melt-recrystallization, or within a solid-solid phase transformation, we discuss below.
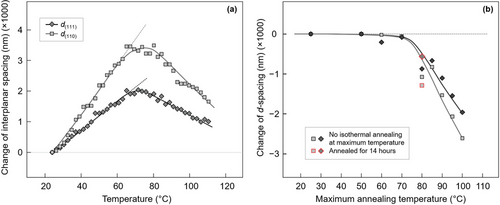
For demonstration of the (thermodynamic) irreversibility of the change of the structure/reorganization process, Figure 5b shows the interplanar spacings of the (111) and (110) lattice planes as a function of the maximum temperature the sample was exposed to, with all measurements performed at ambient temperature. This allows a direct comparison of unit-cell dimensions before and after reorganization, unaffected by thermal-expansion effects. The data prove that heating PBS containing defective crystals grown at 20 °C to ≈70 °C has no effect on the crystal structure while heating to higher temperature leads to denser crystals. The extent of reorganization of the structure seems to depend on temperature but not on time because long-term annealing at the maximum temperature did not cause a change of d-spacings, as illustrated with the red symbols representing data of a sample isothermally annealed for 14 h at 80 °C.
The dependence of d-spacings on the maximum annealing temperature is in general agreement with the dependence of the unit cell parameters on the temperature of primary (hot-) crystallization (see also Figure 1). Also in the experiment of Figure 1, the density of the unit cell increased with the crystallization temperature. In fact, in a dedicated experiment, not shown here, the crystal lattice dimension of a sample melt-crystallized at 100 °C on one side and reorganized after melt-crystallization at 20 °C by heating to 100 °C on the other side, yielded almost identical values. This coincidence may point to prevalence of melting of defective crystals followed by fast re-crystallization of the melt as dominant reorganization process above 70 °C though we do not consider it as final evidence yet.
Figure 6 provides information about the evolution of the X-ray crystallinity during heating of PBS containing defective crystals formed at 20 °C, for confirming/disconfirming enthalpy-based crystallinity-data observed by DSC (see Figure 2b). We estimated the X-ray crystallinity as the ratio of the intensity scattered by the crystalline phase and the total (crystalline and amorphous phases) scattering intensity. For illustration, Figure 6a shows a background-corrected WAXS curve of PBS, with the light- and dark-gray shaded areas representing scattering intensities associated with the crystalline and amorphous phases, respectively. As such, we approximated the amorphous-phase-scattering contribution by a so-called “Schmiegekurve”, being aware of a possible minor underestimation of the crystal-phase-scattering intensity due to losses by both thermal vibrations and lattice imperfections into the “amorphous background”.[53, 54] Therefore, we consider the obtained values as crystallinity-index or -equivalent and not as absolute crystallinity.
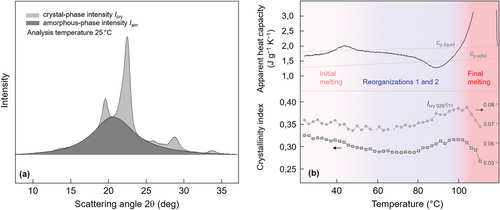
Figure 6b shows in the top part a DSC heating scan of PBS crystallized at 20 °C in apparent-heat-capacity units as a function of temperature, recorded using a rate of 1 K min−1 (black curve). This heating scan, shown already with the red curve in Figure 2a, serves here, in Figure 6b, for discussion of the WAXS-crystallinity evolution, shown in the bottom part of Figure 6b. Black squares represent crystallinity-index data calculated as described above and reveal an initial crystallinity at ambient temperature of 30–35 %. With increasing temperature, up to 60–80 °C, the crystallinity decreases a few percent, to then, on further heating, increase again before final melting, starting at ≈100 °C. The relative changes of the X-ray crystallinity with temperature confirm the evolution of the enthalpy-based crystallinity (see Figure 2b) and allow drawing further conclusions about temperature-controlled reorganization of crystals and the overall semicrystalline morphology. The initial decrease of the X-ray crystallinity on beginning of heating confirms the interpretation of the small endothermic peak slightly above 40 °C in the DSC scan as a melting peak and disfavors its interpretation as an enthalpy-recovery peak associated to a rigid amorphous phase.[41, 55] Due to the low heating rate, however, endothermic melting of crystals formed at 20 °C is incomplete and becomes superimposed by exothermic perfection (labelled ‘Reorganization 1′) up to 60–80 °C. Both these processes occur simultaneously in this temperature range, with the net heat-flow rate signal not allowing a separation of these two processes (see also Figure 9 in ref. [23]). Note, heating faster than 20 000 K s−1 allows outpacing reorganization, and, with that, unscreened detection of the melting event.[40] As shown above with Figure 5b, reorganization in this temperature-range does not involve formation of crystals with a different unit cell, with the exact nature of this reorganization-process still not identified. Such behavior, for example, also holds for conformationally disordered crystals (commonly named mesophase) of isotactic polypropylene,[56] similarly forming on quenching around room temperature, and then, stabilizing on slow heating in a wide temperature range up to ≈80 °C without detectable changes of the crystal structure.[47, 57-61] Heating PBS further to above ≈80 °C yields a distinct exothermic peak in the DSC scan (labeled ‘Reorganization 2′) and an increase of the fraction and perfection of crystals before their melting above 100 °C. We assume that between 80 °C and 100 °C, compared to temperatures below 80 °C, reorganization occurs at a longer length scale, though still in the sub-µm range, involving at least partial/local melting of the initially imperfect crystals and their recrystallization into a more ordered crystal structure, with supporting evidence that reorganization in the temperature-range of the exothermic DSC peak proceeds at the sub-µm length scale and involves melting and recrystallization provided below.
2.4 POM and SAXS Analysis of Initially Low-Temperature Crystallized PBS, Before and After Reorganization
To shed more light on the above discussed structural changes during high-temperature reorganization of PBS, initially crystallized at 20 °C and containing imperfect crystals, in the temperature range from 80–100 °C, that is, in the temperature range of observation of distinct exothermic heat flow in the DSC scan, POM and SAXS analyses were performed. Figure 7a shows the POM image of the compression-molded PBS film after crystallization at 20 °C, containing 35–40 % crystals. Crystallization led to formation of spherulites, being in general agreement with an earlier analysis of the POM structure of PBS as a function of the crystallization temperature.[16] The sample of Figure 7a was then heated slowly to 100 °C to permit reorganization, with the POM structure after re-cooling to ambient temperature shown in Figure 7b. As such, the µm-length-scale structure was unchanged compared to the initial structure, indicating that any reorganization, including the change of the crystal structure from imperfect to rather perfect, proceeds within the spherulites at the sub-µm length scale.
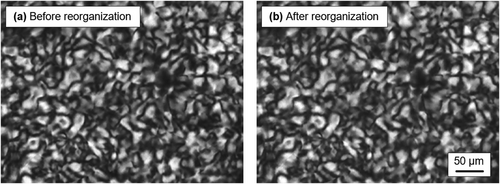
Figure 8a shows with the gray curves SAXS diagrams of PBS crystallized at 20 °C and containing imperfect crystals while the colored curves represent data obtained after slow heating at 1 K min−1 to different maximum temperatures (see legend) and immediate re-cooling to room temperature. The data served for calculation of the long period (L) from the obtained intensity maxima and of the lamellar thickness (lc), assuming presence of stacks of crystal lamellae separated by amorphous layers, shown with the squares and circles as a function of the maximum annealing temperature in Figure 8b, respectively. As such, the long period increases from an initial value, that is, before heating, of close to 7.5 nm to around 9.5 nm after heating to 100 °C and re-cooling to room temperature. The lamellar thickness is estimated assuming a linear crystallinity [= lc/L] of 0.35 (see Figures 2b and 6b)[62] and shows the same trend as the long period when plotted as a function of the maximum annealing temperature. The initial thickness of crystals of PBS crystallized at 20 °C is around 2.7 nm, however, it increases to at least 3.3 nm after heating to 100 °C. These values confirm the rather low thickness of PBS crystals.[8, 12-15, 45, 63] While determination of absolute values of both the long period and lamellar thickness in this work is out of scope, allowing admitting systematic errors, for example, when using a specific linear-crystallinity value of 0.35 for calculation of the lamellar thickness, most important is the evolution of these structure parameters with the maximum annealing temperature. At temperatures lower than ≈70 °C, changes of the long period and lamellar thickness are negligible, suggesting preservation of the overall semicrystalline morphology during low-temperature reorganization. At temperatures higher than ≈70 °C, in contrast, the strong increases of the long period and crystal thickness indicate a qualitatively different reorganization mechanism. The above suggestion of melting and melt-recrystallization, to explain in particular the observed change of the unit-cell parameters and crystal perfection, is considered strongly supported by the increase of the lamellar thickness. PBS belongs to so-called crystal-fixed polymers,[64] disfavoring lamellar thickening as a responsible process for the observed change of the crystal morphology. Therefore, the observed increase of the lamellar thickness must involve a transition of the initial,- though during low-temperature-reorganization within limits slightly perfected crystals into the liquid state before fast recrystallization, yielding thicker and more ordered crystals. Note that we assume that the increase of the lamellar thickness may even be higher than shown in Figure 8b because a possible slight increase of the crystallinity in the temperature range of the exothermic peak in the DSC scan is not considered. Further, similar as concluded from the analysis of lattice distances as a function of the maximum annealing temperature and of the annealing time for the sample heated to 80 °C (see Figure 5b; red data points), SAXS data confirm that reorganization is mainly controlled by temperature but not time, at least when monitored at the scale of hours. The red symbols in Figure 8b refer to data observed after annealing PBS at 80 °C for 14 h, not revealing further changes of the overall lamellar stack morphology.

The increase of the area of the long-period peak with increasing annealing temperature, as well as scattering intensity at lower values of the scattering vector in Figure 8a, is likely caused by both increasing crystallinity and higher electron-density contrast between the amorphous and crystalline phases.[65-67] The latter has been discussed in detail in a recent study of the effect of the density of the crystal phase on the SAXS pattern of poly(l-lactic acid).[68]
3 Conclusion
PBS forms defective crystals on crystallization at high supercooling of the melt. The metastability limit of these crystals is only slightly higher than the crystallization temperature, and slow heating allows their reorganization in a wide temperature range before finally melting above 100 °C. For crystals grown from the relaxed melt at ≈20 °C, reorganization at rather low temperatures allows only minor, as concluded from unchanged unit-cell parameters and crystal thicknesses, but steady improvements of the structure, moving their melting temperature to higher values. These intralamellar-stack improvements complete at ≈70 °C when using a heating rate of 1 K min−1, as then, on further heating, reorganization by full melting of the lamellae stack and melt-recrystallization into a stack with larger long spacing occurs. The temporary transfer of the system into the liquid state is required/necessary to allow the detected formation of thicker and more dense crystal lamellae, which otherwise cannot develop within a solid–solid phase reorganization process.
4 Experimental Section
Material and Film Preparation
An extrusion-grade PBS homopolymer with a mass-average molar mass of 123 kg mol−1, obtained from MCPP Germany GmbH, was used.[69, 70] The material was initially available in pellet-form and further processed to films of the desired crystallization history, after drying the pellets at 80 °C for 15 hours, to avoid processing-related hydrolytic degradation. For this, a special film-preparation accessory (Specac Ltd., Orpington, UK) served as a mold in a hydraulic press (LOT QD, Darmstadt, Germany), allowing preparation of films with a thickness of around 200 µm. Heating pellets of PBS to 150 °C in such mold, placed between fiberglass-reinforced Teflon sheets, yielded a relaxed melt, before shaping into a film by compression. Afterwards, the PBS/Teflon sandwich was quench-cooled in water with a temperature of 20 °C, to enforce low-temperature crystallization, and stored for long time (days to weeks) at ambient temperature between 20 and 25 °C, to assure quasi-completion of crystallization. The thermal profile used for film preparation was monitored by embedding a chromel-alumel micro-thermocouple (Omega Engineering GmbH, Deckenpfronn, Germany) into the film, to record the entire thermal history during compression-molding, quenching, and crystallization, employing a fast OM-DAQXL-1-EU data logger (Omega Engineering GmbH, Deckenpfronn, Germany). The absence of a halt point during ballistic cooling confirmed that crystallization proceeded isothermally at 20 °C.
For comparison and serving as reference in crystal-reorganization experiments, additional films were melt-crystallized at different crystallization temperatures, by quickly transferring the PBS/Teflon sheets from the press into an oven (Memmert GmbH, Büchenbach, Germany) pre-heated to the desired crystallization temperatures of 60, 80, 90, and 100 °C, and annealed to allow completion of primary crystallization. Rapid cooling of the films after the primary-crystallization step to ambient temperature suppressed non-isothermal secondary crystallization, which, however, is impossible to inhibit on storing the samples at ambient temperature.[55] Crystallization at sub-ambient temperatures was achieved by quenching the PBS/Teflon sheets in a dry ice-alcohol bath set at desired temperatures of 0, −10, and −20 °C.
Instrumentation
Differential scanning calorimetry (DSC) served for calorimetric analysis of the reorganization behavior of PBS crystallized at 20 °C on heating at rates up to 20 K min−1. We collected heat-flow-rate-raw data using a calibrated heat-flux DSC 1 (Mettler-Toledo, Greifensee, Switzerland). Specimens with a mass of 7–11 mg, cut from the films crystallized and annealed around 20–25 °C, were inserted into aluminum pans (Mettler-Toledo, Greifensee, Switzerland), and analyzed in presence of nitrogen-gas flow at a rate of 60 mL min−1. The measured heat-flow-rate-raw data, we corrected for instrumental asymmetry by subtracting a baseline, recorded at identical conditions but without placing a sample into the pan. Afterwards, the baseline-corrected sample-heat-flow rate was converted into apparent-heat capacities, using sapphire as a standard. The conversion of heat-flow-rate data into apparent heat capacities is required to detect latent-heat effects in the DSC scans, leading to deviations from the heat-capacity baseline, being available for liquid and solid PBS in the literature.[46]
Polarized-light optical microscopy (POM) served for analysis of the semicrystalline morphology of PBS at the µm-length scale, before and after reorganization of the structure. We first collected images of the as-prepared film, placed between crossed polarizers in a DMRX microscope (Leica, Wetzlar, Germany) operated in transmission mode and equipped with a 2300 CCD camera (Motic, Wetzlar, Germany). For obtaining the structure after reorganization, we heated the film at 1 K min−1 in a THMS600 hotstage (Linkam, Tadworth, UK) to 100 °C, and then collected further images after re-cooling it to room temperature.
Wide-angle X-ray analysis was employed to gain knowledge about the perfection of crystals grown at different crystallization temperatures and of the perfection of crystals formed at 20 °C, before and after slow heating. Measurements were done using CuKα radiation with a wavelength of 0.154 nm in transmission mode on a Retro-F laboratory setup (SAXSLAB, Copenhagen, Denmark) in combination with a microfocus X-ray source (AXO Dresden GmbH, Dresden, Germany) and an ASTIX multilayer X-ray optics (AXO Dresden GmbH) as monochromator. The size/area of the double-slit collimated, nearly square beam was ≈0.5 mm2. A 2D PILATUS3 R 300K detector (DECTRIS Ltd., Baden, Switzerland) served for data collection, with an exposure time of 120 s per frame. Films were isotropic which allowed azimuthal integration of Debye-Scherrer rings to obtain azimuthal averages of the scattered X-ray intensity as a function of the scattering angle 2θ. Regarding sample preparation, films were wrapped in aluminum foil and placed on the silver block of an HFS350 hotstage (Linkam, Tadworth, UK), being used as sample holder and containing a 1-mm-hole for passing the X-rays. As in case of film preparation, described above, the sample temperature during heating experiments was precisely monitored with a thermocouple (Omega Engineering GmbH, Deckenpfronn, Germany) attached to a fast OM-DAQXL-1-EU data logger (Omega Engineering GmbH, Deckenpfronn, Germany). In addition, SAXS patterns were recorded before and after reorganization experiments.
Acknowledgements
K.J. and R.A. are thankful for funding received from the Deutsche Forschungsgemeinschaft (DFG) (Grant number: AN 212/29).
Open access funding enabled and organized by Projekt DEAL.
Conflict of Interest
The authors declare no conflict of interest.
Open Research
Data Availability Statement
The data that support the findings of this study are available from the corresponding author upon reasonable request.


