Development of Flexible Polyacrylonitrile-Based Carbon Nanofibrous Yarns Through Optimization of Heat Treatment Processes
Abstract
This study presents an optimized dual-nozzle electrospinning method for fabricating high-performance carbon nanofibrous yarns (CNY). By implementing controlled uniaxial tension during oxidative stabilization, nanofiber alignment, molecular orientation, and mechanical performance are significantly improved. The effect of the uniaxial tension and heat treatment on the CNY's physical and mechanical properties was investigated using SEM, DSC, FTIR, Raman, and tensile mechanical testing. The findings demonstrate a significant improvement in tensile strength and modulus, increasing from 5.38 ± 1.41 to 40.48 ± 4.74 MPa and from 27 ± 6.11 to 297.15 ± 68.29 MPa, respectively. This represents a 659% improvement in tensile strength and a nearly 1000% increase in modulus, highlighting the efficacy of the method. Compared to previous studies, this work introduces a low-temperature, scalable, and energy-efficient process that significantly enhances the mechanical properties, positioning it as an ideal candidate for applications in wearable electronics, energy storage, and advanced composite materials. The findings establish a new benchmark in carbon nanofiber technology, offering a cost-effective and highly reproducible process for the mass production of high-strength CNYs.
1 Introduction
Carbon fiber and nanofibers are the most widely used fiber in high-performance applications. They have shown tremendous potential in many branches of industry and technology, including adsorbent (in fuel cells, lithium-ion batteries, and supercapacitors), catalysts or catalyst supports, analytical sensors, filters, amplifiers, composites, and nanoelectronics components (field-effect transistors, diodes, electrochemical capacitors, electron sources).[1-16]
Moon and Farris discuss the fabrication of strong, electrospun PAN carbon fiber yarns, emphasizing their potential applications due to their remarkable strength.[1] Zussman et al. provide insights into the mechanical and structural properties of these electrospun nanofibers, highlighting their robust characteristics and significant implications for various industrial applications.[2] In a similar vein, Zhou et al. elaborate on the development of aligned electrospun PAN nanofiber bundles, which are characterized by their microstructural, electrical, and mechanical properties, thereby further enhancing understanding of their performance.[3] Xie et al. contribute to the discourse by detailing the continuous production of PAN nanofiber yarns and subsequent treatments to achieve high-quality carbon nanofibers, shedding light on the preparation processes involved.[4] More recently, Zhang et al. investigated the effect of fiber diameter on the structural and tensile properties of electrospun PAN-based carbon nanofiber mats, showing critical correlations that can inform optimization strategies.[5] The impacts of electrospinning and post-drawing on the molecular organization and mechanical properties of PAN nanofibers were evaluated providing valuable insights for material enhancements.[6]
Yang et al. present a comprehensive overview of the preparation, modification, and applications of electrospun carbon nanofibers and their composites, discussing their potential in advanced engineering applications and future perspectives.[8]
Zhang et al. provide a review of carbon nanofibers derived from electrospun polyacrylonitrile, detailing their diverse applications across fields such as energy storage, sensors, and composites.[11] Jang et al. explore the use of carbon nanotube yarns for fiber-shaped sensors and energy storage devices, illustrating their potential in smart system applications.[12] Additionally, Din et al. discuss the role of carbon nanofibers as catalyst supports, offering insights into recent advances and future perspectives in this area.[13] The broad applications of electrospun carbon nanofibers were highlighted across various domains, suggesting their versatility and importance in material science.[14]
In general, two conventional methods were adopted to produce carbon fibers with diameters in the nanometer range; chemical vapor deposition (CVD) and electrospinning methods.[17] The CVD method, however, involved a complicated chemical and physical process and other difficulties for mass production.[1, 3, 18, 19] Despite CVD, in recent years, electrospinning has received much attention as a versatile and straightforward technique to generate fibers with diameters in the range of nanometers to submicrometer.[20] This involves a process in which a suspended droplet of a viscoelastic polymer melts or solution is uniaxially drawn under the electrostatic field. In this process, due to the helix motion of the jet, nanofibers are commonly deposited in the form of randomly oriented fiber mats. Therefore, poor mechanical and physical characteristics lead to some limitations in the use of these nanofibers.[14, 19, 21, 22] It can be expected that the interlock structure and friction between nanofibers in electrospun yarns improve mechanical and physical properties.[9, 23-25] Moreover, reducing fiber diameter is an effective way to reduce the structural imperfections in nanofibers and, consequently, improve the tensile strength and mechanical characteristics of nanofibers.[4] The subsequent post-treatment through converting PAN precursor into carbon nanofiber, including heat treatment and tension, also reduces the formation of voids and cracks within fibers.[3, 11] It is widely known that drawing of precursor fibers during thermal stabilization is extremely important for producing high mechanical strength carbon fibers due to the improvement of molecular orientation and crystallinity within fibers, i.e., if precursor fibers are subjected to heat treatment without tension, the resulting carbon fibers with poor mechanical properties.[26, 27] However, the main problem of drawing is the random orientation of fibers in the nonwovens and nanofiber bundles. Direct electrospinning of continuous nanofiber yarns can provide a promising way of drawing nanofibers effectively.[28, 29] Besides, the produced electrospun carbon nanofibers without optimized thermal treatment has mechanical properties considerably lower than expectation.[4, 7, 11, 30]
As for precursors, conventional carbon fibers are fabricated from polymeric precursors with a carbon backbone such as polyacrylonitrile, pitch, and cellulose. Other polymeric precursors, such as poly(amic acid) (PAA), polyimide (PI), polybenzimidazole (PBI), poly(p-xylenetetrahydrothio phenium chloride) (PXTC), and poly(vinyl alcohol) (PVA), have also been used.[31] The mechanical, physical, and chemical behaviors of final electrospun carbon nanofibrous fibers (CNFs) strongly depend on the structural and physical characteristics of precursor fibers. Among all precursors, PAN and AN-based copolymers were widely used in the manufacturing of carbon fibers due to their ideal features including high carbon yield (up to 60%), ease of use, and low-cost processing.[32] Semi-crystalline PAN precursor also has a glass transition temperature (Tg) in the range of 72–150 °C.[33] Above this temperature range, PAN fibers have shown viscoelastic behavior and can be drawn without failure, since the dynamics of polymer chains increase with increasing temperature.[34]
Thermal stabilization has crucial importance in obtaining high-quality carbon fibers. During the stabilization, cyclization of nitrile groups (C≡N), dehydrogenation, and crosslinking of chain molecules (─C═N─C═N─) take place and prevent the melting or fusion of the fibers.[35-39] Mechanisms of thermal stabilization reactions for PAN precursors were reported.[32, 40] Oxidative stabilization causes shrinkage, which is about a third of the overall dimension of the nanofiber.[41] The shrinkage is due to the intermolecular crosslinking and dehydrogenation reaction by molecular relaxation. This relaxation shrinkage above Tg should be well controlled by restraining the nanofiber under constant force or in a uniaxial direction during thermal stabilization.[42, 43] Nevertheless, a few articles have yet reported drawing treatments of electrospun PAN precursors during thermal stabilization for carbon fiber production.[1, 3, 4, 29] Among stabilization parameters that recognized in research, temperature has a more remarkable effect than stabilization time.[28]
The carbonization of thermally stabilized nanofibers is the next step in the process. The carbonization is carried out in an inert atmosphere containing gases such as nitrogen or Argon. In this process, the elimination of non-carbonic elements (H2, N2, O2) and other impurities is accelerated, and the carbon content of fibers is simultaneously increased.[32, 44]
Despite several investigations on PAN-derived CNFs, there is a paucity of research regarding the mechanical properties enhancement of non-composite electrospun carbon nanofibers prepared without using additional chemical substances. Zussman et al. were among the earliest to report mechanical properties of PAN-based carbon nanofibers, prepared CNF with skin-core cross-sectional structure and tensile strengths between 0.32 and 0.9 GPa and Young's modulus of 63 ± 7 GPa.[7] Moon et al. prepared carbon nanofiber yarn with an ultimate strength of ≈1 GPa through drawing, stabilization, and carbonization at 130, 200, and 1350 °C, respectively, which was about nine times greater than the reported tensile strength of the as-prepared PAN yarn.[1] Zhou et al. prepared high-strength CNF bundles with 300–600 MPa tensile strength and 40–60 GPa Young's modulus through oxidative stabilization of tightly wrapped PAN nanofiber bundle onto a glass rod and subsequent carbonization.[3] Arshad et al. reported high tensile strength and elastic modulus of 3.5 ± 0.6 and 172 ± 40 GPa for individual PAN-based carbon nanofiber through optimized carbonization at 1400 °C.[45, 46] Recently, Xie et al. reported the average strength and modules of 362 ± 37 MPa and 9.2 ± 1.4 GPa on the drawn thermally treated PAN nanofiber yarn, which increased by 800 and 1800% compared to the as-prepared yarn. However, the reported result was inferior to their expectations due to the non-optimized stabilization/carbonization condition and nanofiber structure.[4]
In this research, a novel method was developed for fabricating continuous electrospun polyacrylonitrile (PAN) yarns utilizing a custom-built drawing system that applies controlled spring tension during thermal stabilization in an air atmosphere. The stabilization temperature was optimized between 250 and 350 °C,[37] aiming to enhance fiber alignment, mechanical properties, and chemical structure. A subsequent carbonization at 740 °C further improved these properties. Using advanced techniques such as SEM, DSC, FTIR, Raman spectroscopy, and tensile testing, the effects of drawing force and stabilization temperature on the yarns' morphology, mechanical properties, and it's chemical structure were systematically investigated. The study revealed significant improvements, with tensile strength and modulus increasing by up to 659 and 1000%, respectively. This research showcases a breakthrough in carbon nanofiber technology, enhancing fiber alignment and flexibility to significantly boost performance. The findings confirm the method's potential for developing high-performance carbon nanofiber yarns, thereby laying a foundation for future advancements in flexible yarn applications.
2 Experimental
2.1 Materials
The chemical substances were used without further purification, including polyacrylonitrile (PAN, Mw 100 000 g mol−1) and N, N′-dimethylformamide (DMF, 99%) from Iran Polyacryle and Merck companies, respectively. The molecular weight is significant as it influences the viscosity of the PAN solution, which in turn affects the electrospinning process and the morphology of the resulting fibers.[11] PAN solution (15 wt.%) was prepared by dissolving PAN in DMF using a constant power magnetic stirrer at room temperature for 24 h. Then As-prepared PAN solution was placed in a 1 mL syringe. The optimal concentration was selected based on previous studies and experiments.[22]
2.2 Preparation of Electrospun Nanofiber and Yarns
The experimental setup for producing aligned PAN nanofiber webs is schematically shown in Figure 1a. In this setup, a nozzle with a flat-tipped needle (22-gauge, ID = 0.4 mm, OD = 0.7 mm) was utilized at a tip-to-collector distance of 15 cm. This syringe was fed using a digitally controlled syringe pump (TOP-5300, Japan) to provide a constant feed rate of 0.5 mL h−1 through electrospinning. DC high-voltage power supply was used to charge the needle with a value of 12 kV, and the takeup-roller speed of 15 cm in diameter was set to 1400 rpm.
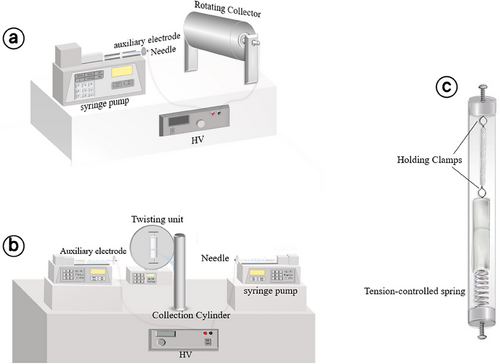
The schematic of the electrospinning setup for producing continuous twisted nanofiber yarn is presented in Figure 1b. This consists of two digitally controlled syringe pumps and the same flat-tipped needles mentioned earlier. These nozzles were positioned oppositely of each other at a distance of 18 cm. A DC high-voltage power supply was also used to charge the needles oppositely with the same value of 9 kV. Two aluminum auxiliary electrodes (4 cm diameter) were installed on needles to amplify the electric field. At a distance of 3 cm from the center of these oppositely charged nozzles, a grounded aluminum cylinder (5.9 cm diameter × 30 cm length) was placed vertically. The takeup-twister unit consists of a rotating disk with adjustable rotational speed (1–440 rpm) and a take-up roller adjusted as 1.8 cm min−1. This unit was located at a distance of 22 cm from the neutral aluminum cylinder. Before starting the electrospinning, a piece of yarn was attached between the neutral cylinder and the take-up system to form a spinning triangle on both sides of the yarn. Once the electric field was applied, the displacement of electrons resulted in a surface charge on the cylinder, which is positive on one half and negative on the other side. Therefore, electrospun nanofibers from the charged nozzles move slightly toward the part of the cylinder with the opposite charge and attach to the piecing yarn. The attached nanofibers were then twisted by rotating the yarn via the take-up unit. Moreover, the twist level of electrospun yarns was set in the range of 3000–3100 TPM. All electrospinning processes were performed under environmental conditions.
2.3 Drawing Treatment
To increase the orientation of precursor molecules, and decrease the void content in electrospun yarns, the PAN nanofiber yarns were subjected to the drawing system with an 8 cm gauge length that is shown in Figure 1c. In this system, the electrospun yarns were efficiently drawn by the extension of the installed spring (K constant≈256.68 MT−2) according to Hooke's law and the average displacement of the spring's end from its equilibrium position (ΔX≈1.1 cm), the drawing force was calculated at ≈2.82 N. The mechanical properties of the drawn PAN yarns were compared to the untreated PAN non-wovens and later to their stabilized and carbonized properties.
2.4 Stabilization and Carbonization
Stabilization and low-temperature carbonization were conducted in a tubular furnace. The drawing system containing PAN yarns was placed inside this furnace, and a constant airflow was maintained during the thermal stabilization. Therefore, particular tension existed during the stabilization (2.82 N). Drawn samples were then heated from room temperature to the different final temperatures (250, 300, and 350 °C) with the heating rate at 5 °C min−1, followed by holding at the final temperature for1 h to complete the thermal stabilization. The best possible heating rate for the stabilization of the PAN precursor was selected according to previous studies.[37, 45, 47] After investigating the optimum final temperature for thermal stabilization, the stabilized PAN yarns were cooled down to room temperature, unwrapped, and carbonized at a relatively low temperature of 740 °C at the heating rate of 2 °C min−1, followed by holding at the final temperature for 50 min. The proper holding time for carbonization was obtained experimentally. During this process, high-purity nitrogen gas (99.99%) was purged initially and maintained a constant flow rate (0.3 atm.) into the tubular furnace. After thermal pyrolysis, the temperature was allowed to cool down to room temperature before the sample exposed to ambient air.
2.5 Characterization
2.5.1 Morphology
The morphology, diameter, and diameter distribution of the electrospun nanofibers and yarns were characterized by scanning electron microscope (SEM, XL30, Philips, Netherlands). Samples were coated with a thin layer of gold in a nitrogen atmosphere (Emitech; SC7640 Sputter Coater, England) before obtaining SEM images. The average diameter of the electrospun nanofibers was determined by measuring the diameters of the electrospun nanofibers at 100 random points on the SEM images (10 000 ×) using the ImageJ software (National Institute of Health).
The average diameters are presented as the mean value ± standard deviation. The results were statistically analyzed based on a one-way ANOVA test and Tukey's honest significant difference tests (95%)
2.5.2 Mechanical Testing
Pieces of electrospun yarn, each 30 mm long, were cut from different areas and weighed using an electronic balance (A&D, Japan, with a precision of 0.001 g) to determine the linear mass density of the yarn and its weight loss after thermal treatments. The mechanical behavior of electrospun PAN nanofibrous membranes and yarns (as-spun, stabilized, and carbonized yarn) were measured by a tensile mechanical testing machine (Instron-5566, UK) with a sample gauge length of 20 mm, a crosshead speed of 1 mm min−1 and the load cell of 50 N at room temperature. The samples were mounted onto a paper frame similar to that used for single fiber and filaments.
2.5.3 Differential Scanning Calorimetry (DSC)
2.5.4 FTIR Spectroscopy
2.5.5 Raman Spectroscopy
Raman spectroscopy is another reliable tool to investigate the microstructures of stabilized and carbonized yarns. This was performed via a Microscopic Confocal Raman Spectrometer (Apus Raman microscope, Teksan, Iran) with a laser line of 532 nm, and output power of 10–90 mW from a He─Ne excitation source and the integration time of 15 s.
3 Results and Discussion
3.1 Morphology and Microstructure
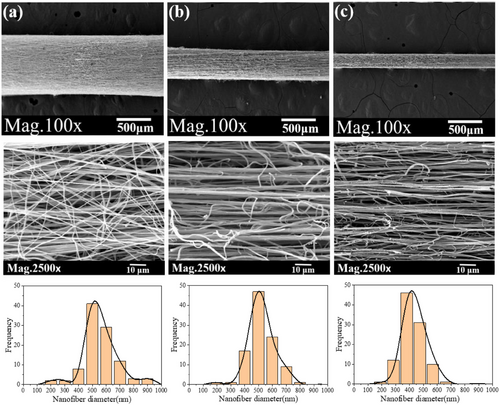
SEM images of as-electrospun and stabilized PAN nanofibers at different temperatures and their corresponding diameter distribution are illustrated in Figure 2. PAN nanofibers with a smooth surface and average diameter of 399 nm (Table 1) were obtained in the optimum processing conditions of electrospinning[22] (Figure 2a). The mean diameter is substantially smaller than the previously reported average diameter of PAN nanofibers within the yarn (812 ± 312[4] and 998 ± 141 nm[19]). The results also revealed apparent changes in the morphology and nanofiber diameter after thermal stabilization (Figure 2b,c). Statistical analysis also showed a meaningful difference between the average nanofiber diameter of PAN and oxidized PAN in different temperatures (p-value <0.05) (Table 1). By increasing the temperature of the stabilization, partial fusion of stabilized nanofibers leads to many interconnected between the nanofibers and decreases the diameter of PAN nanofibers. This morphological change is caused by a chemical reaction in the heat treatment and cyclization between linear molecules of PAN-based polymer precursor in the air atmosphere to convert the precursor to cyclic structure.[28, 32, 45] The physical orientation of PAN nanofibers decreased after stabilization and structural shrinkage of PAN nanofibers was obvious. Therefore, the drawing force of the installed springs in the laboratory-build drawing system was applied at later stages to maintain the alignment structure.

| Samples | Oxidation temperature [°C] | Diameter of nanofibers | ||
|---|---|---|---|---|
| Average [nm] | SD | CV% | ||
| PAN | − | 399 a | 84 | 37 |
| PANOX250 | 250 | 362 b | 99 | 44 |
| PANOX300 | 300 | 284 c | 50 | 22 |
| PANOX350 | 350 | 248 d | 68 | 30 |
- Alphabets in superscript are related to Tukey comparisons and one-way ANOVA grouping implying a statical variance between the nanofibers' diameter at 0.05 level. PAN: Polyacrylonitrile; PANOX: oxidized Polyacrylonitrile.
SEM images of electrospun yarns; PAN, PANY-250, and PANY-C are shown in Figure 3. Higher magnification SEM images show that uniform and smooth as-spun nanofibers were formed without beads, and drawing during the stabilization caused a high degree of nanofiber alignment in the yarn structure. Furthermore, there is no partial fusion and breakage of the fiber in thermally treated samples (Figure 3b,c). The average diameters of yarns and nanofibers composing the yarn are given in Table 2. ANOVA statistical analysis of the data, at the 95% confidence level, revealed that the average diameter of the nanofibers in the yarns decreased with an increasing thermal treatment temperature, which is predictable due to the cyclization and gas evolution in thermal stabilization and carbonization of samples.[32] The linear mass density of yarns (Tex) and weight loss percentage before and after stabilization and carbonization are reported in Table 2. Mass loss in the form of HCN, CO2, and further complex from the chemical polymer structure,[44] causes a thermal shrinkage of 23.7 and 17.5% in the stabilized and carbonized yarn diameter, respectively. However, Xie et al. reported mass loss percentages as high as 99.93 and 94.54% for PAN yarn and nanofibers within yarn after drawing and thermal carbonization, which is attributed to the unoptimized thermal treatment condition.[4]
| Samples | Nanofiber diameter | Yarn diameter | Linear mass density [Tex] | Weight loss [%] | |||
|---|---|---|---|---|---|---|---|
| Average [nm] | S.D. |
Average [µm] |
SD |
Average |
SD |
||
| PAN-Y | 511 a | 127 | 838.24d | 10.73 | 39.5 | 0.6 | − |
| PAN-Y250 | 473 b | 95 | 421e | 4.33 | 34.7 | 3 | 12 |
| PAN-YC | 390 c | 89 | 205.79f | 4.28 | 18.1 | 0.5 | 54 |
- Alphabets in superscript denote Tukey comparisons and grouping in one-way ANOVA at 0.05 level. PAN-Y: Polyacrylonitrile yarn; PAN-Y250: oxidized PAN yarn at 250 °C; PAN-YC: carbonized PAN YARN.
3.2 Porosity of Nanofibers
The porosity percentage is the ratio of the pore area to the total area of the nanofibrous layer.[52] Before and after stabilization, the porosity percentage of electrospun PAN nanofibers was evaluated using the ImageJ software for three layers of nanofibers mat, which is visible in the SEM image (10 000 ×). The average of pore's area was also reported. During thermal treatment up to 200 °C, some gasses evolved from PAN precursor nanofibers[32] which resulted in waviness and disorientation of nanofibers. Therefore, the surface area of the SEM image is mostly covered by nanofibers and, despite the reduction in diameter, the percentage of porosity decreased (Figure 2 and Table 1) (Table 3).
| Samples | Porosity | |
|---|---|---|
| Average pore size [nm2] | Total [%] | |
| PAN | 3.01 × 10⁶ | 70.85 |
| PANOX250 | 1.24 × 10⁶ | 51.42 |
| PANOX300 | 1.26 × 10⁶ | 39.45 |
| PANOX350 | 0.45 × 10⁶ | 30.50 |
3.3 Alignment of Nanofibers in Yarn Structure
According to SEM images of nanofiber samples (Figure 2), the alignment of PAN layers was quantified using the OrientationJ plugin within ImageJ software. Based on the results, the As-spun nanofibers are mostly oriented closer to 0°, while disorientation developed in the stabilized nanofibers (Figure 4a). The stabilized nanofibers also became extremely fragile and brittle due to the gas evolution reaction in heat treatment up to 200 °C.[32]
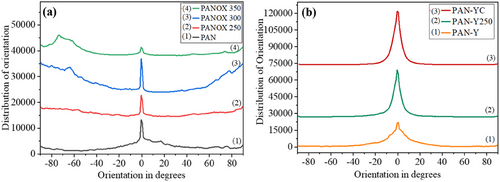
Fiber orientation distribution along the yarn axis was also measured using the FFT filter (Fast Fourier Transform) on their SEM images at 10 000×. According to Table 2 and Figures 3 and 4b, applying uniaxial tension on the electrospun nanofibers during the thermal stabilization, narrowed nanofiber orientation distributions in thermal stages, controlled thermal shrinkage of nanofibers, and maintained the molecular orientation within the nanofibers. The distribution of nanofibers' orientation is also uniform after thermal treatments. However, the absence of tension on the precursor yarn in the process lead to a disordered nanofiber structure within the CNY.[38]
3.4 Thermal Behavior of Stabilized PAN Nanofibers
3.4.1 DSC Analysis
The stabilization is critical for the formation of three-dimensional structures in precursor nanofibers which are thermally stable for subsequent high-temperature heat treatments.[53] The cyclization was investigated using non-isothermal DSC analysis. The sample curves are shown in Figure 5, whereas spun PAN and three sets of stabilized PAN nanofibers were heated at 10 °C min−1 to ≈500 °C and were held in the nitrogen and oxygen atmosphere in turn, to investigate the thermal stability and isothermal cyclization of the electrospun P(AN-co-MA) copolymer. These curves show the heat released as a function of temperature and, hence, the degree of cyclization reaction. As shown in Figure 5a, the thermal decomposition of PAN fibers, between 260 and 320 °C, shows a sharp exothermic peak at 288 °C; therefore, the optimum stabilization temperature should be set before this critical range. The enthalpy (ΔH) of the thermal decomposition and cyclization degree (Equation 1) were calculated from DSC thermograms and (Table 4). As noted, the heat released in the thermal decomposition of the PANOX 250 was dramatically more than at 300 and 350 °C; thus, PANOX250 has the highest thermal stability in the combustion, which indicates that the cyclic structures well-formed in stabilization at 250 °C. A third DSC scan was done at 300 °C (Figure 5b). This proves that the time for growing crystals and oriented structures was not sufficient in thermal stabilization, resulting the heat released and thermal stability of the electrospun PANOX300 nanofibers are lower than the PANOX250 nanofibers. Higher stabilization temperatures are not appropriate as they result in the combustion of the nanofibers.[45] The broad endothermic peak of the PANOX350 thermogram in Figure 5b assured that nanofibers were thermally decomposed in the stabilization at a final temperature of 350 °C and returned the heat of decomposition to the DSC chamber.
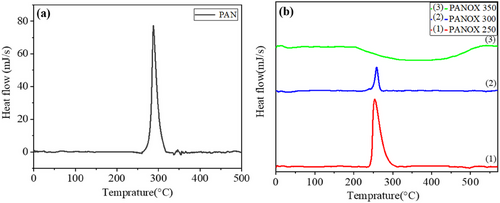
| Samples | ΔH [mJ] in N2 | Cyclization degree [%] |
|---|---|---|
| PANOX250 | 3152.57 | 169.60 |
| PANOX300 | 430.70 | 63.16 |
| PANOX350 | −1728.08 | −48.78 |
3.4.2 FTIR Analysis
Figure 6 shows the FTIR spectra of PAN fibers before and after stabilization in the convection furnace with various final temperatures (250–350 °C). Before stabilization, distinct characteristic vibrations for the chemical groups in the precursor are those of the C≡N nitrile group at ≈2241–2248 cm−1, and the bands in the regions 2926–2935, 1450–1460, 1350–1380, and 1220–1270 cm−1 which are assigned to different aliphatic CH group vibrations (CH, CH2, and CH3 bonds). The conspicuous band at 1732–1735 cm−1 is due to the C═O stretching, and the band at 1670 cm−1 is the amide group vibration.[54] As stabilization temperature increased, the most prominent structural changes were the reduction of 2241–2248 cm−1 peak intensity, attributed to the C≡N band, and the reduction of those for aliphatic C─H ones and the amide group.[45] The C≡N vibration also shifted to a shorter wavelength (2236 cm−1) because the atomic bond between nitrogen and carbon is weakened in thermal treatment.[54] The emergence of the peak at 1590 cm−1 is due to a combination of C═N, C═C, and N─H groups. During thermal treatment, the C≡N nitrile is converted into C═N-containing structures that result from intramolecular cyclization and intermolecular cross-linking, which prepares the thermally stable structures for further high-temperature carbonization. The appearance of the C═C-containing structures results from dehydrogenation. Also, stabilization gives rise to carbonyl groups.[37] To quantifiably evaluate a conversion ratio of the C≡N band to C═C during thermal stabilization, the CI index (Equation 2) is used, and the results are summarized in Table 5. The value of the CI index increased by increasing the thermal treatment temperature; however, it does not indicate the formation of highly oriented microstructures in fibers. By way of illustration, PANOX350 nanofibers have the highest CI index, while the fibers are severely degraded at this temperature (Table 5). Therefore, FTIR analysis is not reliable enough for the determination of optimum stabilization temperature in this work.
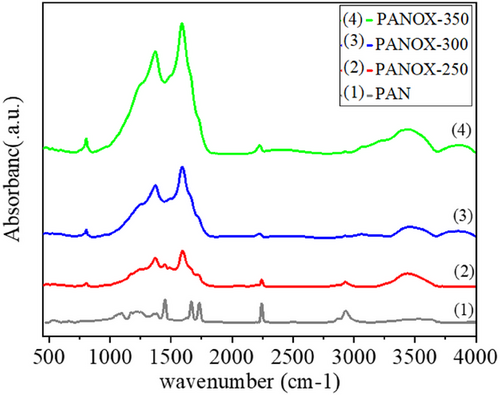
| Samples | CI |
|---|---|
| PAN | 0.52 |
| PANOX250 | 0.84 |
| PANOX300 | 0.91 |
| PANOX350 | 0.98 |
3.5 Raman Spectroscopy Analysis
Raman spectroscopy is another reliable way of distinguishing highly oriented structures from disordered components that cannot be characterized by FTIR in the high-temperature treatment. Figure 7 represents the Raman spectra of stabilized and carbonized yarns. To better compare, the background of the fluorescent component was removed, and the baseline was plotted using Origin Pro2018 software. Raman spectra of carbonaceous materials show two distinct peaks, namely D-band and G-band centered at ≈1370 and 1580 cm−1, respectively.[55] Generally, the D band could be assigned to disordered carbon sheet structures, and the G band is related to ordered graphitic crystalline structures.[3, 56] Table 6 shows the intensity ratio of these peaks (known as the “‘R-value”’, R = ID/IG), which indicates the amount of ordered graphitic structures in the carbonaceous materials.[57-59] It was evident that the “‘R-values”’ of the stabilized PAN nanofiber yarns increased with an increase in final stabilization temperature, indicating disordered carbonaceous components in PANOX250 yarn were more converted into ordered structures and reached the lowest R-value among stabilized yarns. After carbonization at 740 °C, the R-value of PANOX250 yarns diminished, suggesting that more ordered graphite crystallites formed in the carbonization step. Although the resultant CNY was obtained through low-temperature carbonization, highly oriented microstructures were formed by applying proper uniaxial tension during thermal treatment (R = 1.24), which is comparable to previous studies performed at high-temperature carbonization (R = 1.58–1.26,[59] and 0.925[7]).
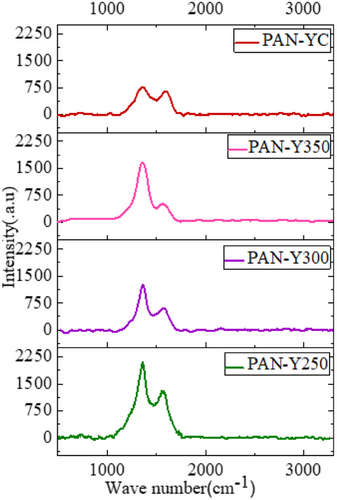
| Samples | R | IG | ID |
|---|---|---|---|
|
PAN-Y 250 |
1.62 | 1296.53 | 2103.05 |
| PAN-Y 300 | 2.04 | 608.18 | 1240.84 |
| PAN-Y 350 | 3.32 | 504.23 | 1652.81 |
| PAN-YC | 1.24 | 607.94 | 759.30 |
3.6 Tensile Behavior of Nanofibers
Mechanical properties of as-spun and stabilized PAN nanofibers are presented in Table 7, and typical strength-elongation curves are shown in Figure 8. Although it is expected that mechanical properties increased with increasing the final stabilization temperature,[32] ANOVA analysis of showed no significant difference in the mechanical properties of the fibers in different thermal stages. This may be attributed to the scission of undrawn PAN macromolecular chains that make the resulting carbon fibers mechanically weak.[3] The partial fusion in stabilized PAN fibers also introduced potential weak points at the nanofiber and consequently caused severe stress concentrations. Therefore, the fracture of the nanofibers occurred by exerting small forces. This slight increase of tensile strength with higher stabilization temperature is unusual since disoriented PAN-based fibers possess defect microstructures instead of highly oriented microstructures;[3, 26] therefore, before thermal stabilization, as-spun PAN nanofibers behave in an elastic-plastic manner (Figure 8a), while after the process, it changes to brittle behavior (Figure 8b–d). Accordingly, the optimum thermal stabilization conditions and tension values during the process should be optimized.
| Samples | Stress at break | Elongation at break | Modulus | Work of fracture | ||||
|---|---|---|---|---|---|---|---|---|
| MPa | SD |
% |
SD |
MPa |
SD |
J | SD | |
| PAN | 11.39a | 1.84 | 28.06 c | 6.47 | 238.37f | 16.17 | 246.67j | 55.69 |
| PANOX250 | 12.84a | 2.67 | 6.94 d | 1.27 | 251.38g | 55.40 | 48.61k | 63.02 |
| PANOX300 | 12.67a | 5.92 | 3.58 e | 0.81 | 469.85h | 93.36 | 18.52l | 13.64 |
| PANOX350 | 9.39b | 2.97 | 1.57 e | 0.41 | 708.79i | 123.84 | 7.02m | 3.81 |
- Alphabets in superscript are related to ANOVA grouping, implying a statical variance of nanofibers' mechanical properties at 0.05 level.
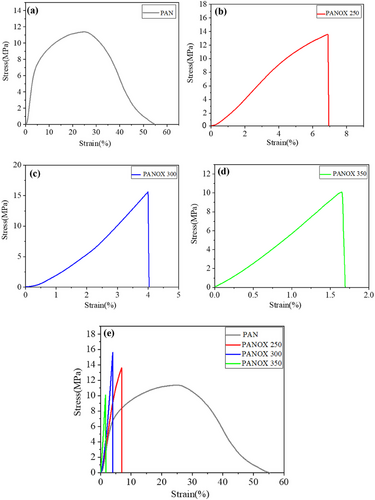
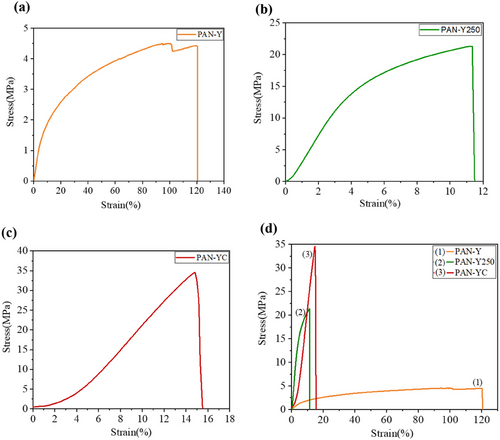
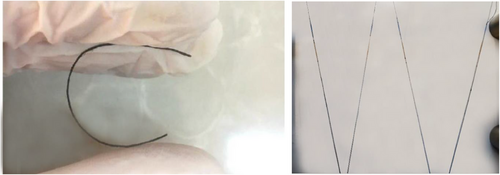
The mechanical properties of PAN lectrospun yarns in different stages are also presented in Table 8, and typical strength-elongation curves are shown in Figure 9. It can be seen that applying uniaxial tension on fibers during thermal treatment influenced mechanical properties such as elongation at break, toughness, modulus, and the tensile strength of the yarns. This study clearly shows that the ultimate tensile strength of stabilized and carbonized PAN yarns increased by 280 and 659%, respectively (Table 8). This may be attributed to the increasing molecular orientation and alignment of nanofibers in the direction of applied force, and reducing fiber diameter during thermal stages.[1, 3] Increasing crystallinity in the yarn axis direction increased Young's modulus of stabilized and carbonized yarns by 13.9 and 9.8 times; however, reducing the interlayer spacing of ladder PAN molecules in thermal treatments decreased the toughness and elongation of yarns compared to as-spun yarns. ANOVA analysis indicated that the elongation at the break of stabilized and carbonized yarns are not statistically significant difference. Stabilized and carbonized yarns behave in a relatively brittle manner thus the slope of the linear area of the curves was measured as Young's modulus. Although the presented mechanical strength of carbonized yarn (40.43 MPa) is inferior to the referred research on electrospun CNY (367 MPa[4] and 1 GPa[1]), the final carbonization temperature, fiber per yarn diameter, and linear mass density of yarn are substantially higher in their study, which makes comparisons difficult. As shown in Figure 10, the resulting electrospun carbon yarn is not brittle, and it has relatively high flexibility, but further investigation is needed to tie it without rupture and failure of fibers.
| Samples | Stress at break | Elongation at break | Modulus | Work of fracture | ||||
|---|---|---|---|---|---|---|---|---|
| MPa | SD |
% |
SD |
MPa |
SD |
J | SD | |
| PAN-Y | 5.38a | 1.14 | 116.97d | 29.65 | 27g | 6.11 | 446.19j | 83.06 |
| PAN-Y250 | 20.46b | 1.87 | 12.71e | 1.57 | 409.02h | 24.63 | 146.19k | 40.29 |
| PAN-YC | 40.483c | 4.74 | 18.84f | 4.05 | 297.15i | 68.29 | 378.81l | 127.92 |
- Alphabets in superscript are related to ANOVA grouping, implying a statical variance between the nanofibers and yarn the mechanical properties at 0.05 level.
4 Conclusion
In the present study, a PAN copolymer (Mw 100 000 g mol−1) was directly electrospun into nanofiber and yarns using the single nozzle (with rotating drum) and double nozzle setups, respectively. The electrospun PAN nanofiber yarns were used as the precursor to produce carbon nanofiber yarns through thermal stabilization and carbonization. During stabilization, the drawing force was applied to nanofiber yarns by a laboratory-built drawing system, therefore tension existed during the stabilization. The final stabilization temperature was set in the range from 250 to 350 °C. The effects of final stabilization temperature and thermal drawing on the morphology, diameter, crystallinity, and mechanical properties of electrospun PAN Fiber/yarns were systematically investigated. The data revealed that: 1) the average diameter of stabilized and carbonized electrospun PAN nanofiber/yarns was reduced; 2) the microstructure of the high-temperature (350 °C) stabilized nanofibers was almost disordered and thermally degraded, while highly oriented microstructures were formed during low-temperature (250 °C) stabilization of PAN fibers; 3) applying uniaxial tension in thermal stabilization formed highly aligned and flexible carbon yarns; 4) The tensile strength and elastic modulus of carbon nanofiber yarns increased by 65 and 244.56%, respectively; and 5) both mechanical and morphological properties of well-stabilized yarns improved with the increase of graphitic structures during the carbonization. For developing electrospun carbon nanofiber yarns with outstanding mechanical properties, the carbonization has to be conducted at a higher temperature. The electrospun carbon nanofiber yarns with fine diameter and superior mechanical properties may form a next-generation precursor for making high-performance carbon-based materials.
Acknowledgements
This work was partially supported by the Research Affairs Division at Amirkabir University of Technology (http://aut.ac.ir/aut/).
Conflict of Interest
The authors declare no conflict of interest.
Open Research
Data Availability Statement
The data that support the findings of this study are available from the corresponding author upon reasonable request.


