Rapid Screening of Vapor Uptake by Ultra-Thin Polymer Films Using Surface Plasmon Resonance and Quartz Crystal Microbalance with Dissipation Monitoring
Abstract
Volatile emissions can be efficiently reduced by membrane separation processes. Selecting the most adequate membrane polymer can be a time and resource-intensive screening process. It is demonstrated that surface-sensitive techniques such as the quartz crystal microbalance (QCM) and surface plasmon resonance (SPR) can be valuable tools to significantly cut down on the time needed to characterize and quantify vapor-polymer interactions. Both techniques are shown to be highly complementary. QCM allows also obtaining qualitative data on changes in the polymer viscoelasticity upon vapor sorption which ultimately might permit a correlation with the mechanical membrane stability.
1 Introduction
The emission of volatile organic compounds (VOCs) has been regulated for decades such as to limit their impact on human health.[1] Polymer membranes are widely employed to recover or separate VOCs from air in an energy-efficient manner.[2] Hereby, it is crucial for the membrane polymer to possess a sufficiently high affinity for the VOCs such as to ensure a truly efficient separation process. However, under actual operating conditions, this high affinity must not lead to excessive swelling of the membrane polymer, as this can result not only in reduced selectivity but also potentially promote irreversible membrane damage. Consequently, identifying an appropriate membrane polymer that combines both a high affinity and prolonged durability under actual operating conditions can be time-consuming and resource-intensive.
Surface-sensitive techniques such as surface plasmon resonance (SPR) and quartz crystal microbalance (QCM) have been extensively used particularly in the field of biophysics and primarily for detecting constituents of a liquid (mostly aqueous) phase.[3, 4] While QCM is an acoustic technique and SPR is optical, both utilize sensors onto which ultra-thin polymer films (less than 100 nm) can be deposited using the same experimental procedure. Additionally, both techniques demonstrate similar sensitivity in detecting surface phenomena. Thus, SPR and QCM are highly complementary methods for measuring interactions of compounds with the sensor surface.
Nevertheless, despite being surface-sensitive techniques, conducting both SPR and QCM measurements at constant temperatures in liquids can be significantly affected by bulk changes in the viscosity and density of the liquid, which may occur, for example, due to substantial changes in solute concentration. Therefore, in liquid environments variations in these two bulk parameters must be considered to avoid measurement artifacts, and they can severely limit the application of both techniques beyond their original intended use.[5]
In the vapor phase, however, bulk effects resulting from changes in solute concentration are generally negligible for both QCM and SPR, owing to the significantly lower molecular density compared to liquids. As a consequence, mass transport during vapor sorption is significantly faster than in liquids which is why ultra-thin polymer films should reach a stationary state relatively quickly. This sparked our interest in exploring how QCM and SPR could serve as complementary rapid screening techniques for the interaction of vapors with polymers. Given the recent advances in multi-channel setups and machine learning, our primary motivation was to investigate whether these two techniques could pave the way toward a complementary and scalable high-throughput system capable of significantly reducing the search for selective yet stable polymers for membrane vapor-gas separations.
2 Experimental Section
Pebax copolymers consist of two dissimilar homopolymers along the polymer chain backbone. The material used in this study was Pebax2533 SA 01 (Arkema Inc.). The designation ″SA 01″ indicates that the polymer was free of additives and especially designed for food applications. In this case, the interest was to have a polymer free of additives such as to better elucidate pure polymer-ionic liquid interactions. In the following, this polymer will be referred to as ″Pebax2533.″ Its chemical structure is shown in Scheme 1. The first segment contains 20 wt.% of linear chains of rigid polyamide (PA 12), covalently linked to a second segment of 80 wt.% of a soft, flexible polyether (PTMO).[6] The molecular weight of the polyether was between 600 and 2000 Da while the one of the polyamide was between 600 and 4000 Da. The soft and hard segments were relatively short blocks that alternate “n” times to yield the resulting block copolymer.[7, 8]

For the polymer film preparation and deposition on the sensors, Pebax2533 in the form of melt-processed pellets (2–3 mm in diameter), isopropanol, and n-butanol (Merck, Sigma–Aldrich) were used without further purification. Pebax2533 was dissolved in a mixture of isopropanol/n-butanol, (mass ratio 3:1) at 80 °C with reflux for 2 h under stirring to form a homogeneous solution containing 3 wt.% of the polymer.[9-12] Polymer films for measurements with the Cahn electrobalance were produced by casting this solution on hot petri dishes at 50 °C, and subsequently maintained at this same temperature until the solvent had entirely evaporated. Finally, the resulting membranes were peeled off from the glass, followed by complete drying at 60 °C under vacuum in an oven for 7 days in order to remove any residual solvent. The thickness of dry polymer films was at an average of the order of 50 µm as measured by a thickness gauge. Until carrying out any characterization of the membrane material, it was maintained under vacuum at 60 °C such as to avoid sorption of any type of airborne vapor, including water.
All organic solvents studied (ethanol, ethyl acetate, hexane, and toluene) were reagent-grade as used as purchased (Merck, Sigma–Aldrich) and the water was ultrapure (resistivity 18.2 MΩ·cm).
Sorption measurements were conducted by three independent techniques: a Cahn electrobalance, a quartz crystal microbalance with dissipation monitoring (QCM-D), and multi-parameter surface plasmon resonance (MP-SPR).
For the sorption measurements using the Cahn electrobalance, the experimental procedure was the same for all vapors. Prior to the experiment, polymer samples were stored under vacuum at 60 °C. Due to the small thickness of the polymer films, 4–6 slices of the polymer membrane (25 × 10 mm) were cut and stacked such as to obtain samples with enough thickness and weight to yield a significant mass increase during sorption. After placing the sample in its respective sample holder and into the balance sorption chamber, the system was purged at 23 ± 1 °C with nitrogen (purity 99.998%) under a flux of 50 mL min−1 for 24–30 h and until the weight of the sample showed a mass variation of less than 0.2 wt.% h−1. The temperature was controlled with an automatic controller (Conatec 4400) connected to a resistance of 1000 W and regulated with a fan. Subsequently, the saturated organic or water vapor was introduced into the temperature-controlled chamber by passing nitrogen gas with a constant flow rate of 50 mL min−1 through the organic solvent or water which was placed in a bubbler. Each experiment was done in triplicates.
The QCM-D (Biolin Scientific, Sweden) and MP-SPR (Bionavis, Finland) experiments were conducted at 23 ± 0.1 °C following the 5th harmonic in the case of QCM and using a wavelength of 670 nm in the case of SPR. In both cases, sensors coated with a gold electrode were employed. The base frequency of que QCM-sensors was 4.95 MHz. Before starting the experiments with new sensors, the latter were sonicated for 10 min in ethanol and then dried with N2 (purity 99.998%). Ultra-thin polymer films were then deposited on these sensors by spin-coating (LOT Oriel, Germany). For this purpose, the abovementioned polymer solution was diluted to yield a 1 wt.% polymer solution, 2 µL of which were spin-coated onto the sensor at 20 rps during 10 s. Vapor sorption measurements in QCM-D and MP-SPR were carried out using a gas mixer (IB-32 Gas mixer, Iberfluid) at different solvent activities and a total vapor flow of 50µL min−1. The gas-mixer system was composed of two lines: one with pure nitrogen and the second one with a bubbler containing the solvent to generate a saturated vapor. Using mass flow controllers, this saturated vapor was diluted with nitrogen to reach the desired solvent activity while maintaining the overall flow rate constant. The total flow was kept constant at all times because slight variations in the flow rate could result in a bulk response of the sensor particularly in the case of QCM-D. Mass fractions were derived in the case of QCM-D (or MP-SPR) from the ratio between the frequency (or peak minimum angle) shift due to solute uptake and the frequency (or peak minimum angle) shift generated by the polymer deposition. For viscoelastic modeling, QCM-D data were processed with the software of the provider (Qtools, Biolin) employing the Kevin-Voight viscoelastic model.
NMR spectra were obtained using a Bruker 400 WB Plus spectrometer. Spectra of the pristine polymers and polymer/solute blends were collected by using a 4 mm CP-MAS probe at a spinning rate of 10 000Hz. 13C CPMAS spectra of solid samples were recorded for 12 h using the standard pulse sequence at 100.6 MHz, a time domain of 2 K, a spectral width of 29 kHz, a contact time of 1.5 ms, and an interpulse delay of 5s. For the analysis of polymer that had been previously in contact with vapors, samples were in contact with the respective organic solvents for 30 h prior to analysis. Subsequently, they were quickly wiped with tissue paper to remove excess liquid. NMR spectra were processed using the software of MNova by Mestrelab Research (www.mestrec.com), Spain. Measurements were performed by the Unit of Materials and Surfaces (Resonancia Magnética Nuclear) from the General Services (SGIker) at UPV/EHU.
3 Results and Discussion
Both QCM-D and MP-SPR measurements confirmed that the stationary state of vapor sorption was quickly achieved in the ultra-thin Pebax2533 films (Figure 1). For example, after having stabilized the polymer film in nitrogen, during the first exposure to ethyl acetate vapor (activity aEtAc = 0.1) the frequency and dissipation still required ≈13 min to reach a stationary state (Figure 1E). However, from a subsequent increase in ethyl acetate activity (aEtAc = 0.2) on, this time was found to be reduced to less than 3 min. In fact, after mere 10 s the polymer film had already reached 98% of its equilibrium concentration (Figure 1E). This demonstrates that these surface-sensitive techniques are indeed a fast alternative to conventional gravimetric methods.
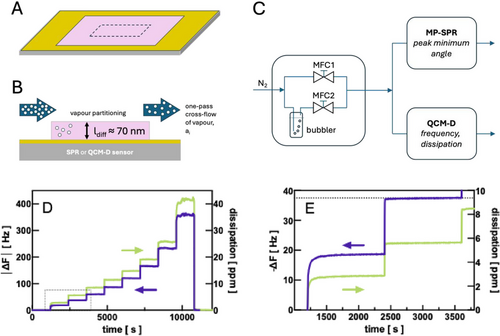
We therefore were interested in determining next how far the sorption of vapors in ultra-thin films as determined by QCM-D and MP-SPR would relate to data obtained by a conventional method such as the Cahn electrobalance and literature data, where available. For this purpose, Pebax2533 was submitted to step-wise increased solvent activities with the three different techniques. In QCM-D, the highest solvent activity measured was 0.8 because higher activity values could generate, depending on the solvent, an excessive and irreversible alteration of the polymer film which in turn affected the QCM-D signal. In the case of MP-SPR, activities used reached up to 1, and in the Cahn electrobalance, the tests were carried out with saturated vapor (activity ai = 1), only. All measurements were repeated three times with one and the same polymer deposition. For this purpose, each sorption series was followed by a desorption with N2 overnight to assure, under the respective conditions, a complete removal of any trace of solvent from the polymer. Measurement data therefore represent an average value with its respective standard deviation. Being vapor sorption measurements, the reproducibility was generally so high that error bars were mostly not perceivable in the graphical representations.
Figure 2 depicts the experimental results obtained from QCM-D and MP-SPR for an ultra-thin film of Pebax2533 in comparison with results obtained for the film stack in a Cahn electrobalance and when being submitted to vapors of water, ethanol, ethyl acetate, toluene, and hexane, respectively.
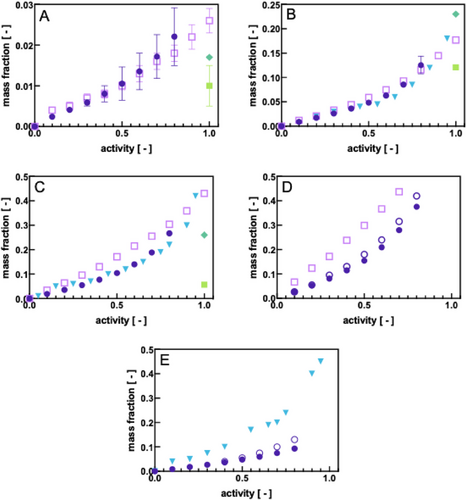
As regards the sorption of ethanol and water, we observed an excellent agreement between the QCM-D and MP-SPR (Figure 2A,B). With the increasing apolarity of the solvent, a slight discrepancy between the data of both techniques was detected (Figure 2C,D). MP-SPR measurements did not provide any conclusive result during the sorption of hexane and therefore are not depicted (Figure 2E): after repeating the experiments several times we noticed that the hexane vapor had visibly damaged the Pebax2533 film up to a partial dissolution. This strong swelling of the polymer film by the more apolar solvents was reflected also in the QCM-D data. In the case of ethyl acetate and toluene (Figure 2C,D), QCM-D yields across the whole activity range lower mass fractions of sorbed solute than MP-SPR. It is known that QCM-D has the tendency to underestimate the mass sorbed in its surface layer when the latter undergoes a strong change in its viscoelasticity, e.g., due to swelling. The underestimation of the sorbed mass is, therefore, an experimental artifact known as the “missing mass effect”[13] and intrinsically linked to the measurement principle of a QCM. One may correct for this effect to some extent by conducting viscoelastic modeling which indeed corrected the sorption data for toluene and hexane toward higher values (Figure 2D,E), yet, without reaching the values detected by MP-SPR in the case of toluene (Figure 2D). Since SPR is in principle not sensitive to swelling effects in the polymer film under the experimental conditions employed, it might be deduced that QCM-D slightly underestimates the degree of sorption for ethyl acetate, toluene, and hexane.
We compared our experimental results with literature data, namely the work of L. de Barros Ferreira[14] and Cen et al.[15] who have studied the sorption of vapors in Pebax using a custom-made gravimetric method and saturated vapor conditions as well as a quartz spring balance by step-wise increasing the vapor activity, respectively. It should be noted that in the work of Cen et al., no information was provided about the particular PE and/or PA block content and properties that have been used for their study. However, in view of the similarity of their results with ours, we may assume that the material employed by them has been Pebax2533 or very similar. L. de Barros investigated the sorption of solvents in Pebax4033 which contains ≈53% PE and 47% PA and therefore possesses a higher semi-crystallinity than Pebax2533. Nevertheless, both works repeated sorption experiments with one and the same polymer film followed by desorption as we did in our studies and also observed that during repetitions the same sorption isotherms were obtained. This is noteworthy as it might be expected, as for example is the case during DSC experiments, that slight deviations in the sorption behavior may be detected due to polymer chain rearrangement during sorption or desorption. L. de Barros quantified any variability observed between the first and second vapor sorption experiments to reach ≈4% in the case of water, 1% for ethanol, and ≈5% for ethyl acetate. We determined a similar error for ethanol and ethyl acetate using QCM-D and MP-SPR. For water, however, the error we calculated was up to 15% and 33% during the MP-SPR and QCM-D measurements, respectively. It is possible that this relatively high error might be related to local condensation effects in the sampling line which consists of tubing of sub-mm diameter.
The sorption data determined by QCM-D and MP-SPR were in general in good agreement with Cen et al. for ethanol and ethyl acetate (Figure 2B,C) and remained below their data in the case of hexane (Figure 2E). In the latter case, QCM-D might have underestimated the actual mass fraction of the solute sorbed due to the viscoelasticity of the polymer film. With regard to the data of L. de Barros, they remained below QCM-D and MP-SPR data for water and ethyl acetate (Figure 2A,C, respectively) and also the data of Cen et al. (Figure 2C) but above those for ethanol (Figure 2B). This demonstrates that there is a significant variation in data from different authors and possibly also depending on the experimental set-up. On the other hand, QCM-D and MP-SPR data were found to fall within this variation and could therefore be considered equally reliable.
The most significant deviation from general trends was detected with the data from the Cahn electrobalance which yielded far lower mass fractions at saturated vapor conditions than all other methods in the case of water, ethanol, and particularly ethyl acetate (Figure 2A–C). Since these were one-point measurements, it was not possible to verify whether this was a general trend. Moreover, saturated vapor conditions are a delicate measurement condition: owing to the high risk of localized partial condensation in the measurement system, the true vapor concentration can be lower than expected, and so would be the mass fraction of solutes sorbed. Another difference between the Cahn electrobalance and QCM-D or MP-SPR was the sample thickness. QCM-D and MP-SPR employed ultra-thin films (tens of nanometers, see Supporting Information) cast onto a gold substrate, while the Cahn electrobalance required a stack of samples of hundreds of microns each. The latter was necessary such as to achieve a detectable mass gain with a certain confidence. Most importantly, the polymer film stack in the Cahn electrobalance was practically free-standing while the ultra-thin film in QCM-D and MP-SPR was attached on one side to the sensor slide substrate. Literature has already reported[16] that the polymer chain orientation, the state of organization layout[16] as well as other factors such as the use of a substrate support[16] can play an important role in their final mass transport properties; therefore a variation in the sorption mechanism on the nanoscale is probable to occur in QCM-D and MP-SPR when compared to the same bulk polymer in the electrobalance. The choice of detection method is, hence, dependent also on the final application. If the sorption data were to be related to membrane transport properties, the ultra-thin films studied by QCM-D and MP-SPR would certainly be more meaningful than those using thicker stacks of polymer films.
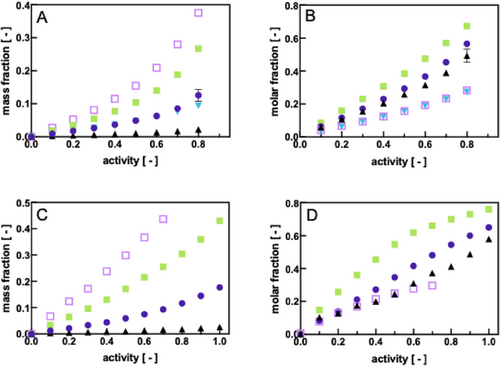
We then were interested in how far QCM-D and MP-SPR would serve as screening techniques for solvent vapor-polymer interactions. Figure 3A,B compile the sorption behavior of Pebax2533 thin films when submitted to an increasing vapor activity, both in mass and molar fractions, respectively, of the sorbed solute as measured with QCM-D (Figure 3A,B) and MP-SPR (Figure 3C,D). It can be seen how the sorption behavior of the different solvents can be lumped together in three different groups on the basis of their sorbed mass fraction regarding QCM-D measurements: toluene and ethyl acetate sorb most in Pebax2533, followed by an intermediate group of ethanol and hexane and finally the compound that least sorbed in Pebax2533 ultra-thin films was shown to be water. This grouping of compounds becomes less evident when representing the molar fractions of sorbed compounds rather than mass fractions with the main difference being that hexane sorbs in Pebax2533 at the same molar fractions as toluene. Figure 3B reflects the dual affinity of the polymer with a tendency to be hydrophilic as polar organic compounds such as ethyl acetate and ethanol sorb most, followed by water. SPR data widely corroborate these observations qualitatively (Figure 3C,D).
In addition to yielding data on the sorption coefficients when a thin film is submitted to different gases or solvents, QCM-D can also provide information about how much this film can dissipate energy due to viscoelastic changes occurring during sorption. In this way, this complementary parameter provides qualitative information about the viscoelastic properties of a thin film which ultimately can be correlated with membrane swelling upon vapor sorption.
The dissipation factor ∆D invariably increases with increasing mass sorbed which is why it needs to be normalized on the basis of the absorbed mass, here represented by the frequency change ∆F. Figure 4A depicts ∆D/∆F values of pristine Pebax2533 ultrathin films as a function of the vapor activity for different solvent vapors. Apparently, ethanol exhibits a very low normalized dissipation no matter at which vapor activity. This implies that ethanol does not seem to alter the viscoelastic properties of the film, at all, and it might be deduced that its sorption in the polymer occurs keeping the physical properties of the latter unchanged.

In the case of water, from an activity of 0.1 onward a slight increase in the normalized dissipation factor is observed, however, remaining at a constant value along the whole range of vapor activities studied. This suggests that water produces a homogeneous softer material as compared to the pristine polymer, but without further changes of the polymer material once water has been introduced into the polymer network.
The most striking change in normalized dissipation upon vapor sorption is exhibited by the rest of the solvents studied, namely ethyl acetate, hexane, and toluene. These three solvents generate a bigger alteration of the viscoelastic properties of Pebax2533. First of all, it can be seen in Figure 4A,B that sorption of hexane affected the polymer viscoelasticity most at the lowest hexane activity (and mass fraction in the polymer film). The viscoelasticity then decreased almost linearly with increasing solvent activity and mass fraction. A possible explanation is that hexane acts as a plasticizer at low mass fractions but due to its apolar nature generates a volume contraction of the polymer due to the lack of possible interactions. This in turn increases the polymer rigidity which was observed as a decrease in the respective ∆D/∆F values. Ethyl acetate and toluene followed a similar tendency, although less pronounced. It is interesting to note that at the highest solvent activity measured both solvents seemed to increase the polymer swelling again slightly remaining at similar ∆D/∆F values like hexane.
Finally, we were interested in whether either the viscoelastic changes as measured by QCM-D or the sorption data obtained from both QCM-D and MP-SPR could be correlated with data from 13C NMR. For this purpose, pristine Pebax2533 films were contacted with each of the organic solvents studied for 36 h, a time during which the sorption equilibrium was reached. Subsequently, the polymer film surface was quickly dried followed by measuring the 13C-NMR spectra. Three specific regions have been identified in the Pebax2533 spectra where shifts may be observed due to molecular interactions,[17] namely the signal of polyamide methylene carbons and polyether methylene or methyl carbons in β-position of oxygen atom (17–40 ppm, “A”); the polyether carbons in α-position of oxygen atom (63–76 ppm, “B”); and the polyamide carbonyl group (≈173 ppm, “C”) (Figure 5).
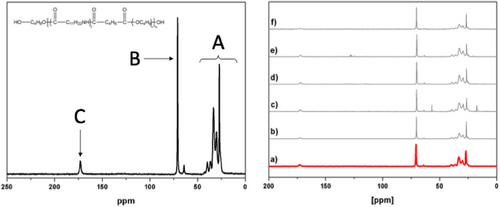
When exposing Pebax2533 to the organic solvents, we observed invariably upfield shifts indicating a shielding effect (Table 1).
| A | B | C | |
|---|---|---|---|
| [ppm] | [ppm] | [ppm] | |
| δ pristine Pebax2533 | 0.00 | 0.00 | 0.00 |
| δ Pebax2533-water | −0.50 | −0.50 | −0.35 |
| δ Pebax2533-ethanol | −0.72 | −0.57 | −0.39 |
| δ Pebax2533-ethyl acetate | −0.58 | −0.58 | −0.59 |
| δ Pebax2533-toluene | −0.71 | −0.71 | −0.63 |
| δ Pebax2533-hexane | −0.50 | −0.50 | −0.50 |
Both polar water and apolar hexane generated identical upfield shifts in region A and B, thus suggesting that the shifts observed were not due to solvent-polymer interactions but possibly mainly due to the intercalation of the solvent within the polymer structure and hence increasing the distance between polymer carbon chains. With regard to region “C” (carbonyl groups), one would have expected pronounced downfield shifts for both water and ethanol due to the formation of hydrogen bonds with the carbonyl amide group. In contrast, only upfield shifts were observed although to a minor extent than in the case of the other solvents.
We found that the viscoelastic changes as measured by QCM-D in terms of ∆D/∆F could not be correlated with the 13C-NMR shifts (Figure 6A). Hence, QCM-D data provide complementary information on the solute-polymer interactions. On the other hand, the shifts agreed rather well with the mass fractions determined upon vapor sorption, both for the “B” and the “C” regions. This confirmed that both QCM-D and MP-SPR provide indeed meaningful sorption data, yet, in a most time and resource-efficient manner.

4 Conclusion
We demonstrated that surface-sensitive techniques such as QCM-D and MP-SPR can serve as rapid screening techniques for determining vapor-polymer interactions. Both techniques are potentially scalable such as conducting high-throughput screening which in combination with machine learning would dramatically reduce the development for finding suitable polymers for membrane separations. The techniques rely on the deposition of an ultra-thin polymer film whose deposition might be a challenge on the standard sensor surface electrode material which is gold. However, a range of straightforward chemical modifications is readily available for gold surfaces (e.g., based on thiol-chemistry) in order to circumvent this apparent obstacle.
Conflict of Interest
The authors declare no conflict of interest.
Open Research
Data Availability Statement
The data that support the findings of this study are available from the corresponding author upon reasonable request.


