Effect of Cowpea Lignocellulosic Fibers as a Low-Value Reinforcing Filler on the Properties of Poly(butylene succinate-co-adipate) Bio-Composite Foams
Abstract
Herein, fully bio-based and biodegradable bio-composite foams are produced from poly(butylene succinate-co-adipate) (PBSA), reinforced with low-value cowpea lignocellulosic fibers, and azodicarbonamide as a chemical blowing agent. These are produced by melt extrusion followed by compression molding. Fiber addition increases the melt viscosity and melt strength, this restricts uncontrolled bubble growth during foaming to decrease the bubble size. The bio-composite foam containing 15% fibers has the largest decrease in bubble size from 209 µm in the unfilled PBSA foam to 95 µm in the foam containing 15% fibers. Fiber addition significantly increases the bubble density, from ≈1.05 × 10⁹ cells cm−3 in the unfilled PBSA foam to 5.13 × 10⁹ cells cm−3 in bio-composite foam containing 15% fibers, due to heterogeneous bubble nucleation induced by the fibers. The stiffness of the bio-composite foams increases with fiber addition, with the bio-composite foam containing 15% showing the largest increase relative to the unfilled PBSA foam as revealed by dynamic mechanical analysis. In conclusion, the fibers not only induce heterogeneous bubble nucleation to increase bubble density and decrease bubble size during the foaming of PBSA, but also act as reinforcement to increase the stiffness of the bio-composite foams. These bio-composite foams have potential applications in packaging and agriculture.
1 Introduction
The term polymer foam includes a wide range of materials comprising a gaseous phase dispersed in a solid polymeric phase.[1] Porous polymeric foams have broad applications in packaging, adsorption, tissue engineering, construction, etc., owing to their lightweight, low density, high specific strength, sound insulation, low thermal conductivity, high specific surface area, and high dissipation of impact energy.[2, 3] In some applications, polymer foams have been reported to perform better than their unfoamed counterparts. Despite this, research on polymer foams has received less attention than their unfoamed counterparts.[4]
The most common polymer foams are produced from petroleum-based polymers, such as poly(vinyl chloride), polystyrene, polyurethane, and polyolefin. A major drawback of these polymeric foams is that they are petroleum-based and not environmentally friendly since they are not biodegradable. In fact, of all plastics that are in circulation, it is estimated that ≈97% are petroleum-based, and are non-biodegradable, thus contributing to environmental pollution as waste.[5] Therefore, this necessitates the development of environmentally friendly biodegradable polymer foams that are bio-based and can made from renewable resources.[3]
Among various biodegradable polymers that are bio-based and renewable, aliphatic polyester poly (butylene succinate) (PBS), and its copolymer poly (butylene succinate co-adipate) (PBSA) are attractive owing to their biodegradability, biocompatibility, and that they can be bio-sourced.[6] PBSA is a highly flexible polymer, with excellent thermoplastic processibility, and has mechanical properties comparable to polyolefins.[7, 8] This has increased its attractiveness as an alternative to petroleum-based plastics in packaging, agriculture, and biomedical engineering.[8] However, widespread use of PBSA commercially is limited by its relatively high cost compared to petroleum based polymers.[9] Polymer foaming is one strategy to reduce material consumption and thus cost compared to their unfoamed counterparts.[10]
The addition of low-value agricultural lignocellulosic fibers as a filler to a biodegradable polymer can reduce the consumption of the polymer, thus costs, while modulating their functionality and maintaining biodegradation.[11] In addition, lignocellulosic fibers as a filler offers advantages over synthetic fillers due to their low cost, good availability, they are biodegradable, non-abrasive and can reduce tool wear compared to synthetic fibers, such as glass fibers.[12] In our previous work, low-value agricultural lignocellulosic fibers from a neglected and underutilized African crop, cowpea [Vigna unguiculata (L.) Walp] was used as a filler in a PBSA/PHBV blend matrix to produce injection molded and bio-composite films for rigid and flexible packaging.[13] In this work, we further expand on the use of cowpea lignocellulosic fibers as a filler in a PBSA matrix to produce bio-composite foams.
Polymeric foams are mostly produced by introducing a blowing agent into a polymer matrix, which may either be a chemical blowing agent or physical blowing agent. Chemical blowing agents are attractive as they are inexpensive, high pressure free, can result in uniform cell morphology and do not require additional polymer processing equipment, unlike physical blowing agents.[14] Azodicarbonamide is a widely used chemical blowing agent owing to its high gas yield (220 cm3 g−1 gas.), and low equipment requirement.[15, 16] It is a yellowish organic blowing agent that can be mixed with a polymer and its degradation/decomposition above 200 °C releases gases such as, nitrogen (65%), carbon monoxide (24%), carbon dioxide (5%) and ammonia (5%) leading to the formation of foamed polymeric structures and leaves very little residues.[16] Azodicarbonamide has previously been used to foam polymers and rubbers containing fillers.[14, 15] Lin et al.[17] reported that the addition of 5% azodicarbonamide resulted in uniform cell morphology in PBS-based foam reinforced with nanocellulose.
The melt viscosity and melt strength are considered key parameters in polymer foaming.[4] The addition of rigid cellulosic fillers has been shown to alter these properties and change foam properties.[4, 18] Therefore, this study aims to determine the effect of cowpea lignocellulosic fibers on the properties of PBSA-based bio-composite foams produced, with azodicarbonamide as a blowing agent. It is hypothesized that fiber addition will alter the viscoelastic properties of PBSA, thus modulating the properties of the resulting bio-composite foams for potential application in non-food contact packaging and agriculture.
2 Experimental Section
2.1 Materials
PBSA BioPBS FD92PM with a density of 1.24 g cm−3 and a melting point of 84 °C was procured from PTT MCC biochem Co.,Ltd (Bangkok, Thailand). Azodicarbonamide (A936606) (97%) was procured from Sigma-Aldrich (Johannesburg, South Africa). The cowpea lignocellulosic fibers were obtained from a local farm (Farm Uitval, Vermass) in June 2021 in the North West province, South Africa, after the grains were harvested. The cowpea fibers were washed extensively with water, followed by vacuum drying at 40 °C for 24 h. This was followed by milling the fibers to less than 500 µm, vacuum packed, and stored in sealed containers until use. The diameter size distribution of the cowpea lignocellulosic fibers is provided Figure S1 (Supporting Information). The fibers had an average diameter of 107 µm after milling.
The extensive characterization of cowpea lignocellulosic fibers was provided in the previous study.[19] Cowpea lignocellulosic fibers were reported to comprise of 39% cellulose, 27% hemicellulose and 13% lignin. In addition, they had a crystallinity index of 55% and an initial degradation temperature of 263 °C.
2.2 Processing of Bio-Composite Foams
Before processing, PBSA was vacuum dried at 60 °C, overnight. Similarly, cowpea lignocellulosic fibers were dried at 60 °C for 24 h. The steps to produce bio-composite foams are summarized in Figure 1. Cowpea fibers were loaded at 0, 5, 10 and 15% to a PBSA matrix, while azodicarbonamide was kept constant at 5% in all formulations.
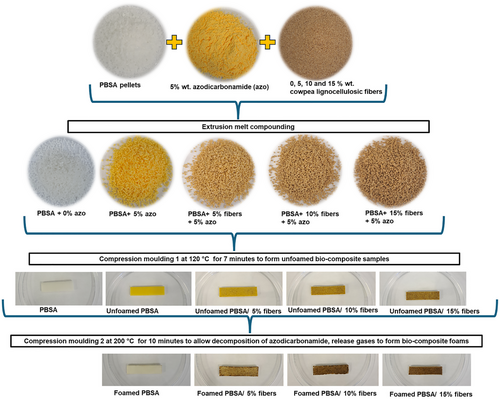
The cowpea fibers, PBSA and azodicarbonamide were compounded using a twin-screw extruder (Process 11, Thermo Scientific, Waltham, MA, USA) with an L/D ratio of 40 to produce bio-composite pellets (Figure 1). The temperature profile of the extruder was 80/80/120/120/120/120/120/120 °C (feed zone to die). The feed rate was set at 15 rpm, and the screw speed was 200 rpm. The extrudates were pelletized and dried before further processing.
To form the bio-composite foams, compression molding was done in two stages (Figure 1) using Carver compression molder, model 973214A, S/N 43000–880 (Carver, USA). The first compression molding step was done at 120 °C for 7 min (including cooling) to form desired shapes. These samples were labeled unfoamed PBSA/x % fibers (Figure 1). In the second stage, the unfoamed bio-composites containing azodicarbonamide were compression molded at 200 °C for 10 min (including cooling), which released gases to form the bio-composite foams. These samples were labeled foamed PBSA/x % fibers, where “x” is fiber loading level (Figure 1).
2.3 Characterization
2.3.1 Rheology
The rheological properties of the unfoamed samples were determined using the Modular Compact Rheometer MCR 302 (Anton Paar, Austria). The disc-shaped samples (1.6 mm thickness) were used to evaluate the melt rheological properties. First, an amplitude sweep test was conducted at 120 °C under a nitrogen environment between 0.01 to 100% strain to determine the linear viscoelastic region. The frequency sweep was conducted at 120 °C between 0.1 to 100 radians at a strain amplitude of 1%.
2.3.2 Colorimetry
For color measurement of the unfoamed and foamed bio-composite, a Chroma Meter CR-400 (Konica Minolta Camera Co, Osaka, Japan) was used. The calorimeter was calibrated with a standard calibration white plate, and samples were measured to obtain the L*, a*, and b* values. L represents luminosity where L* = 0 is darkness, and L* = 100 is lightness. The a and b values are chromaticity coordinates where a*< 0 represents green, a* > 0 represents red, b* < 0 represents blue and b* > 0 represents yellow.
2.3.3 Foam Morphology and Foam Characterization
The bio-composite foams were cryogenically fractured, and the fracture surface was sputter coated with carbon and evaluated using SEM at an accelerating voltage of 3 kV.
The foamed samples were visualized using the Zeiss Stereo Discovery.V20 microscope (ZEISS, Germany) equipped with the PlanApo S 0.63x FWD 81 mm lens.
The average cell size was calculated using image j V 1.8.0 software by measuring at least 300 cells/bubbles per sample from the stereo microscope images.
2.3.4 X-Ray Diffraction (XRD)
The effect of fiber addition on the crystallinity of the unfoamed and foamed bio-composites was evaluated using XRD X'Pert PRO diffractometer (PAN analytical, Netherlands) producing Cu Kα radiation (λ = 1.54 nm). The instrument was operated in a continuous mode at 45 kV and 40 mA. The diffraction pattern was collected between 5 to 40° (2θ) with a scan step of 0.0262606°/s.
2.3.5 Differential Scanning Calorimetry (DSC)
2.3.6 Dynamic Mechanical Analysis (DMA)
The thermomechanical properties of unfoamed and foamed samples were evaluated using DMA 800 (PerkinElmer, USA). The bio-composite samples with dimensions (24.8 mm length × 9.8 mm width) were evaluated in a dual cantilever mode at a frequency of 1 Hz. The samples were heated from -70 to 40 °C at a heating rate of 3 °C min−1.
2.4 Statistical Analysis
The IBM SPSS version 20 statistical software (Armonk, NY: IBM Corp.) was used for statistical analysis of the data. Multifactor analysis of variance (MANOVA) was used to evaluate the data, and the means were compared using Turkey's B test at p ≤ 0.05. The independent variables were the unfoamed and foamed bio-composites containing 0, 5, 10 and 15% cowpea lignocellulosic sidestream, and the dependent variables were the measured values
3 Results and Discussion
3.1 Rheological Properties
The melt rheological properties of the unfoamed bio-composites were investigated, and the effect of fiber addition on complex viscosity and storage modulus during frequency sweep are shown in Figure 2a,b, respectively. All samples displayed a shear thinning behavior, evidenced by a decrease in complex viscosity with an increase in angular frequency (Figure 2a). This shear thinning behavior has been associated with the reduction of polymer chain entanglement as the frequency increases. Thus, leading to a gradual decrease in complex viscosity with an increase in angular frequency, as reported in other bio-composites, such as PBS/PBAT/miscanthus fiber,[22] and PBSA/hop fibers.[23]
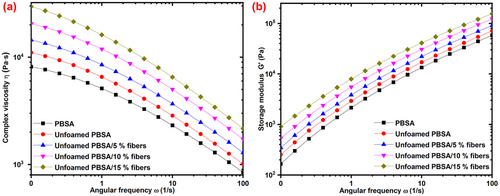
The melt viscosity and melt strength can be evaluated from the complex viscosity and storage modulus. Fiber addition (0–15%) resulted in a gradual increase in the melt viscosity of the unfoamed bio-composites over the entire frequency range (Figure 2a). This has been ascribed to the hinderance of polymer chain mobility and relaxation by the fibers, to increase the melt viscosity, as reported elsewhere for PBS and PBSA-reinforced with fibers.[23, 24] Fiber addition (0–15%) also increased the storage modulus of the bio-composite throughout the entire frequency range (Figure 2b). This has been ascribed to the fibers acting as “crosslinking points” to hinder the polymer chain relaxation, thus increasing the storage modulus.[25]
The increase in both the melt viscosity (complex viscosity) and melt strength (storage modulus) observed with an increase in fiber loading may be beneficial during foaming by controlling bubble size and bubble density. Both the melt viscosity and melt strength were reported to be important viscoelastic properties that affect bubble/cell nucleation, bubble growth, and the stabilization of the bubbles during the foaming process.[4, 26] In particular, poor melt viscosity and melt strength may result in bubble coalescence and rupture, whereas too high melt viscosity and melt strength may result in insufficient bubble growth. Moderate melt viscosity and melt strength are thus important in modulating the size of the bubbles/cells in polymer foams.[4] Therefore, the increase in melt viscosity and melt strength with an increase in fiber loading (0–15%) may affect bubble nucleation and size of the resulting bio-composite foams.
3.2 Color Measurements of Unfoamed and Foamed Samples
The color measurements of the unfoamed and foamed PBSA containing 5, 10 and 15% fibers were conducted, and the results are shown in Table 1. The L*, a*, and b* values are defined as: 0–100 L* (black to white) −a* to +a* (green to red), -b* to +b (blue to yellow). The chemical foaming agent, azodicarbonamide, had L*, a*, and b* values of 90.94, 2.10, and 40.40, respectively. The high b* value of azodicarbonamide indicates its strong yellow color. The cowpea lignocellulosic fibers had L*, a*, and b* values of 68.49, 4.54, and 19.75, respectively.
| Sample | Treatment | L* | a* | b* |
|---|---|---|---|---|
| PBSA | Unfoamed | 74.50 ± 0.17f | −0.99 ± 0.05b | 42.53 ± 0.61e |
| Foamed | 80.05 ± 0.84g | −1.68 ± 0.02a | 9.93 ± 0.32a | |
| PBSA/5% fibers | Unfoamed | 63.17 ± 0.52e | 4.12 ± 0.07d | 30.19 ± 1.03d |
| Foamed | 55.92 ± 0.45d | 5.14 ± 0.34d | 15.64 ± 0.64b | |
| PBSA/10% fibers | Unfoamed | 55.53 ± 0.38d | 5.24 ± 0.34d | 22.90 ± 1.27c |
| Foamed | 45.96 ± 0.63b | 6.90 ± 0.29f | 15.47 ± 0.32b | |
| PBSA/15% fibers | Unfoamed | 51.87 ± 0.51c | 6.09 ± 0.09e | 21.57 ± 0.62c |
| Foamed | 42.94 ± 1.33a | 7.72 ± 0.14g | 14.88 ± 0.75b |
Unfoamed PBSA had a relatively strong yellow color indicated by the relatively high b* value of 42.53 (Table 1), which can be attributed to the presence of azodicarbonamide. The addition of 5, 10, and 15% fibers resulted in a significant decrease (p < 0.05) in the yellow color indicated by b* values of 30.19, 22.90, and 21.57, respectively. The decrease in the yellow color was due to the incorporation of fibers that have a brown-like color.[27] The color of the polymers in bio-composite is influenced by the color of the fibers.[28]
The unfilled PBSA foam had a significantly lower b* value (p < 0.05) of 9.93 compared to unfoamed PBSA, which had a b* value of 42.53. Similarly, the b* values of foamed PBSA containing 5, 10 and 15% fibers were significantly lower (p < 0.05) compared to their unfoamed counterparts. This is because during the second compression molding at 200 °C, azodicarbonamide decomposed to release gases that diffused into the polymer melt, followed by bubble nucleation, bubble growth and bubble stabilization to produce foamed polymeric structures.[16, 29] Therefore, the reduction in the b* values in the bio-composite foams compared to their unfoamed counterparts indicated the decomposition of azodicarbonamide (removal of the yellow color) during foaming.
The lightness (L*) was also affected by fiber addition and foaming. The unfoamed PBSA had L*value of 74.50, which decreased significantly (p < 0.05) to 63.17, 55.53, and 51.87 with the addition of 5, 10, and 15% fibers, respectively (Table 1). The decrease in lightness as a function of fiber loading is due to the incorporation of fibers that confer the bio-composites an intrinsic brown-like color. Dolza et al.[28] also reported a decrease in lightness (L*) of PBSA from 76.0 to ≈43.6 with the addition of hemp fibers due to the composites assuming the brown-like color of the hemp fibers.
The unfoamed PBSA had an L* value of 74.50, which significantly (p < 0.05) increased to 80.05 after foaming. In contrast, the foamed PBSA containing 5, 10, and 15% fibers had significantly lower L* values (p < 0.05) compared to their unfoamed counterparts. This is because the unfoamed bio-composites were subjected to the second compression molding step at 200 °C to produce bio-composite foams. Therefore, repeated heating at higher temperatures resulted in the darkening of the fibers. In general, color measurements were effective in monitoring the removal of azodicarbonamide (thus yellow color) during compression molding to produce bio-composite foams.
Means in the same column with different letters are significantly different (p < 0.05). 0–100 L* (black to white) −a* to +a* (green to red), −b* to +b (blue to yellow).
3.3 Foam Morphology and Foam Characterization
The foam morphology was investigated by stereomicroscope, from which the bubble/cell size distribution was calculated, and the results are shown in Figure 3. The unfilled PBSA foam (Figure 3a) had a large bubble size distribution, ranging from 50 to 400 µm with an average bubble size of 209 µm (Figure 3e). The bio-composite foam containing 5% fibers (Figure 3b) also had a wide bubble size distribution ranging from 50 to 500 µm, with an average bubble size of 180 µm (Figure 3f). Notably, the bio-composite foam also had irregularly shaped large bubbles (Figure 3b). At such low fiber loading (5%), non-homogeneous distribution of the fibers within the polymer matrix may result in inhomogeneous bubble size distribution, since the bubbles nucleate at the polymer/fiber interface during foaming.
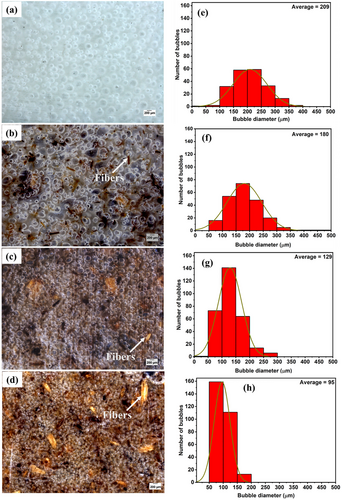
The addition of 10% (Figure 3c) and 15% fibers (Figure 3d) resulted in a significant decrease in the average bubble size, and a relatively uniform/narrow bubble size distribution compared to the unfilled foamed PBSA. Notably, the bio-composite foam containing 15% fibers had the most narrow/uniform bubble size distribution (50 to 200 µm) and the smallest average bubble size of 95 µm (Figure 3h) compared to other bio-composite foams.
Unfoamed PBSA had the largest average bubble size (209 µm) and relatively wide bubble size distribution (50 to 500 µm) compared to the bio-composite foams with 5, 10 and 15% fibers due to the relatively low melt strength viscosity and melt strength, which resulted in unrestricted bubble growth and coalescence of smaller bubbles into larger ones.[4, 10] However, fiber loading (10 and 15%) significantly increased the melt viscosity and melt strength. This restricted uncontrolled bubble growth, coalescence of smaller bubbles and the escape of gas during foaming, thus decreasing the average bubble size and resulted in uniform/narrow bubble size distribution. The smaller bubble size and uniform bubble size distribution in polymeric foams was reported to improve the mechanical properties compared to polymeric foams with larger bubbles.[3, 30] Therefore, it is expected that bio-composite foams containing 10 and 15% fibers (smaller bubbles) will show better mechanical properties, such as stiffness and compressive strength compared to unfilled PBSA foam.
The density of the unfoamed and foamed bio-composites was determined, and the results are shown in Figure 4a. Unfoamed PBSA had a density of ≈1.29 g cm−3, which was statistically insignificant (p > 0.05) compared to the unfoamed PBSA containing 5, 10 and 15% fibers. However, foaming significantly (p < 0.05) reduced the density, with the bio-composite foams at all fiber loading levels (0–15%) having significantly lower density (p < 0.05) compared to their unfoamed counterparts (Figure 4a). This is desired as the bio-composite foams are lightweight compared to their unfoamed counterparts and reduce material use.
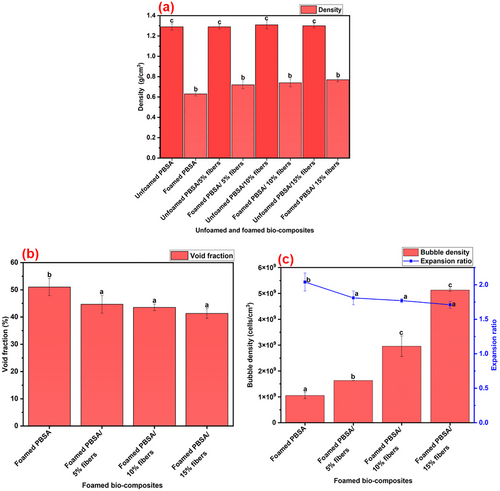
The addition of fibers (5, 10 and 15%) significantly increased (p < 0.05) the density of the bio-composite foams relative to the unfilled PBSA foam (Figure 4a). However, there was no statistical significance (p > 0.05) in the density of bio-composite foams containing 5, 10 and 15% fibers (Figure 4a). The effect of fiber addition on the void fraction of the foams is shown in Figure 4b. The unfilled PBSA foam had a void fraction of 51%, that significantly (p < 0.05) decreased with the addition of 5, 10 and 15% fibers (Figure 4b). However, there was no significant difference (p > 0.05) in the void fraction of the bio-composite foams relative to the unfilled PBSA foam (Figure 4b). The addition of fibers increased the amount of solid material that contributed to the increase in the overall mass per unit volume, thus increasing the density of the bio-composite foams.[31] The increase in the density of the bio-composite foams with fiber addition also corresponded to a decrease in void fraction. This is because an increase in the rigid fiber loading meant that there were more solid materials that occupied the spaces that would otherwise be filled by the bubbles, thus, resulting in lower void fraction and higher density.
The bubble/cell density is defined as the number of bubbles/cells per unit area (cells/cm3). The effect of fiber loading on the bubble density of the bio-composite foams is shown in Figure 4c. Unfilled PBSA foam had a bubble density of 1.03 × 10⁹ cells/cm3, which significantly increased (p < 0.05) with the addition of 5, 10, and 15% fibers (Figure 4c). The bio-composite foam containing 15% fibers had the highest bubble density of 5.13 × 10⁹ cells cm−3, which is about fivefold increase relative to the unfilled PBSA foam. This significant increase in cell density can be explained by the classical nucleation theory (CNT). According to CNT, the addition of rigid fillers (fibers in this case) leads to heterogeneous nucleation, since the gas molecules prefer to be nucleated at the polymer/fiber interphase, due to reduced surface tension that can increase the free energy of the system.[2, 17, 32] Therefore, the increase in fiber loading provided more nucleation sites (polymer/fiber interphase) for more heterogeneous nucleation of the bubbles, which increased the bubble density of the bio-composite foams.
The effect of fiber addition on the expansion ratio is shown in Figure 4c. Unfoamed PBSA had an expansion ratio of 2.04. Fiber addition resulted in a significant decrease (p < 0.05) in expansion ratio, with the bio-composite foam containing 5, 10 and 15% fibers having an expansion ratio of 1.81, 1.77, and 1.71, respectively. However, there was no statistical significance (p > 0.05) in the expansion ratio of the bio-composite foams containing fibers (Figure 4c). The lower expansion ratio upon fiber addition may be due to the fibers providing a strong matrix (higher melt strength and melt viscosity) which resisted expansion during foaming. In addition, fiber loading reduced the amount of polymer matrix available for expansion, as reported elsewhere for ethylene propylene diene monomer rubber foams reinforced with wood fiber.[14]
The morphology of the bio-composite foams was also investigated by SEM and results are shown in Figure 5. These bio-composite foams were all closed-cell foams, with limited ruptured bubbles (indicated by dotted circles) (Figure 5).
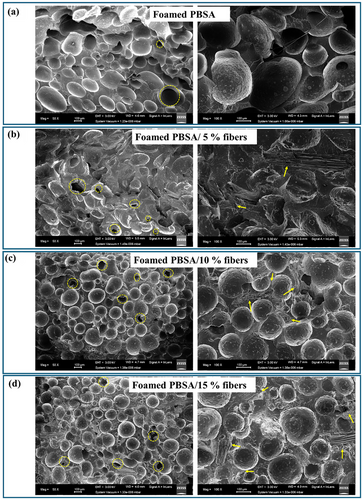
It can be observed from the SEM images (Figure 5a–d) that fiber addition, especially at 10 (Figure 5c) and 15% (Figure 5d) reduced the bubble size and resulted in more uniform/narrow bubble size distribution relative to the unfilled PBSA foam (Figure 5a), as already discussed in Figure 3. The fibers (indicated by arrows) were dispersed in the polymer matrix between the bubbles as a reinforcing agent and inhibited uncontrolled bubble growth. The SEM images also revealed that the cowpea lignocellulosic fibers had good interfacial adhesion to the PBSA matrix, as there was no interfacial gap between the dispersed fibers and the polymer matrix (Figure 5b–d). The good interfacial adhesion between the fibers and PBSA matrix is important for efficient stress transfer when load is applied to increase the strength of the bio-composite foams.
Polymeric foams can be classified according to their cell connectivity, cell size, cell density and expansion ratio, as reviewed extensively elsewhere (Table 2).[33] Based on this classification (Table 2), the PBSA-based bio-composite foams containing 10 and 15% cowpea lignocellulosic fibers can be classified as closed cell, high density (Expansion ratio < 4), fine cellular foams (cell size, 10–300 µm and cell density, 106 to109) (Table 2).
| Bio-composite foam | Cell connectivity | Expansion ratio [ER] | Cell size [CS] and cell density [CD] | Reference |
|---|---|---|---|---|
| Foam classificationa) |
|
|
|
[33] |
| PBSA/15% cowpea fibers | Closed cells |
ER = 1.71 High density |
CS = 95 µm, and CD = 5.13 ×10⁹ Fine cellular, |
This work |
| PLA/20% kenaf fibers | Closed cells |
ER = 1.04 High density |
CS∼180 µm, CD = not determined | [20] |
| PLA/PCL/rice husks (40/40/20) | Closed cells |
ER∼1.5 high density |
CS = 150–750 µm, CD not determined | [18] |
| HDPE/10% rice husks | Closed cells | Not determined | CS = 122 µm, and CD = 4.9 ×10¹¹ | [32] |
- a) foam classification according to Dugad et al.[33] ER is expansion ratio, CS is cell size, CD is cell density and ND is not determined.
The PBSA/15% fibers bio-composite foams were compared to other bio-composite foam reported in literature and summarized in Table 2. It can be observed that the PBSA/15% fibers had higher expansion ratio compared to PLA/kenaf and PLA/PCL/rice husk bio-composite foams (Table 2), which is desirable in reducing material consumption. In addition, a smaller average cell size was achieved in PBSA/15% fiber bio-composite foam compared to PLA/kenaf and PLA/PCL/rice husk bio-composite foams. However, all these foams can be classified as high-density bio-composite foams. These bio-composite foams are comparable to synthetic HDPE foams reinforced with rice husks in terms of cell connectivity, size and density. The HDPE/rice husk foams have higher cell density than PBSA/cowpea fibers, PLA/kenaf and PLA/PCL/rice husks (Table 2). However, the latter are attractive as they are comprised of biodegradable polymers reinforced with lignocellulosic fibers, whereas the former are comprised of non-biodegradable HDPE polymer matrix.
3.4 Crystalline Structure and Crystallinity of Unfoamed and Foamed PBSA-Based Bio-Composite Foams (DSC and XRD)
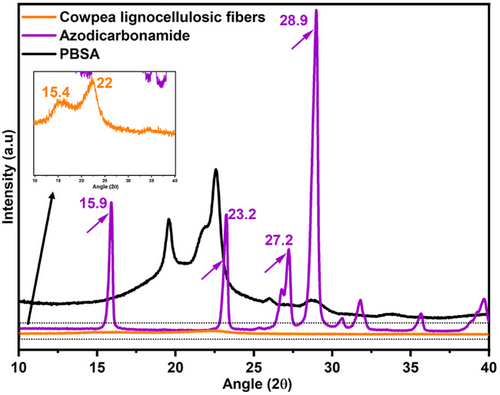
The XRD spectra of azodicarbonamide and cowpea lignocellulosic fibers are shown in Figure 6. Azodicarbonamide is characterized by strong diffraction peaks at 15.9°, 23.2°, 27.2° and 28.9° as indicated by arrows (Figures 6 and 7). Meanwhile, cowpea lignocellulosic fibers are characterized by diffraction peaks at 22° (2θ), 15.4° (2θ), and 34° (2θ) (Figure 6) ascribed to cellulose type I.[34, 35] Azodicarbonamide is a crystalline material, evidenced by the high-intensity diffraction peaks (Figure 6). The crystalline peaks of azodicarbonamide can be seen in the XRD diffraction patterns of the unfoamed bio-composites at all fiber loading levels (indicated by arrows) (Figures 6 and 7). On the other hand, cowpea lignocellulosic fibers are semi-crystalline, characterized by low intensity diffraction peaks (Figure 6). Therefore, the low intensity diffraction peaks associated with cowpea lignocellulosic fibers are not visible in the bio-composite samples (Figure 7), due to their inherent low intensity, and the masking effect of the polymer.
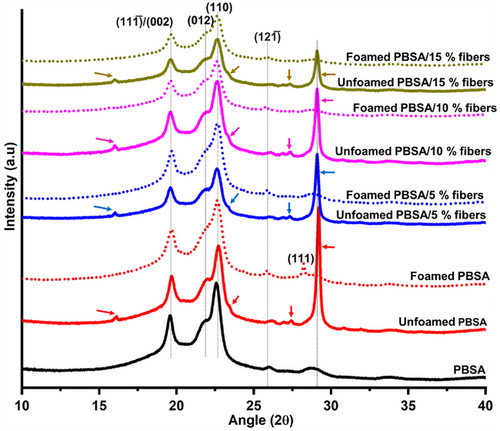
The effect of fiber loading on the crystallinity of the unfoamed and foamed PBSA was investigated by XRD, and the spectra are shown in Figure 7. PBSA is characterized by diffractions peaks at 2θ = 19.7°, 21.8°, 22.6° and 25.8° corresponding to the (111̅)/(002), (012), (110), and (121̅) crystal planes (Figure 7).[36] Azodicarbonamide peaks, indicated by arrows can be observed in all the unfoamed bio-composites samples (Figure 7). However, these peaks associated with azodicarbonamide completely disappeared in the foamed bio-composites at all fiber loading levels, suggesting the complete removal of azodicarbonamide through thermal decomposition at 200 °C, during foaming. This was also shown earlier by color measurements, in which the b* values indicating the yellow color of azodicarbonamide significantly reduced after foaming, suggesting its removal. Thus, it can be suggested that azodicarbonamide is not present in the foamed samples.
The effect of foaming on the crystal structure of PBSA can be observed by comparing the XRD spectra of the unfoamed and foamed bio-composites (Figure 7). All the unfoamed bio-composites displayed a shoulder peak at 2θ = 21.8°, corresponding to the corresponding to the (012) crystal plane; the intensity of this peak decreased after foaming, suggesting that foaming affected the crystal morphology of PBSA. The unfilled PBSA foam had a new diffraction peak at 2θ = 28.2°, corresponding to the (111) crystal plane. Puchalski, Szparaga[36] reported the presence of this crystal plane (111) in pristine PBS and PBSA. In this study, this crystal plane was absent in all samples except the unfilled PBSA foam, suggesting that foaming without the fibers induced different crystal morphology of PBSA. However, fiber addition restricted the occurrence of this crystal plane (111), possibly by reducing the proximity of polymer chains to organize to form this crystal plane.
The effect of fiber addition the crystallinity of both unfoamed and foamed samples can be observed (Figure 7). Notably, in the unfoamed bio-composites, fiber addition reduced the intensity of the (111̅)/(002), (012), (121̅), and (110) crystal planes of PBSA, especially at 10 and 15% fiber loading. This suggests that fiber addition at higher loading reduced the crystallinity of PBSA, which may benefit the foaming of semi-crystalline polymers. This will be discussed further by the DSC results. Similarly, in the foamed bio-composites, the intensity of the peaks associated with PBSA decreased with fiber addition, especially at 10 and 15%, suggesting a decrease in crystallinity.
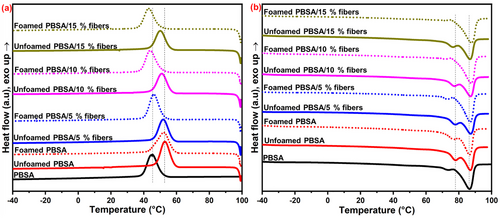
The DSC curves (Figure 8) show the effect of fiber loading on the melt crystallization (Tc) (Figure 8a) and melting (Tm) (Figure 8b) of the unfoamed and foamed PBSA-based bio-composites. The detailed results, that is, Tc, Tm, and crystallinity (Xc), are shown in Table 3. Pure PBSA had a Tc of 45 °C, which increased to 52 °C in the unfoamed PBSA, indicating that azodicarbonamide was potentially acting as a nucleating agent to promote the crystallization of PBSA (Figure 8a and Table 3). The addition of 10 and 15% fibers significantly decreased (p < 0.05) the Tc relative to the unfoamed PBSA, suggesting that the fibers delayed nucleation of polymer crystallization by hindering molecular chain mobility of the polymers, as reported elsewhere for fiber-reinforced polymers.[13] Thus, it appears that azodicarbonamide and the fibers have an opposing effect on the Tc of PBSA, with azodicarbonamide promoting nucleation and the fibers delaying nucleation.
| Sample | Treatment | Tm1 [°C] | Tm2 [°C] | Tc [°C] | Xc [%] |
|---|---|---|---|---|---|
| PBSA | Unfoamed | 77.81 ± 0.03d | 86.86 ± 0.01ab | 52.78 ± 0.00e | 45.68 ± 0.05c |
| Foamed | 76.69 ± 0.16bc | 86.64 ± 0.21a | 52.05 ± 0.10e | 43.65 ± 0.35bc | |
| PBSA/5% fibers | Unfoamed | 77.54 ± 0.16cd | 87.19 ± 0.04bc | 52.08 ± 0.22e | 43.53 ± 0.66bc |
| Foamed | 72.20 ± 0.39a | 87.02 ± 0.00ab | 45.85 ± 0.42b | 41.96 ± 0.91ab | |
| PBSA/10% fibers | Unfoamed | 76.74 ± 0.56bc | 86.94 ± 0.24ab | 51.09 ± 0.33d | 44.03 ± 0.34bc |
| Foamed | 71.58 ± 0.00a | 87.51 ± 0.06cd | 43.75 ± 0.21a | 42.75 ± 0.44ab | |
| PBSA/15% fibers | Unfoamed | 75.94 ± 0.18c | 86.92 ± 0.17ab | 50.11 ± 0.11c | 41.76 ± 1.14ab |
| Foamed | 71.31 ± 0.37a | 87.70 ± 0.11d | 43.10 ± 0.10a | 40.89 ± 0.40a |
The unfoamed and foamed PBSA had a similar Tc of 52° C, suggesting that foaming did not affect the melt crystallization of PBSA in the absence of the fibers (Figure 8a and Table 3) However, the Tc of the foamed PBSA containing 5, 10 and 15% decreased compared to their unfoamed counterparts, suggesting that foaming in the presence of the fibers suppressed the nucleation of PBSA. This may be ascribed to (1) the fibers hindering polymer chain mobility toward nucleation, and (2) the presence of the cells/bubbles in the foamed samples reducing the proximity of the polymer chains to hinder polymer chain diffusion toward nucleation.[10]
PBSA displayed double melting peaks, with a minor peak at 73 °C (Tm1) and a major melting peak at 86 °C (Tm2) (Figure 8b and Table 3). The double melting phenomenon of PBSA can be ascribed to the melt crystallization behavior during the heating process, whereby the melting and crystallization of imperfectly formed crystals takes place, and is preceded by the melting of crystals with higher thermal stability formed through recrystallisation.[23, 37, 38] It may also be due to different crystal lamella formations, resulting in heterogeneous crystal morphology.[38] The foamed PBSA containing 0, 5, 10 and 15% fibers had a significantly lower Tm1 (p < 0.05) and showed a decrease in the intensity of this peak compared to their unfoamed counterparts, with the major melting peak (Tm2) becoming more intense (Figure 8b). This suggests that foaming suppressed the formation of imperfect crystals (Tm1) and resulted in more homogeneous crystal morphology of PBSA.
The crystallinity of unfoamed and foamed bio-composites was calculated from the second melting curve and the results are shown in Table 3. Pure PBSA had a crystallinity of 43%, with the unfoamed PBSA having higher crystallinity of 45% due to the nucleating effect of azodicarbonamide. The unfoamed and foamed bio-composites at similar fiber loading had no significant difference (p > 0.05) in crystallinity. However, high fiber loading (10 and 15%) resulted in the reduction in crystallinity of both unfoamed and foamed bio-composites relative to their unfilled counterparts. This was also observed by the decrease in the intensity of the XRD diffraction peaks at high fiber loading (Figure 7). In semi-crystalline polymers like PBSA, a lower crystallinity may benefit greater gas solubilization and diffusion in the amorphous phase as the crystals are impermeable to gases.
Means followed by standard deviation. Means with different letters in the same column are statistically significant (p < 0.05).
3.5 Thermomechanical Properties of Unfoamed and Foamed Bio-Composites
The thermomechanical properties of the unfoamed and foamed bio-composites are depicted by dynamic storage modulus and tan delta curves (Figure 9). Storage modulus (E′) indicates the stiffness of the material, which corresponds to the stored energy during the dynamic cycle (Figure 9a). The E′ of both unfoamed and foamed samples decreased with an increase in temperature, indicating their softening at higher temperature, which is an intrinsic property of thermoplastic polymers. The E′ of foamed samples was significantly lower compared to the unfoamed counterparts at similar fiber loading across the entire temperature range. This is likely due to the presence of bubbles/cells in the bio-composite foams, which reduced the ability of the matrix to support stress, thus leading to lower E′ compared to their unfoamed counterparts.[15, 17]
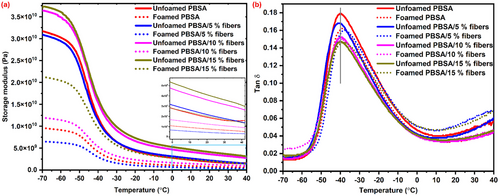
The unfoamed PBSA containing 5% fibers had lower E′ compared to unfoamed PBSA without the fibers, at lower temperatures. This may be related to inhomogeneous fiber distribution within the polymer matrix, leading to localized stress concentration that may lead to lower E′. Joseph et al.[39] reported that at low fiber loading, insufficient fibers are available to restrain the polymer matrix, resulting in the polymer matrix being diluted by non-reinforcing deboned fibers. The addition of 10 and 15% fibers resulted in an increase in the stiffness (E′) of the unfoamed bio-composites over the entire temperature range due to the reinforcing effect of the fibers. The fibers can restrict the molecular chain mobility of the polymer to increase the stiffness of the bio-composites.[14]
The E′ of the bio-composite foams followed a similar trend to the unfoamed bio-composite with fiber loading (Figure 9a). Notably, the bio-composite foam containing 5% fibers had lower E′ compared to unfilled PBSA foam over the entire temperature range (Figure 9a). As explained earlier, the non-homogeneous dispersion of fibers at 5% loading may lead to lower E′ compared to the unfilled bio-composite. In addition, the non-homogeneous bubble/cell size and cell size distribution observed in bio-composite foams containing 5% fibers (Figure 3) may lead to lower stiffness compared to unfilled PBSA foam. Non-homogeneous dispersion of cells/bubbles was also reported to deteriorate the properties of polymeric foams.[32]
The E′ of the bio-composite foams increased with the addition of 10 and 15% fibers over the entire temperature range (Figure 9). This can be attributed to the reinforcing effect of the rigid fibers that restrict molecular chain mobility to increase stiffness. In addition, the bio-composites containing 10% (Figure 3c) and 15% (Figure 3d) had uniform bubble/cell size distribution, which are known to improve the mechanical properties of foamed structures.[3, 30] Therefore, the addition of fibers, especially at higher loading (10 and 15% fibers), not only acted as a reinforcing agent to increase the stiffness of the bio-composite foams but also effectively acted as nucleating agents to produce bio-composite foams with higher bubble density and small bubble size.
The tan δ curve of the unfoamed and foamed bio-composites is shown in Figure 9b. The maximum tan delta of all samples occurred ≈−39 °C, which is the glass transition temperature (Tg) of PBSA. The addition of fibers and foaming did not significantly affect the Tg of PBSA (Figure 9b). However, the height of tan delta at Tg which indicates dampening was affected by fiber addition in both unfoamed and foamed bio-composites. Fiber addition in both unfoamed and foamed bio-composites reduced the height of tan delta at Tg. In general, a composite with good matrix/fiber adhesion dissipates less energy due to reduced molecular chain mobility at the fiber/matrix interphase, thus resulting in a decrease in height of tan delta at Tg.[40, 41] Therefore, a decrease in the tan delta peak at Tg suggests good interfacial adhesion between the cowpea fibers and PBSA matrix, as shown by SEM (Figure 5). Good interfacial adhesion between PBSA and cowpea fibers was also reported in previous studies.[13]
4 Conclusion
PBSA-based bio-composite foams reinforced with low-value cowpea lignocellulosic fibers (0, 5, 10, and 15%) are produced by extrusion followed by compression molding with azodicarbonamide as a blowing agent. Foaming significantly reduces the density of the bio-composite foams by almost 50% compared to their unfoamed counterparts, at all fiber loading levels. Furthermore, foaming significantly reduces the stiffness of the bio-composite foams compared to their unfoamed counterparts. Fiber addition can increase the melt strength and melt viscosity, which in turn controls the nucleation and growth of the bubbles. During foaming, the presence of rigid fibers act as a heterogeneous nucleating agent to change the foam properties compared to the unfilled PBSA foam. Mainly, fiber addition results in bio-composite foams with smaller bubble size, lower expansion, lower void fraction, and higher bubble density relative to the unfilled PBSA foam. Moreover, the fibers can act as a reinforcing filler to increase the stiffness of the bio-composite foams. These fine-cellular, closed-cells and high-density bio-composite foams can potentially serve as an alternative to petroleum-based and non-biodegradable foams for packaging, agriculture, and insulation applications.
Acknowledgements
This work received funding from the National Research Foundation of South Africa (grant number MND200622534882), the European Union's Horizon 2020 research and innovation programme under grant agreement number 862170, and DSI/NRF Centre of Excellence in Food Security grant ID number 91490.
Conflict of Interest
The authors declare no conflict of interest.
Author Contributions
M.A.M. performed conceptualization, methodology, formal analysis, investigation, software, wrote – original draft, wrote – reviewed, and edited. J.T.K. performed conceptualization, validation, wrote, reviewed, and edited, supervision. S.S.R. performed conceptualization, validation, funding acquisition, resources, supervision, wrote, reviewed, and edited. M.E. performed conceptualization, validation, funding acquisition, resources, supervision, wrote, reviewed, and edited, project administration.
Open Research
Data Availability Statement
The data that support the findings of this study are available from the corresponding author upon reasonable request.


