4D Printing of Polyvinyl Chloride (PVC): A Detailed Analysis of Microstructure, Programming, and Shape Memory Performance
Abstract
In this research, polyvinyl chloride (PVC) with excellent shape-memory effects is 4D printed via fused deposition modeling (FDM) technology. An experimental procedure for successful 3D printing of lab-made filament from PVC granules is introduced. Macro- and microstructural features of 3D printed PVC are investigated by means of wide-angle X-ray scattering (WAXS), differential scanning calorimetry (DSC), and dynamic mechanical thermal analysis (DMTA) techniques. A promising shape-memory feature of PVC is hypothesized from the presence of small close imperfect thermodynamically stable crystallites as physical crosslinks, which are further reinforced by mesomorphs and possibly molecular entanglement. A detailed analysis of shape fixity and shape recovery performance of 3D printed PVC is carried out considering three programming scenarios of cold (Tg −45 °C), warm (Tg −15 °C), and hot (Tg +15 °C) and two load holding times of 0 s, and 600 s under three-point bending and compression modes. Extensive insightful discussions are presented, and in conclusion, shape-memory effects are promising,ranging from 83.24% to 100%. Due to the absence of similar results in the specialized literature, this paper is likely to fill a gap in the state-of-the-art shape-memory materials library for 4D printing, and provide pertinent results that are instrumental in the 3D printing of shape-memory PVC-based structures.
1 Introduction
Smart materials are a class of materials with extraordinary properties of responding to external stimulations, bringing added functionalities to this type of material as sensors and actuators.[1] Shape memory materials (SMMs) can be found in the form of polymers, metals, and ceramics with a great ability to recover their original shape after deformation, implementing various stimulations.[2] Shape memory polymers (SMPs) are one of the most important classes of smart materials, attracting academics' and industries' attention over the past two decades.[3, 4] SMPs offer some benefits such as low density, affordability, good processability, and capability of large strains, compared to shape memory alloys (SMAs).[5] SMPs’ microstructure should consist of two components that are essential for exhibiting Shape Memory Effect (SME), the hard phase and the soft phase.[6, 7] In a shape memory cycle, the imposed deformation is fixed by hindering the chain mobility via free volume relaxation upon cooling the deformed SMP sample down to its glassy state.[8] Chemical crosslinks and crystalline or molecular entanglements can act as net points for thermoset and thermoplastic SMPs, respectively.[6, 8, 9] The soft phase or switching phase is responsible for storing and releasing the imposed large strain by rubber to glass and glass to rubber transition, respectively. Glass/rubber and melting/crystallization transitions can serve as switching phenomena. Rubbery state for thermo-responsive SMPs working with glass transition temperature (Tg) provides sufficient chain mobility and hyperelasticity for severe deformations. The imposed deformation is fixed by inhibiting the chain dynamic via free volume contraction upon cooling the deformed SMP sample to its glassy state.[7, 8] The polymer chains’ extraordinary capability of conformational change makes SMPs yield a large strain that can be “frozen” by cooling to a glassy state. The strain-induced conformational changes result in a decrease in the entropy level producing a driving force for the recovery process via entropic elasticity.[8] Vast numbers of thermoset SMPs and their composites have been developed majorly based on epoxy and polyurethane. Nevertheless, the limited number of manufacturing processes and lack of recyclability for thermoset SMPs leads researchers to work on the development of thermoplastic SMPs.[5] Thermoplastic SMPs can be in the form of homopolymers, copolymers, or polymer blends.[10] As mentioned earlier, thermoplastic SMPs have net points of crystallites and molecular entanglements for semicrystalline and amorphous SMPs, respectively. Hao et al.[11] have claimed that tie molecules, by which the polymer system keeps connected, are responsible for SME. The tie molecules act as a connecting bridges between two different phases of crystallite and amorphous/another crystallite domain for semicrystalline thermoplastic SMPs and two different phases for block copolymers SMPs. In the case of amorphous and semicrystalline homopolymers with a low degree of crystallinity (<10% degree of crystallinity), molecular entanglements play the main role in exhibiting SME. Among thermoplastic SMPs, PLA, its composites, and blends have been studied extensively. In most recent studies, Liu et al.[12] 3D printed PLA/TPU/Fe3O4 magneto-responsive smart structures with robust mechanical properties and SME. Yang et al.[13] prepared a biodegradable shape memory PLA/PCL blend with robust SME using a novel eccentric rotor mixer (ERM), making an efficient dispersion in absence of a compatibilizer.
The intrinsic freedom of the additive manufacturing (AM) technique makes it highly practical for fabricating on-demand samples in the fields of biomedical, automotive, aerospace, construction, and food industries.[14-16] The fused deposition modeling (FDM) or fused filament fabrication (FFF) method is the most developed and promising AM technique for 3D printing thermoplastic polymers.[17, 18] Several commercialized engineering thermoplastics in the form of filament have been developed as the FDM feedstock. However, this technique demands a larger variety of consumable thermoplastic feedstock with a wider variety of mechanical, optical, thermal, and intelligent properties to make FDM, with all of its potential and advantages, one of the most reliable thermoplastic manufacturing techniques. 4D printing is the newest hot topic in the field of AM, which refers to the 3D printing of smart materials like SMPs.[19, 20] The extra dimension is attributed to the shape transformation of the 3D printed parts over time.[21, 22] Advanced applications of 4D printing for self-assembly, self-adaptation, sensing, and actuating have made it a charming research topic over the past decade.[23] These applications have been introduced for 4D printed parts in healthcare, soft robotics, textile, and automotive fields thanks to their dynamic behavior.[19, 20] In recent research works on 4D printing, the “4D printing” term is dedicated to the active behavior of shape transformation of 3D printed parts upon stimulation.[21, 22, 24] However, the shape memory behavior of 3D printed parts, which have been thermomechanically programmed after 3D printing, can dignify them with the 4D printing term roughly. But, it seems more accurate to use the “shape memory behavior or effect of the 3D printed part” phrase for 3D printed SMP parts that have been programmed after 3D printing. Utilizing common thermoplastics like PLA, PETG, polyurethane-based SMPs, functionally graded printing, shape programming, inducing pre-strain,[8, 25-28] and multi-material shrinkage mismatch-driven shape memory structures[29] have made FDM one of the most important techniques for 4D printing.[6] Nevertheless, the growing trend of 4D printing by FDM technique has become moderated because of the limited number of the introduced 4D printable thermoplastic materials.
Polyvinyl chloride (PVC) is a transparent thermoplastic, commonly amorphous, with a chemical formula of C2H3Cl, containing 57% mass of chlorine.[] Cost efficiency, excellent mechanical properties (stiffness and impact strength), chemical resistance, and durability have made PVC one of the most consumable plastics in the world in the construction, electrical, automotive, medical, and packing industries.[31] PVC can be processed with most of the melt processing techniques such as extrusion, injection, and blow molding due to its high melt viscosity.[31] Commercial PVC is usually treated as an amorphous thermoplastic because of its mechanical and optical properties. However, the crystallinity of polymers is mainly attributed to the thermo-temporal condition (e.g., cooling rate) and implemented processing method. But there are some intrinsic features well affect crystallinity. For PVC, the lack of configurational order has made its crystallization behavior comparable to poly (ethylene terephthalate) copolymers, such that its nucleation kinetic is very high, but it fails to form spherulite.[32] According to the open literature, PVC has been proved to be a semicrystalline polymer in nature, and two crystallite types have been recognized in PVC. The primary crystallites that are in lamellar folded chains form with higher perfection and thermodynamical stability as well as thickness, while the secondary crystallites are in a fringed micellar form with a lower degree of order and smaller size.[33, 34] The crystallinity of PVC strongly depends on its molecular architecture, molecular weight, polymerization method, and temperature, as well as its thermal and mechanical history (processing condition). Therefore, a wide range of the possible degree of the PVC's crystallinity exists, making the PVC's crystallinity, as well as its XRD spectrum, always controversial.[35-37]
Extrusion-based 3D printing processes cause molecular orientation along the raster direction thanks to two shear stresses, first the extrusion-induced shear and second the deposition-induced shear.[8, 38] Also, printing temperature and speed can impact the resultant degree of molecular orientation, so higher printing speeds and lower printing temperatures increase the degree of molecular orientation.[8, 25, 29] The higher the melt elasticity the higher the FDM-driven molecular orientation because of the hindered stress relaxation and disentanglement during shear imposing. Aberoumand et al.[8] investigated the effects of the printing temperature and speed on the degree of molecular orientation of PETG SMP by employing polarized light microscopy (PLM). The molecular orientation was found even in the sample printed at the highest temperature and with the lowest printing speed, showing the tendency of the polymeric chains orienting by the FDM process, especially for SMPs with effective net points. Costanzo et al.[39] reported the same observation of polymeric chain alignment.
Although PVC is widely used in different applications as mentioned above, their shape memory performance, and comprehensive microstructural assessment have been left unexplored and require research efforts. In this study, for the first time, PVC with a promising shape memory effect is 3D printed using FDM technology. An experimental procedure for successful FDM 3D printing of lab-made filaments from PVC granules is detailed. Wide-Angle X-ray scattering (WAXS), differential scanning calorimetry (DSC), and dynamic mechanical thermal analysis (DMTA) methods have been employed to interpret the microstructural features attributed to the SME of 3D printed PVC. The shape memory performance of 3D printed PVC is comprehensively evaluated under three deformation temperatures of cold (Tg −45 °C), warm (Tg −15 °C), and hot (Tg +15 °C), and two load holding times of 0 s, and 600 s in bending and compression modes. The results reveal a high SME performance for PVC 3D printed in this research. Due to the absence of similar procedures and results in the specialized literature, this paper is likely to fill a gap in the state-of-the-art shape memory materials for 3D printing and provide pertinent results that are instrumental in the reliable design of shape-memory PVC-based structures fabricated by 3D printing. The introduction of a new FDM 3D printable thermoplastic along with the shape memory effect can broaden the material choice for functional parts' 4D printing for biomedical applications, like self-conforming splints, self-deployable stents, and wearable rehabilitation devices, or soft robotics, and mechanical actuators needing extreme mechanical durability and properties, and actuation controllability.[16, 40] The results and discussion provided in this study shed light on the controllable shape memory performance of 3D printed PVC, considering the unique microstructural features of commercial PVC along with stress relaxation behavior, and different deformation temperatures.
2 Research Methods
2.1 Materials
Commercial nontoxic rigid PVC granules were purchased from Pishro Plast Bespar Co. with a K value of 65. The purchased PVC granule was heat stabilized and plasticized for adequate melt processability. The K value provides important information about the physical properties (mechanical and rheological) of PVC's molecular weight, its distribution, and the related viscosity. Based on the results,[41] the PVC with a K value of 65 has an inherent viscosity of 0.88 dL g−1, Mn = 38.5 × 10³ g mol−1, Mw = 78.0 × 10³, and PDI of about 2.
2.2 Additive Manufacturing
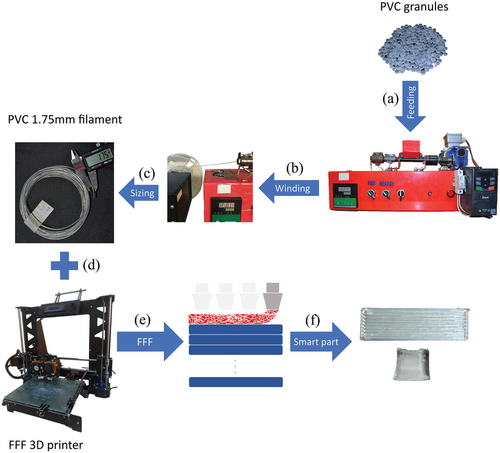
Figure 1 illustrates a 3D printing procedure for PVC sample fabrication. Each stage of the procedure is described in detail as follows.
2.2.1 Filament Preparation
1.75 mm filament as FDM 3D printing feedstock was prepared by a lab-made single screw laboratory-sized extruder equipped with a circular 1.75mm diameter die, and L/D of 15. The extrusion temperature and shear rate were set at 215 °C and 25 RPM, respectively. Then the PVC extrudate was winded around a spool rotated by a servo-motor with 5 RPM.
2.2.2 Fused Deposition Modeling (FDM) 3D Printing
A lab-made FDM 3D printer was used to print the bending and compression test samples. The high melt elasticity of PVC makes its extrusion-based 3D printing challenging at lower processing temperatures. On the other hand, higher temperatures cause thermal degradation of PVC, deteriorating mechanical and optical properties. Based on the results of FDM 3D printing condition determination of plasticized PVC, higher nozzle diameters, and lower printing speed (lower output volumetric flow) enhance the printability of PVC and overcome the high melt viscosity of the PVC to be extruded and deposited. Therefore, all the samples were printed with a 0.8 mm nozzle diameter, and 100% infill density with a linear longitudinal printing pattern and built plate temperature of 50 °C. Printing temperature and speed of 200 °C and 10 mm s−1 were selected for PVC by trial and error in the range that suitable pressure for extruding the filament without degradation (yellowing) could be provided.
2.3 Characterization Methods
Scanning electron microscopy (SEM) and a universal tensile testing machine were used to evaluate PVC's 3D printability by FDM. Dynamic mechanical thermal analysis (DMTA), wide angle X-ray scattering (WAXS), and differential scanning calorimetry (DSC) tests were conducted for characterizing the thermomechanical, microstructural, and thermal properties of the 3D printed PVC.
2.3.1 Fused Deposition Modeling (FDM) 3D Printability
The 3D printability of PVC was examined using SEM imaging and mechanical testing. The sample was fractured under liquid nitrogen and coated with gold to get prepared for SEM imaging. SEM imaging was conducted employing a PhilipsXL30 scanning electron microscope (The Netherlands) in secondary electron mode. A customized universal tensile test machine (Khallagh Sanat Atieh Peyman Company, Iran) was used to characterize the mechanical properties of 3D printed PVC in two deformation modes of three-point bending and uniaxial compression. A three-point bending set-up with cylindrical supports (diameter: 5 mm, distance:30 mm) was used. The bending specimens were printed with a dimension of 50 mm × 15 mm × 4.8 mm. The bending sample was deformed with a deflection of 7 mm and a deformation speed of 3 mm min−1. The compression sample with a cubic geometry of 10 mm × 10 mm × 10 mm was deformed up to 80% with a deformation speed of 3 mm min−1.
2.3.2 Dynamic Mechanical Thermal Analysis (DMTA)
DMTA was performed by a Dynamical Mechanical Thermal Analyzer (Mettler Toledo, Switzerland) over a temperature range of 0 °C to 100 °C with a 5 °C min−1 heating rate and a constant 1 Hz frequency using a cantilever beam printed in the geometry of 40 mm × 10 mm × 1 mm under bending mode (ASTM D4065-01 standard). DMTA test was conducted to determine the different thermal zones of PVC.
2.3.3 Wide-Angle X-Ray Scattering (WAXS)
The crystallization behavior of the 3D-printed single layer of PVC with a dimension of 50 mm × 10 mm × 200 µm was analyzed using a WAXS (X'PERT MPD, Philips, The Netherlands) equipped with a monochromatic X-ray beam (λ = 0.154056 nm for CuKα radiation). The operating voltage and current were 40 kV and 30 mA, respectively. The sample was scanned from 2θ = 10° to 50°. The deviated data were filtered using MATLAB software employing the third-order 1D median filtration method. The subtraction of the filtered total and amorphous background curve is plotted to represent the possible total ordered region pattern. Obande and Gilbert[42] proposed that the degree of crystallinity of a processed PVC sample can be calculated by dividing the area under the curve between the total filtered and background (amorphous) curves by that of the total filtered curve.
2.3.4 Differential Scanning Calorimetry (DSC)
Thermal properties of the 3D printed PVC part were examined using a DSC instrument (Mettler Toledo, Switzerland) and analyzed using STARe software version 12.00. Calibration of the heat flow and temperature was done by employing a high purity indium standard (156.6 °C and 28.45 J g−1). All the measurements were conducted on about 11 mg sample sealed in an aluminum pan under the nitrogen atmosphere with a purge flow of 50 mL min−1. First, the sample was heated up to 220 °C at 10 K min−1 (0.1667 K s−1), cooled down to −50 °C, and reheated to 220 °C at the same rate. The PVC's degree of crystallinity was calculated based on the DSC data, which is more reliable than WAXS.
2.4 Shape Memory Effect (SME)
The SME examination was done using a customized universal tensile test machine (Khallagh Sanat Atieh Peyman Company) equipped with a temperature-controlled liquid chamber to characterize the thermomechanical response of SMPs.
2.4.1 Thermomechanical Programming
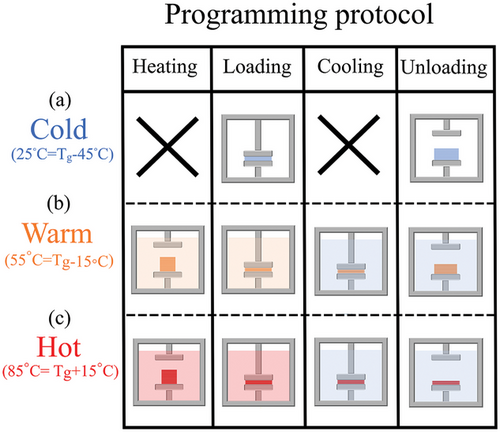
The standard programming protocol of an SMP, which is called hot programming, is consistent with the four stages described in Figure 2 (c). First, for SMPs that work with glass to rubber transition, the sample should be heated up to glass transition temperature (Tg) to become hyperelastic, then the deformation is applied to the sample. The deformed sample is held for a predetermined load holding time, and after, is cooled below Tg, down to the ambient temperature. Finally, the deformed sample is unloaded to release the unstored deformation for calculation of the shape fixity ratio as a measure of applied deformation/stress storage. The warm programming protocol follows the same trend while the deformation temperature is lower than the Tg peak, but is selected inside the peak range. As shown in Figure 2, the cold programming procedure is simpler and quicker than the other two protocols with a halved programming stages old programming (CP) is performed in two stages loading the sample at ambient temperature with a specific load holding time, and unloading.
2.4.2 Shape Recovery
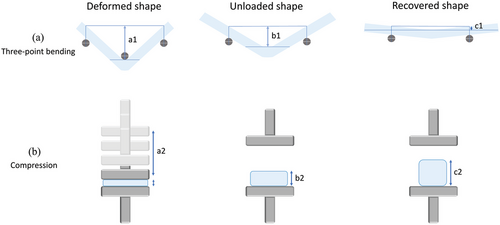
Two deformation modes of three-point bending and uniaxial compression were selected for the shape recovery test. For bending programming mode, a three-point bending fixture equipped with cylindrical supports with a diameter of 5 mm and a distance of 30 mm was used. The bending specimens were printed with a dimension of 50 mm × 15 mm × 4.8 mm. All the samples were deformed with the same deflection of 7mm and deformation speed of 3 mm min−1. The hot, warm, and cold programming protocols with two different load holding times of 0 and 600 s were applied. After unloading the sample, the shape fixity ratio for each programmed sample with a specific deformation temperature and load holding time were calculated. The free shape recovery procedure was conducted by reheating the deformed samples greater than Tg (submerging in boiling water) without any constraint upon full recovery for at least 5 min for shape recovery ratio calculation. Also, the shape recovery rates of bent samples were calculated by dividing the recovery ratio of each particular sample by the time recorded for their maximum recovery ratio.
3 Results and Discussions
3.1 Fused Deposition Modeling (FDM) 3D Printability of PVC
Figure 4 provides essential information about the FDM 3D printability of PVC. As it is shown in the SEM images in Figure 4a,b, some voids can be found between printed rasters which is the fingerprint of FDM 3D printing method. Ideally, the perfect FDM 3D printed sample should be in bulk form without any void or defect with 100% density. However, because of the incomplete melting of the extrudates, rapid cooling of printed rasters, cylindrical shape of printing nozzle die, and specific rheological conditions (considerable melt elasticity) of polymers, void and defect formation are unavoidable.[43-45] It is recommended that the size and geometry of these voids along with the printed raster's coalescence can be controlled to approach the optimum condition sample's integrity via employing the right combination of 3D printing parameters.[46] Employing higher nozzle diameters, lower layer heights, higher printing temperatures, and lower printing speeds are recommended to enhance the 3D printability of PVC by minimizing the void size and making the voids elliptical, and maximizing the rasters’ coalescence.[43, 47] The mentioned qualities for the optimum 3D printing condition can be found in SEM images (Figure 4a,b) of a 3D printed PVC part which was printed at 200 °C and 10 mm s−1, and with a nozzle diameter of 0.8 mm and a layer height of 200 µm. It is worth mentioning that 3D printing geometrical fidelity for 3D printed PVC can be affected mainly by the sample's geometry when the other printing parameters have been kept constant.[45, 48] The sample's geometry determines the peak temperature and temperature distribution inside the sample, directly affecting shape fidelity. Smaller samples with a considerable height are at the risk of losing shape fidelity under the effect of higher peak temperature inside the sample close to the top. This condition causes the rubbery printed layers that are close to the top to release the printing-induced prestrain and shrink, decreasing the shape fidelity by approaching the sample's top. This situation can get worse when the 3D printing feedstock has a high melt elasticity like PVC. As can be seen on the bottom right side of Figure 4c,d for bending and compression 3D printed PVC samples, the shape fidelity of the bending sample which is bigger and more planar is better than that of the compression sample with wrapped edges at the top.
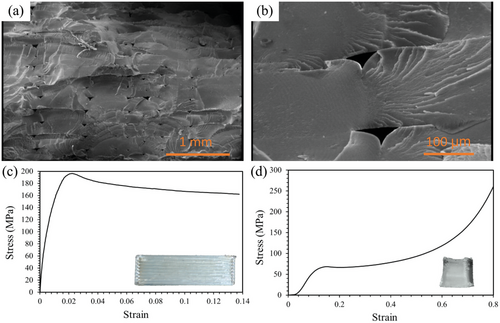
Figure 4c,d shows the stress–strain curve for three-point bending and uniaxial compression modes, respectively. 196.30 MPa ultimate stress was recorded for PVC under bending at the strain of 0.2. The bending sample withstands 7 mm bending deflection (almost 0.14 strain), as the maximum achievable deflection of the set-up, without failure, showing superior ductility along with high strength for 3D printed PVC. 68.25 MPa yield stress at the strain of 0.15 was recorded for 3D printed PVC under compression. Both bending and compression samples moderately showed a strain-softening phenomenon after yielding. The compression sample did not show failure even up to 80% compression because of the clack closure phenomenon that happens in compression.[43]
Among FDM 3D printing feedstocks, PVC has shown its superiority of having a great tensile strength almost 93% higher than the greater strength that is reported for PLA, and also higher than PEEK.[43] Also, 3D printed PVC has shown favorable ductility at ambient temperature. This feature has brought the opportunity for the cold programming of PVC, which seems impossible for PLA, as one of the most researched FDM 3D printable SMP. As a result, the addition of elastomers like TPU to PLA is recommended to make PLA as tough as is suitable for cold programming.[49-51] In the case of the shape memory effect of PVC, the combination of its high stiffness and strength and suitable ductility can make it exceptional among other FDM 3D printable SMP filaments like PLA and PU-based, whose ductility and stiffness are weak for the former, and the latter one, respectively.
3.2 Dynamic Mechanical Thermal Analysis (DMTA) Results
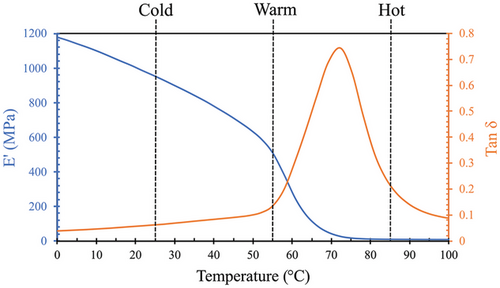
Figure 5 depicts the storage modulus (blue line) and tanδ (orange line) versus the temperature curve of PVC. Li et al.[52] have specified the different deformation temperature zones in DMTA curves with respect to the relative distance from tanδ peak for different programming protocols. The cold, warm, and hot programming conditions are selected as a temperature distant from the tan δ peak, in the beginning of the peak, and at the end of the peak, respectively. Thus cold, warm, and hot deformation temperatures read 25 °C (ambient temperature), 55 °C, and 85 °C, respectively. Different thermal zones can be determined much more easily to the storage modulus values and curve over the temperature range. After a steep fall between 55 to 80 °C, the storage modulus value hits the level off at the temperature of 85 °C in which the PVC is completely rubbery (hot condition). The storage modulus at 55 °C is nearly in the middle of the modulus drop ranges between two endpoints of 25 °C and 85 °C, and located roughly at the start of the steep modulus drop region of the glass transition. Besides, there is a constant difference between the successively selected temperatures. The warm deformation temperature could be chosen higher than 55 °C, below 85 °C, but because the main purpose of programming at a lower temperature (warm and cold) is energy and time saving as well as facilitating the programming protocol, warm deformation temperature should be selected as small as possible.[53]
3.3 X-Ray Diffraction (XRD) Results
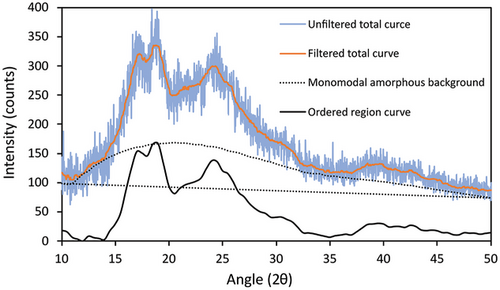
As illustrated in Figure 6, the XRD spectrum of PVC (solid orange line) represents an orthorhombic lattice structure with parameters of a = 10.24–10.60 Å, b = 5.24–5.40 Å, and c = 5.08–5.10 Å consisting small segments along the chain axis, showing imperfection of PVC's crystallite.[32, 35, 37, 54, 55] The miller plane indices and interplanar spacing associated with each peak are specified in Table 1. The two first peaks of 17.15 and 18.72° in the low-angle region, specifically below 25°, are associated with the main fingerprint of the orthorhombic unit cell in spacings of around 5 and 4.7 Å, respectively. The peak of 24.45° is attributed to the close arrangement of Cl atoms by van der Waals distance of around 3.6 Å, representing 210 planes of an orthorhombic lattice.[56] To interpret the microstructural features of the 3D printed PVC via the WAXS spectrum, a strong background of available literature seems necessary.
| Position 2θ [°] | Interplanar spacing d [Å] | Representative plane miler index |
|---|---|---|
| 17.15 | 5.17 | (200) |
| 18.72 | 4.74 | (110) |
| 24.45 | 3.64 | (210) |
| 39.14 | 2.30 | (002) |
| 42.72 | 2.11 | (410) |
It has been reported that apart from the crystalline phase, another distinct phase with an intermediate level of order, called mesomorph, may exist within PVC's microstructure. This phase can rigorously interfere with the PVC's XRD spectrum by rising the relative intensities of the low-angle peaks (typically lower than 2θ = 25°) as well as peak broadening. This phase is made by parallel molecular arrangement like the nematic structure in 5 to 5.4 Å distance between PVC chains, which is stipulated by a broad hump with a maximum of about 2θ = 17.5.[37, 54, 56] Guerrero et al.[57] conducted an XRD examination on a heated PVC to assure that there is no crystallite and obtained a double hump curve with maximums at 2θ = 16 and 23.2 such that the second hump was smaller than the first hump. The mentioned spectrum has a good resemblance to Figure 6 curves obtained for the present study.
The shear stress regimes involved in the FDM process cause molecular orientation along the raster direction.[8, 38, 39] Vyvoda et al.[58] reported that drawing compression molded commercial PVC results in a drastic increase in peak intensity representing 200 planes (2θ ≈ 17), making the intensity of the first two peaks more prominent than the third peak of 2θ ≈ 25. It is interpreted that 2D order related to lower angle peaks can be developed rather than 3D order that is typically associated with 2θ ≈ 25. Therefore, the molecular orientation interference with 3D printed PVC's XRD spectrum shown in Figure 6 may be a correct assumption.
Thanks to the presented background, a stretch-inducedmolecular orientation, that results from a thermomechanical history of the 3D printing process and exaggerates by the high melt elasticity of PVC, may form a mesomorph-like structure and extend through the whole material.[59] It has been reported that the intensity of the peak about 2θ = 25° is higher than that of about 17° by almost 1.3:1 ratio in the original XRD spectrum of PVC's crystallites.[36, 57] Despite the mentioned fact, molecular orientation seems to make this trend the opposite, yielding the peak of about 17° as the most prominent due to the possible formation of the mesomorph phase with an intermediate level of an order.[35, 37, 56]
Furthermore, molecular orientation modifies the unit cell by raising the intensity of the 200 plane peak compared to the 110 and makes their difference the least, as it is recognized for 3D printed PVC regarding the spectrum shown in Figure 6.[37] Therefore, the WAXS spectrum as presented in Figure 6 indicates the probable existence of mesomorphs or orientation-induced 2D ordered nematic-like structure, and molecular orientation-driven unit cell modification, which strongly interferes with PVC crystallites’ XRD spectrum.
For calculating the degree of crystallinity based on the XRD data, an amorphous background, should be determined. The presence of mesomorphs, molecular orientation, and small imperfect crystalline make the XRD spectrum of PVC to be nonunique.[37] Therefore, employing the well-known bimodal spectrum associated with the stable mesomorphs at high temperatures as the amorphous background of PVC seems not to be reasonable. Gouinlock[35] defined a three-phase microstructural model for PVC by determining two distinct backgrounds in PVC's XRD spectrum, first the well-known bimodal and second a typical monomodal, representing the mesomorphs and the genuine amorphous sections without any order, respectively. The genuine amorphous monomodal curve is considered an amorphous background for calculating the portion of the ordered regions which is the collection of the crystalline region and mesomorphs.[35] The typical monomodal amorphous background is demonstrated by the dotted line in Figure 6, and the solid black curve is associated with the ordered region made by subtracting the monomodal amorphous curve from the total curve (orange solid line). The portion of the ordered regions is calculated by dividing the area between the total curve (orange solid line) and monomodal amorphous background (dotted line) to the area beneath the total curve until the straight dashed baseline. The portion of the ordered (crystallites+mesomorphs) regions is obtained as 55.41%, showing a significant portion of ordered regions in the 3D printed PVC, which have more thermodynamical stability and resistance to relaxation and phase change.
3.4 Differential Scanning Calorimetry (DSC) Results
Figure 7 demonstrates heating, cooling, and reheating DSC traces for the 3D printed PVC single layer. Glass transition temperature ranges from 55 °C to 70 °C with the average Tg of 63 °C consistent with DMTA results of Figure 5. The reheating trace shows an endotherm peak at Tg known as DSC overshoot. The same phenomenon has been reported when the PVC sample was quenched with a low cooling rate or subjected to sub-Tg annealing.[60, 61] The observed overshoot seems to be attributed to the lower cooling rate (10 K min−1) of the DSC cooling stage than that of the printing procedure. A lower cooling rate of quenching sample below its Tg can provide enough time for a more efficient free volume relaxation that results in higher desired energy for glass to rubber transition.[38, 62] Also, a relatively high scanning heating rate can result in a more desired energy for this transition by limiting the exposure time for recovering the free volume portion in the rubbery state.[63] The same observation can occur by sub-Tg annealing which is called physical aging by providing enough time and energy for more efficient free volume contraction.[8, 64]
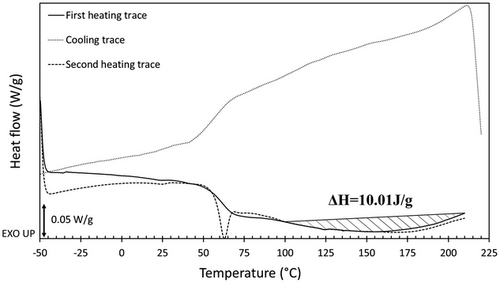
The crystallite melting endotherm peak occurred in a broad range of 100 °C to 210 °C which means there are crystallites with a vast range of order and perfection as a result of microstructural barriers like lack of configurational order that prevents the sample to produce perfect crystallites. As shown in Figure 7, the melting temperature range of the 3D printed PVC in this study does not show double successive melting peaks, which suggests the absence of the unmolten and more perfect thick primary crystallites at higher melting temperatures.[33, 34, 65] All the crystallite seems to be in the same fringed micellar type of secondary crystallites that are formed from wholly melted PVC crystallites during rather rapid cooling.[33, 65, 66] Hinrichsen and Thorsteinsen[67] suggested that higher temperatures and shear rates can be highly influential in the destruction of the primary crystallites during processing. The FDM printing procedure involves high shear stress, and the rate of extrusion procedure and its combination with the employment of the maximum possible non-degradative temperature of 200 ± 5 °C may help with the full destruction of probable primary crystallite and form a monomodal endotherm of secondary crystallites melting peak.
For determining the degree of crystallinity, the enthalpy of fusion of the 3D printed PVC (ΔH = 10.01 J g−1) should be divided by the enthalpy of fusion of a 100% crystalline PVC. According to the literature, there is an argument on the value of ΔHU (the enthalpy of fusion of a 100% crystalline PVC) such that it ranges from minimums of about 43–48 J g−1[34, 55, 66, 68] to maximums of 176–177.12 J g−1.[69, 70] The minimum value of ΔHU is selected as 3000 J mol−1 or 48 J g−1 based on the value proposed by Dawson et al.,[66] and the maximum value is selected as 176 J g−1 which is calculated empirically by extrapolation using Flory's equation.[69] Therefore, the maximum degree of crystallinity is obtained as %Xc max = 20.85 and the minimum calculated value is %Xc min = 5.68. The calculated degree of crystallinity range is in agreement with the available literature for commercial PVC.[65, 66, 68, 70] As a result, by subtracting the obtained range of degree of crystallinity from the portion of the ordered region (crystalline+mesomorph), the portion of mesomorph or region with an intermediate degree of order ranges from 34.56 to 49.73%.
3.5 The Origin of the PVC's Shape Memory Effect
Based on the available literature, small angle X-ray scattering (SAXS), and small angle neutron Scattering (SANS) data, the existence of a poor crystalline network spacing of about 100 nm has been proved.[65] Also, the results of the swelling examination on the commercial PVC in the acetone and plasticizer suggest a 3D molecular network formed of tie molecules between small crystallites with a low degree of order.[33, 65] Rheological studies showed that an unusual melt elasticity was detected while it diminished at the higher temperature, proving that a 3D network existed at lower temperatures that could be eliminated at the higher temperature, suggesting a reversible phenomenon of crystallinity.[34, 42, 67] A higher K value (higher viscosity and molecular weight) or higher degree of polymerization employed in manufacturing commercial PVC leads to a more effective 3D network because the longer molecular chain can better serve as tie molecules.[67] Based on the above-mentioned discussions and the results of WAXS and DSC examinations (Figures 6 and 7), the less ordered small and close fringed micellar crystallites, as well as possible mesomorphs with an intermediate degree of order, can form a network of tie molecules.[33, 34, 68] Thus, the cooperation between efficient molecular entanglements in amorphous regions with high molecular weight[8-10] and a high portion of ordered regions (crystallites and mesomorphs) about 55% causes an efficient 3D network of tie molecules to be created by their role of net points (hard phase) for exhibiting a unique excellent SME of PVC that is used in this study. They claimed that the SME of PVC arises from the physical crosslinks of molecular entanglements and crystalline. Also, Clark and Truss[33] suggested a microdomain for the crystallinity of PVC based on the results of previous works, including wide- and small-angle X-ray scattering and differential scanning calorimetry. Their model consisted of two types of crystallites, a lamellar primary crystal and a micellar crystal (mainly represented by 200 planes), which were connected via a network of tie molecules. This proposed model along with the WAXS and DSC results, especially for the second type micellar crystals, can be easily interpreted as a good SME of 3D printed PVC.
3.6 Shape Memory Effect (SME) Evaluation
Figure 8 illustrates the temporary and recovered shapes of 3D printed PVC beams programmed in a three-point bending way with different deformation temperatures and load holding times. Table 2 summarizes the quantitative data associated with the shape memory performance of bending samples. Based on the observations in Figure 8 and the results of Table 2, it can be recognized that the higher deformation temperature leads to a higher shape fixity ratio. In general, an excellent shape fixity ratio is seen for hot programming protocol. The warm programming has an acceptable range of shape fixity ratio, while the cold programmed sample shows an unpromising range of value. Also, the shape recovery ratios of the cold programmed samples are the best value of 100% regardless to load holding time whereas the warm and hot programmed samples show lower shape recovery ratios as well as sensitivity to load holding time, with an opposite trend to that of shape fixity ratio. However, all the shape recovery ratios are promising and range between 83.2 and 100%, mostly in the range of around 90% or higher. It is worth mentioning that the recovered bending samples shrank in length in the range of 2.00 to 3.45% because of extrusion-induced pre-strain release.[8, 25-27]

| Deformation temperature [°C] | Load holding time [s] | Shape fixity ratio [%] | Shape recovery ratio [%] | Recovery rate [%/s] |
|---|---|---|---|---|
| 85 (hot) | 0 | 93.1 ± 2.3 | 88.5 ± 2.3 | 0.94 ± 0.049 |
| 600 | 100.0 ± 0.0 | 77.2 ± 4.3 | 0.76 ± 0.026 | |
| 55 (warm) | 0 | 76.3 ± 5.7 | 96.6 ± 1.3 | 2.84 ± 0.210 |
| 600 | 90.6 ± 3.5 | 92.7 ± 3.2 | 1.45 ± 0.052 | |
| 25 (cold) | 0 | 35.9 ± 5.4 | 100.0 ± 0.0 | 5.88 ± 0.540 |
| 600 | 56.3 ± 4.2 | 100.0 ± 0.0 | 2.68 ± 0.110 |
The fixation mechanism is completely different in hot and cold programming protocols. In standard hot programming protocol, the material is in the rubbery state above Tg, with a hyperelastic behavior. Above Tg, the majority of polymeric chains can be subjected to the stress-driven conformational change homogeneously thanks to their appropriate possible molecular mobility because of the emergence of free volume in amorphous regions by the glass to rubber transition. As a result, the tensionally conformational changes result in a decrease in entropy level, more or less to a similar extent for each chain in the polymer system. In presence of an efficient enough molecular network of net points, the extended polymer chains that have lower entropy levels tend to recover their pre-extension coil conformation to achieve their preliminary entropy level, leading to behave identically to rubbers by exhibiting entropic force. In this way, the extended conformation of the chains is fixed by rubber to the glass transition. This transition results in a drastic decrease in free volume portions, restricting the molecular mobility, and consequently helps the polymer system with storing the entropy-driven elastic energy. Reheating the fixed deformed sample above its Tg renders the extended chain to gain the desired molecular mobility for recovering their high entropy pre-deformation coiled conformation. The mechanism is too different for the cold programming protocol. A glassy polymer does not possess enough free volume for a homogenous and stable conformational change upon deformation. Therefore, its behavior is completely different from a hyperelastic rubbery material. Deformation of a glassy polymer includes elastic, yielding, possible strain softening, and strain hardening behaviors, showing the involvement of three elastic, viscoelastic, and viscoplastic components.[71] The first difference is that the cold programmed sample relieves the elastic strain upon unloading while the hot programmed does not possess this characteristic. Besides, the distribution of free volume size is ununiform in the cold state, leading to a shortage of suitable sites for drastic conformational changes in cold deformation. The experience of intensified conformational changes in limited regions that possess bigger and stress-induced-enlarged free volume, causes a more pronounced spring back to occur. Also, the lack of molecular mobility in a glassy state causes the deformed conformation to be in immense nonequilibrium in terms of altered bond length and angles. In this regard, the equilibration is not able to evolve through the whole polymer system and makes an excessive increase in internal energy.[72] All the mentioned reasons can lead to an increase in unloading-related spring back as well as the internal energy for cold programming. Contrarily, the applied extension on polymer chains in hot programming conditions can be more efficiently preserved by uniform free volume contraction through the whole system by phase transition, and the conformation equilibration can happen during the loading, load holding, cooling, and unloading stages.[72] Based on the discussion, lower deformation temperature is expected to cause a lower shape fixity ratio as well as higher recovery speed, but its effects can be alleviated in the vicinity of glass transition like warm programming conditions, as shown by the results. Also, the more promising strain fixing procedure of the hot programming may be affected by the interplay of the possible different stress relaxation regimes with intensified kinetic at hot temperature conditions, helping the deformed sample with shape fixity regardless of the deformation percentage. The mentioned phenomenon may drastically weaken stored energy as well as the polymer network in the hot programmed samples.[8, 73, 74]
Figure 9 demonstrates the temporary and recovered shapes of the 3D-printed PVC samples programmed by 60% compression for different deformation temperatures. Figure 10 also shows the effects of load holding time on the shape fixity and recovery of the hot and cold programmed samples by 80% compression. The shape fixity and recovery ratios related to the two figures are summarized in Table 3. Compressive programming follows the same trend and ranges as bending programming, concerning the effect of deformation temperature and load holding time on the shape recovery and shape fixity ratios. All the compressed programmed samples by 60% and 0 load holding time exhibited an excellent shape recovery ratio above 91.7% with a full shape recovery for warm and cold deformation temperatures. Comparing the shape fixity and recovery values of the hot and cold programmed samples with different compression ratios seems to be beneficial for monitoring the effect of applied strain.
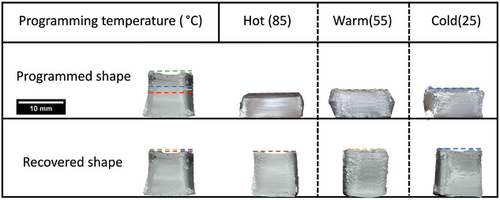

| Compression ratio [%] | Deformation temperature [°C] | Load holding time [s] | Shape fixity ratio [%] | Shape recovery ratio [%] |
|---|---|---|---|---|
| 60 | 85 (hot) | 0 | 92.2 ± 2.4 | 93.7 ± 3.8 |
| 55 (warm) | 75.2 ± 4.1 | 100.0 ± 0.0 | ||
| 25 (cold) | 61.5 ± 5.7 | 100.0 ± 0.0 | ||
| 80 | 85 (hot) | 0 | 87.4 ± 3.0 | 81.1 ± 2.6 |
| 600 | 89.2 ± 1.1 | 71.4 ± 4.6 | ||
| 25 (cold) | 0 | 50.1 ± 5.3 | 93.6 ± 1.4 | |
| 600 | 69.6 ± 5.0 | 89.5 ± 2.2 |
According to Table 2, higher load holding time has a lucrative effect on the shape fixity ratio, and an increase in load holding time improves the shape fixity ratio of the hot, warm, and cold programmed PVC samples by 7.4%, 18.7%, and 57.0%, respectively. Therefore, the warm programming protocol demonstrates an average value with a tendency to hot programming conditions. An increase in load holding time results in an increase in the shape fixity ratio and a decrease in the shape recovery ratio to different extents depending on deformation temperature, suggesting different stress relaxation mechanisms.[75-78] In general, higher load holding time provides enough time for stabilizing deformed conformation by finding a more equilibrium thermodynamical state.[79] For better comprehension, the load-holding effect can be subdivided into two different phenomena, viscoelastic structural relaxation[80] and disentanglement induced-stress relaxation.[73, 74] At temperatures well above Tg, disentanglement induced-stress relaxation is also probable to occur during deformation apart from the load-holding stage, which can alleviate the effect of postdeformation relaxation time on the shape fixity increase and stress decay.[8] These differences between stress relaxation of cold and hot deformed samples result in the impracticality of load holding time for the shape fixity ratio enhancement of hot programmed whereas confined molecular mobility and chain slippage in a glassy state enormously increase the effect of load holding time on the shape fixity ratio of the cold programmed sample by dominancy of viscoelastic structural relaxation mechanism.[8, 53, 80] It can be considered that structural relaxation just leads the polymer system to a more thermodynamically stable state, without a considerable extent of chain slippage phenomenon while disentanglement-induced stress relaxation, which is dominant at temperatures above Tg, deteriorates the shape recovery procedure by annihilating the entropic elastic stress that had been stored in the slipped chain before disentanglement.[8, 80, 81] Based on the above-mentioned discussion, it is seen that the dominancy of structural relaxation in cold programming conditions by increasing load holding time makes a considerable improvement in the shape fixity ratio with a possible decrease in the shape recovery rate by making the whole immense unstable polymer system more stable, without a significant adverse effect on the shape recovery ratio. However, the hot programming condition experiences a negligible increase in the shape fixity ratio and a drastic reduction in the shape recovery ratio due to the possible high contribution of slippage-induced stress relaxation and intensified structural relaxation kinetic during the deformation and load-holding stage.[82, 83] The results associated with the warm programming condition imply that it has an average behavior between hot and cold, with a greater tendency to the hot one. Its shape fixity ratio is improved to some extent, showing the contribution of re-arrangement-induced structural relaxation. The extent of the deformed conformation non-equilibration is lower for warm conditions compared to cold ones but its stability evolution occurs at a faster pace, thanks to boosted molecular mobility. The shape recovery ratio of the warm programmed sample modestly decreases as a result of possible chain slippage by increasing load holding time. Regarding Table 2, hot programmed samples show the least recovery rate below 1%/s as a result of more stable chain deformed conformation as well as possible chain slippage-induced reorientation, deteriorating both recovery ratios and recovery time. Contrarily, a cold programmed sample without any load holding time reveals a superior recovery rate value of 5.88%/s. High load holding time results in a 19.15% and 54.42% reduction in the shape recovery rate for hot and cold programmed samples, respectively. It displays the high impact of the structural relaxation on the cold programmed sample which slackens the recovery procedure without the cost of a reduction in shape recovery ratio, opposite to what happened to the hot programmed sample. The more the chain instability, the more the tendency to recoil and the resultant recovery rate. Warm programmed samples behave as an average of the cold and hot programming conditions which proves the contribution of both microstructural changes mentioned for these two programming conditions with a tendency to the cold programming. In this regard, the higher molecular mobility makes the warm deformed conformation less unstable than the cold one, lessening the adverse effect of the structural relaxation on the recovery rate.
According to Table 3, the higher compression ratio decreases the shape fixity ratio of hot and cold programmed samples by 9.4 and 15.3%, respectively. This trend also applies to the shape recovery and the shape recovery ratios of the hot and cold programmed samples are reduced by 13.4% and 6.4%, respectively,while the shape recovery ratio for cold programming stands also above 90%. The results can demonstrate the excellent shape recovery capability of 3D printed PVC parts in different programming conditions regarding the deformation mode (bending and compression), deformation temperature (hot, warm, cold), load holding time, and deformation ratio. The increasing deformation ratio seems to have a nonlinear effect on the shape fixity ratio, such that in the programming strains close to the yield point, increasing programming ratio can increase the shape fixity ratio by decreasing the contribution of elastic strain in total imposed strain. However, for programming ratios that are high enough to enter the strain-hardening region, increasing the programming ratio makes a higher spring back, bringing about decreasing shape fixity. In this study, the deformation ratios of 60 and 80% are high enough for entering the strain-hardening region and showing a decrease in the shape fixity ratio by increasing the deformation ratio. Increasing deformation ratio results in stretching-induced disentanglement, which can be enhanced by elevating temperature.
4 Conclusions
- The results showed that increasing deformation temperature and load holding time increased the amount of shape fixity ratio, and the highest amount of shape fixity (100%) was obtained in the bending mode for the hot programmed sample that accompanied by load holding time. For the compression mode, this result was obtained for the same protocol at a lower compression ratio (92.21%).
- On the other hand, the highest shape recovery (100%) was obtained at a lower deformation temperature regardless of the loading time in the bending mode. Of course, the load holding time strongly affected the recovery rate and it decreased from 5.88% s−1 to 2.58% s-1 by applying 600 s of load holding time.
- In the compression loading mode, the shape recovery decreased with the increase in compression ratio, and also in this protocol, the destructive effect of the load holding time was observed more.
- A higher deformation temperature results in a higher shape fixity ratio, and an excellent shape fixity ratio was seen for the hot programming protocol. The warm programming had an acceptable range of shape fixity ratio, while the cold programmed sample shows an unpromising range of value.
- Hot programming without any load holding time and warm programming with load holding time can be selected as the best programming protocols for 3D-printed PVC parts.
- The presented manufacturing and experimental results would be expected to contribute to a better understanding of the shape memory performance of PVC and to be instrumental towards an efficient 3D printing of shape memory structures.
- This is a primary study on the shape memory behavior of 3D printed PVC, as a new practical smart thermoplastic for FDM 3D printing technique. Further studies can be carried out to evaluate the functionality of the 3D printed smart PVC-based structures as functional parts like actuators in real working conditions with complex additive manufacturing-enabled designs, and extreme working conditions. It may open a window to introduce another promising FDM 3D printable shape memory thermoplastic with all the unique properties of PVC, like high strength, sound ductility, limited stress-relaxation, and manipulatable microstructural and thermal properties.
Conflict of Interest
The authors declare no conflict of interest.
Open Research
Data Availability Statement
The data that support the findings of this study are available from the corresponding author upon reasonable request.


