Stress distribution in thick-walled cylinder due to non-uniform radial pressure on the example of reinforcement corrosion in concrete
Abstract
This paper presents an analytical solution to the non-uniform pressure on thick-walled cylinder. The formulation is based on the linear elasticity theory (plain strain) and stress function method. As an example, the proposed solution is used to model the stress distribution due to non-uniform steel reinforcement corrosion in concrete. The model is formulated considering different scenarios of corrosion pressure distribution. It is validated against the finite element model for different cases of non-uniform pressure distributions. The results show that the corrosion-induced cracks are likely to start just beyond the anodic zone. This is confirmed by the experimental tests on concrete cylinder exposed to non-uniform accelerated corrosion of steel reinforcement. The model can be effectively used to calculate the distribution of corrosion-induced stresses in concrete.
1 INTRODUCTION
The corrosion of steel in concrete is one of the major factors that influences both the integrity and durability of reinforced concrete structures.[1] It is often known as concrete cancer, to reflect the iconic image of its risk. Corrosion-induced damages usually are cracking and spalling of concrete cover. It causes reduction of resistance and ductility of reinforced concrete (RC) structures and could lead ultimately to structural collapse.[1]
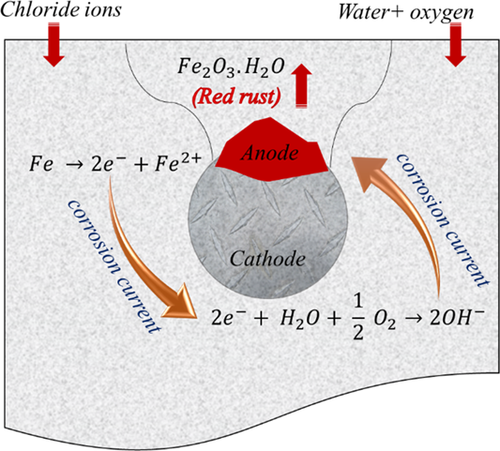
The corrosion starts when an aggressive environment attack (e.g., chlorides in marine environment) breaks the steel protective layer. Once the protective layer is broken (i.e., depassivation occurred) the corrosion may develop. The corrosion process is an electrochemical reaction resulting from an electrolytic cell. Three basic elements are required to create an electrolytic cell: an anode, a cathode and an electrolyte as shown in Figure 1.[2] The corrosion rust usually expands two to seven times the volume of the original steel causing pressure in the surrounding concrete, and consequently leading to corrosion-induced cracks.
In the real environment, the corrosion attack usually occurs from one direction and thus the steel bar starts to corrode from that direction in a non-uniform manner.[3] The non-uniform corrosion was also confirmed experimentally by using microscopic observations [4-6] as well as numerically by using means of advanced three-dimensional chemo-hygro-thermo-mechanical finite element models.[7] The modelling of non-uniform corrosion pressure has been handled using finite element considering the distribution of stress.[3, 8, 9] These finite element models usually gives a good basis to understand the engineering problems although they require modelling skills, computational resources, and high performance machines in comparison with the mathematical closed form solutions. In terms of computational cost, the mathematical models are far superior compared with finite elements models.[10] Currently, there are a few research addressing the mathematical modelling of non-uniform corrosion in concrete. In a recent study, the non-uniform corrosion pressure is considered by modelling the concrete around the bar as an elastic half-plane with a circular aperture for a known cover and edges at infinity.[11] The study utilised the complex variable method of Muskhelishvili with two complex functions for stress and displacement. However, modelling the concrete around steel bar is quite popular to be considered as a problem of a thick-walled cylinder. It should be noted that the calculation of the stresses in thick-walled cylinder under uniform pressure using Lame's equations are very simple, however, in the case of non-uniform pressure these equations are not valid.[12] Therefore, the problem should be tackled in a different way. This was handled efficiently using stress function method in thick-walled cylinders to solve the stress for various loading [12] and for the fatigue analysis of pneumatic press chambers under nonaxisymmetric loads.[10]
In the present paper, the stress function method is used to model the stress distribution due to non-uniform reinforcement corrosion in concrete. The first part of the paper gives the formulation of the model. This is followed by the implementations of the model for two numerical examples for non-uniform corrosion and comparison of the results with the results of finite element. The solution of the model for uniform corrosion pressure around the entire surface of the bar is also compared with the solution of Lame's equations for thick-walled cylinders. Finally, the model prediction is compared with the results of the experimental tests.
2 FORMULATION OF THE MODEL
 for the corrosion pressure. Though symmetrical function is even (i.e.,
  ), it could be represented using Fourier expansion as follows:

 (1)
(1) (2)
(2) is the stress function given in the following equation (3a), which has to a fulfil bi-harmonic equation (3b) assuming no volume forces.[13]
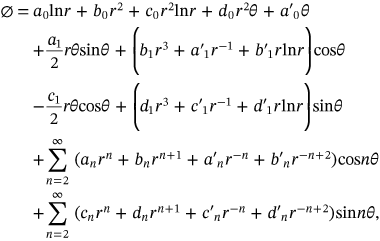 (3a)
(3a) (3b)
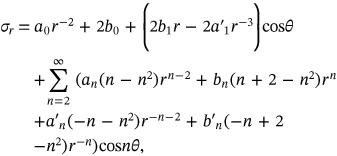
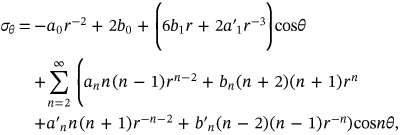
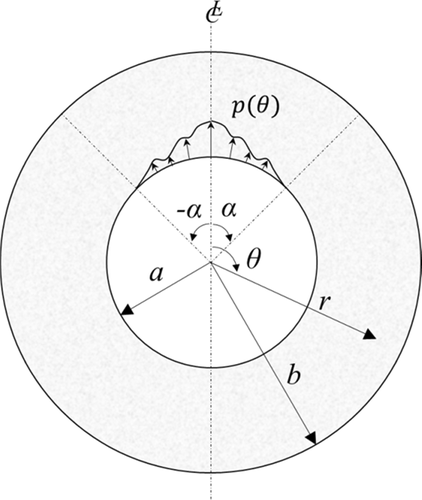
(3b)For the geometry shown in Figure 2, and subject to symmetric load about the vertical axis (even function), all the coefficients of sine terms should be vanished in addition to the  term. Because
  , this also makes
  .[13]
.[13]
 (4)
(4)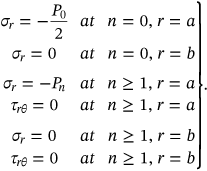 (6)
(6) ,
,
 (7)
(7) ,
,
 (8)
(8)
 (9)
(9)Solution of Equations (7-8), and (9) gives the needed constants to calculate the stress in the thick-walled cylinder (concrete).
3 IMPLEMENTATION OF THE MODEL AND NUMERICAL EXAMPLES
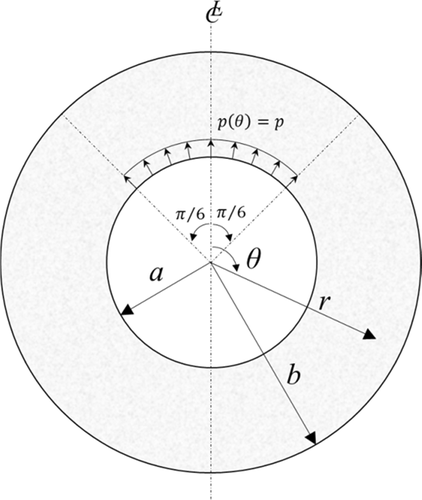
The developed model could be applied for many possible pressure distributions over any angle. For instance, in the next sections numerical examples for uniform and sinusoidal reinforcement corrosion pressure over an angle of  for a model with properties shown in Table 1 is presented. The model is formulated and solved using MATLAB 2015a software. The results are then compared with the results of finite element (FE) model, Figure 3. The FE analysis is performed assuming plain strain boundary conditions with supporting constrains at
  . The noncommercial finite element code MASA, which is developed at the University of Stuttgart, Institute of Construction Materials, IWB,[14] (Ožbolt 1998) is used. The model results are also calculated assuming uniform corrosion pressure around the bar (Figure 4).
| Parameter | Value |
|---|---|
| Young's Modulus of concrete | 25 GPa |
| Poisson's ratio of concrete | 0.18 |
| Concrete cover | 50 mm |
| Steel bar diameter | 16 mm |


4 NUMERICAL EXAMPLES
4.1 Uniform corrosion pressure over an angle
A uniform corrosion pressure of  is assumed to be distributed between an angle of
  and
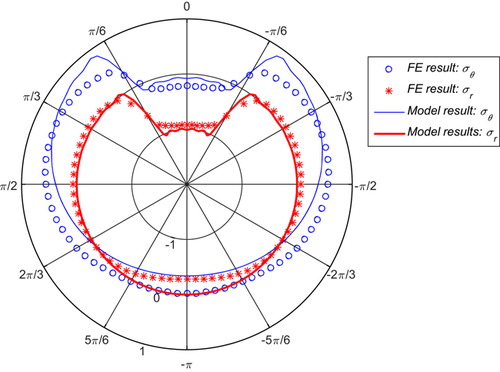
and  , as shown in Figure 2. The comparison of the model results with the FE results (Figure 5) shows that the model is able to predict the corrosion-induced stresses at the inner radius. It is noted that the FE model results do not perfectly agree with the model at the bottom. This could be related to the boundary conditions (constrained) that applied at this location. As expected, the radial pressure perfectly follows the corrosion pressure function. On the contrary, the hoop stresses reach their maximum at the ends of the loading zone and their minimum at the axis of symmetry changing from tension to compression. This result suggests that, in this case, the corrosion induced cracking is likely to start just beyond angle α.
 [Color figure can be viewed at wileyonlinelibrary.com]
4.2 Sinusoidal corrosion pressure over an angle
 and follows a cosine function shown in the following equation (Figure 6) where
  .
.
 (10)
(10)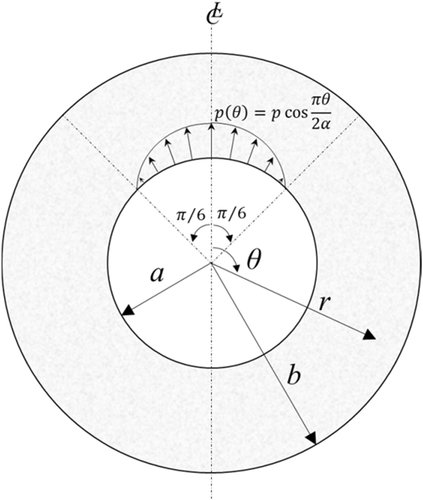

One of the advantages of using Fourier series is that the pressure function could be either a continuous function or discrete values. Because the pressure input of the FE model is applied for every angle increment  (i.e., the angular mesh size of the FE model) as shown in Table 2, the Fourier series of the pressure is also calculated for the same discrete data (Table 2).

 |
 |
 |
 |
 |
 |
|
 |
0.991 | 0.924 | 0.793 | 0.609 | 0.383 | 0.131 |
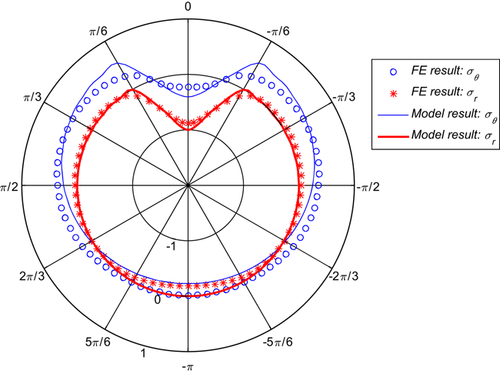
The comparison of the model radial and hoop stresses at the inner radius with FE model results shows good agreement (Figure 7). However, as mentioned earlier, there is some difference in stresses magnitude at the bottom due to the fixed boundary condition in the FE model. The radial stress was found to follow the same pressure function distribution. The maximum hoop stresses (tension) are at the end of the loading zone (i.e., anodic zone), which suggest that the crack will initiate from these points. It can also be seen that the middle zone of the loading area is under compression (Figure 8).
 [Color figure can be viewed at wileyonlinelibrary.com]
4.3 Uniform corrosion pressure around the bar
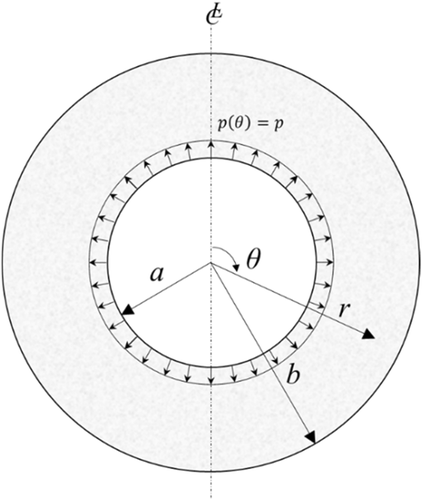
 ) around the bar (
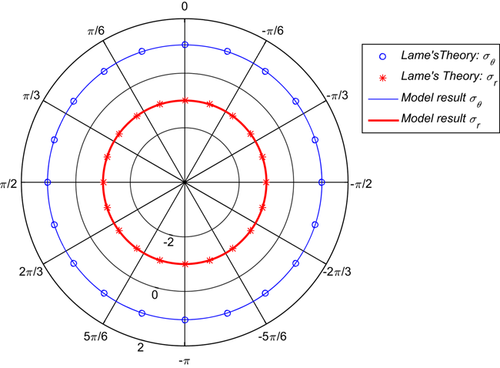
 ), as shown in Figure 7. The results were verified against the closed form solution of the thick-walled cylinder subjected to internal pressure using Lame's theory, Equation (11). The results are identical, as demonstrated in Figure 9, which means the mathematical formulation of the model is correct.

 (11)
(11)
5 EXPERIMENTAL VALIDATION
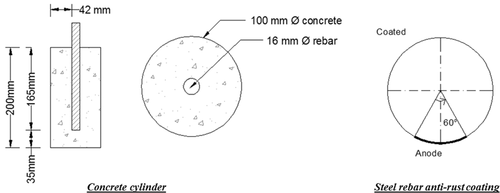
An accelerated corrosion test was conducted on concrete cylinders of 100 mm diameter and 200 mm height with centrally embedded 16-mm diameter rebar. Concrete of Grade 25 was used with 5% of NaCl related to cement content. Antirust coating was applied on the surface area of the embedded rebar over an angle of 300°. This enforcing of the anodic zone over the remaining angle of 60° is shown in Figure 10 (same as the given Example in Section 4, i.e.,  ). To the knowledge of the authors, this technique has not been used before.
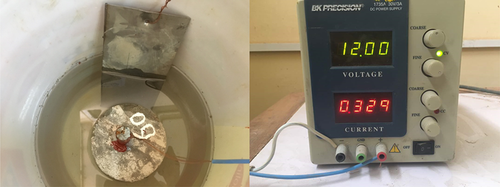
The accelerated corrosion test using impressed voltage technique was used. A potential of 12 V utilising DC power supply was applied. The embedded rebar was connected to the positive terminal (anode) and stainless steel plate was connected to the negative terminal (cathode) of the DC power supply. Both cylinder and stainless steel plate were immersed in 10% NaCl solution. Figure 11 shows the accelerated test setup. More details about this test are available elsewhere.[15]
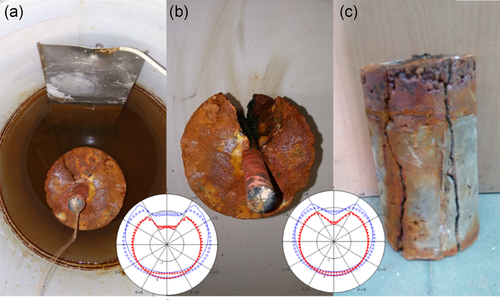
The accelerated corrosion test continued for three weeks until the corrosion-induced cracking took place. Figure 12 shows the cracking pattern in comparison with the model predictions. The pattern is consistent with the predictions of the model shown in previous section ( ). The experimental results show that the model predictions are accurate and could be used to analyse and understand the corrosion-induced damage in concrete. The experimental results also support the model prediction according to which the cracks should initiate just beyond the anodic zone.
6 CONCLUSION
A simplified analytical model for analysis of stresses in thick cylinder loaded by non-uniform pressure is formulated. The formulation is based on the linear elasticity and stress function method. The model is able to consider arbitrary pressure distributions due to reinforcement corrosion. It helps in understanding distribution of corrosion-induced stresses in concrete surrounding steel bar and could be taken forward in the future by calculating the input corrosion pressure from non-mechanical corrosion models. The comparisons of the model results with finite element results and validation against the experimental results show that the model predictions are in a good agreement. Moreover, for the case of uniform corrosion pressure around the bar, the model is verified against the closed form solution using Lame's theory for the thick-walled cylinders. For the investigated non-uniform pressure the results show that the tensile stress are the highest near the anodic area ends, which suggest the cracks are likely to start at these points. Moreover, it is found that the middle of the anodic zone is likely to be under compression. The results are in good agreement with the results of experimental test on concrete cylinder exposed to non-uniform accelerated corrosion of steel reinforcement.
ACKNOWLEDGEMENTS
The authors are grateful to the Third-World Academy of Sciences (TWAS) and the German Research Foundation (DFG) for supporting this study.
CONFLICT OF INTERESTS
The authors declare that there are no conflict of interests.


