Exploring Morphological and Molecular Properties of Different Adipose Cell Models: Monolayer, Spheroids, Gellan Gum-Based Hydrogels, and Explants
Abstract
White adipose tissue (WAT) plays a crucial role in energy homeostasis and secretes numerous adipokines with far-reaching effects. WAT is linked to diseases such as diabetes, cardiovascular disease, and cancer. There is a high demand for suitable in vitro models to study diseases and tissue metabolism. Most of these models are covered by 2D-monolayer cultures. This study aims to evaluate the performance of different WAT models to better derive potential applications. The stability of adipocyte characteristics in spheroids and two 3D gellan gum hydrogels with ex situ lobules and 2D-monolayer culture is analyzed. First, the differentiation to achieve adipocyte-like characteristics is determined. Second, to evaluate the maintenance of differentiated ASC-based models, an adipocyte-based model, and explants over 3 weeks, viability, intracellular lipid content, perilipin A expression, adipokine, and gene expression are analyzed. Several advantages are supported using each of the models. Including, but not limited to, the strong differentiation in 2D-monolayers, the self-assembling within spheroids, the long-term stability of the stem cell-containing hydrogels, and the mature phenotype within adipocyte-containing hydrogels and the lobules. This study highlights the advantages of 3D models due to their more in vivo-like behavior and provides an overview of the different adipose cell models.
1 Introduction
White adipose tissue (WAT) is a highly complex tissue involved in 2 essential processes of an organism: energy homeostasis and energy reproduction.[1] Depending on nutritional status, WAT can store excess dietary energy through triacylglycerides (TAG) or can release TAGs to provide them during energy deprivation.[2] Though this process was long seen as the only function of WAT, its contribution to energy homeostasis throughout an endo- and paracrine manner was first discovered in the 1980s to mid-1990s. Cells of the WAT secrete hundreds of adipokines, influencing food intake and crucial processes of the liver, brain, pancreas, blood pressure regulation, and immune system.[3]
An abnormal state of WAT leads to an altered secretome, and therefore, WAT is involved in the development and manifestation of widespread severe diseases like cardiovascular disorders, type-2 diabetes, adipositas, or cancer.[4] Thus, WAT has become a drug target with therapeutic potential.
As WAT is composed of many different cell types that communicate with other organ systems, its complexity should not be underestimated. It is a specified connective tissue, with multiple cells clustered into lobules surrounded by a network of extracellular matrix fibers.[5] Multiple lobules permeated by small blood vessels build up the entirety of WAT.
Mature adipocytes (ACs), the characteristic cell type of WAT, account for most of the volume and functions of WAT.[6] These cells are characterized by a round morphology with one large lipid-filled vacuole, displacing the cell nucleus and other organelles close to the cell membrane.[7] The adipose-derived stem cells (ASCs) are present within the tissue to maintain the overall cell number throughout adipogenesis.[7, 8] The stem cells differentiate along the adipogenic lineage and start to accumulate lipids. In the early stage of differentiation, there are multiple small vacuoles, which fuse into a single vacuole during maturation, resulting in ACs.[8, 9] Additional multiple cell types, like immune cells and vascular cells, contribute to the tissue's functionality
Different types of models are being investigated, knowing that WAT is a very heterogeneous tissue that can only be mimicked in vitro as a simplified cell model. So far, it is known that a 3D culture has several advantages over a 2D culture, providing greater similarity to the in vivo situation in terms of the mechanical microenvironment with effects on various cell behaviors such as proliferation, differentiation, or morphology.[10] As WAT belongs to one of the softest tissues in the human body with Young's modulus of 0.6–1.6 kPa, the stiffness of the 2D substrate is a critical difference.[11, 12] The mechanical microenvironment affects the cytoskeleton, focal adhesions, and differentiation.[13, 14] It is known that soft materials in general promote adipogenesis of ASCs, and stiffer ones support osteo- or chondrogenesis,[15] but also the opposite has been published.[14, 16, 17] Compared to 2D cultures, a 3D environment more accurately replicates the cellular microenvironment from both biomechanical and biochemical perspectives.[18] It influences behaviors such as survival, differentiation, migration, and proliferation.[19] To mimic WAT, multiple attempts aim to develop 3D models based on self-assembling spheroids, adipogenic differentiated (diffASC)-hydrogels, or AC-hydrogels that can also be implemented in an organ-on-a-chip system. Spheroids show increased adipogenic potential over 2D culture[20-22] and can also be combined with immune cells[23] or designed as a breast cancer model.[24] While only ASCs are used for spheroids, both cell types, ACs or adipogenic differentiated ASCs (diffASCs), are used to create hydrogels. There are several attempts with different hydrogel materials, each with its own advantages. These materials range from collagen or hyaluronic acid (routinely used in tissue engineering)[25] to chitosan,[26] silk,[27] methacrylated gelatin,[28] nano cellulose,[29] alginate,[30] and linear exopolysaccharide gellan gum (GG).[31, 32] The ability to adjust parameters such as elasticity, deformability, and degradability makes the use of hydrogels attractive.[33] Combining a collagen hydrogel with a fluidic system allows for long-term stability[34] and an immunocompetent co-culture of ACs with ASCs, endothelial cells, and immune cells.[35]
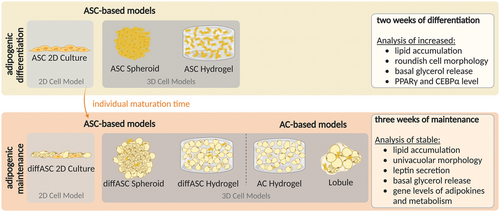
These promising studies have shown that it is preferable to culture adipose tissue analogous in 3D to create in vivo-close models for research purposes. However, the extent to which these in vitro models, which are still simplified, reflect the native state has not been investigated. The purpose of this study is to address this gap through the evaluation of different adipose cell models. Due to the large differences in structure and cell type of the models presented here, a direct comparison seems inappropriate. Therefore, the aim of the present study is to demonstrate the individual strengths and application of the models evaluated. For this purpose, both adipogenic differentiation for 2 weeks and the maintenance of the maximum mature phenotypes for 3 weeks of each model were considered. The models include an ASC culture on tissue culture polystyrene (TCPS), ASC spheroids, ASCs in GG hydrogels, ACs in GG hydrogels, and explanted adipose tissue.
2 Experimental Section
2.1 Materials
Collagenase NB4 (S1745401) and DAPI (4′,6-Diamidin-2-phenylindol, 18 860.01) were purchased from Serva Electrophoresis GmbH, Heidelberg, Germany. DMEM high glucose (L0103), DMEM/Ham's F12 (L0092), ammonium chloride (0621) potassium hydrogen carbonate (0889), and agarose (0710) were obtained from VWR International GmbH, Radnor, PA, USA. Cell culture medium AM-1 (AM-1-PRF) was bought from amsbio, Abington, U.K., and MSCGMx (PB-C-MH-675-0511-XF) by PeloBiotech, Planegg, Germany. Insulin (I9278), pantothenate (21 210), dexamethasone (D4902), IBMX (3-Isobutyl-1-methylxanthin, SIALI5879), Tween-20 (8.22184), Gelzan (GG, G910), oil red-O (O0625), and Triton X-100 (T8787) were purchased from Sigma-Aldrich, St. Louis, MO, USA. Indomethacin (70 270) and BodiPY 493/503 (25892-10) were purchased from Cayman Chemicals, Ann Arbor, USA. Ethylenediaminetetraacetic acid (11 568 896), viability staining kit (10 237 012), ActinRed 555 Ready Probe (5 119 325), TRIzol (15 596 018), and sodium acetate solution (AM9740) were purchased from Fisher Scientific, Schwerte, Germany. Hoechst 33 342 (40 825) was bought from Cell Signaling Technology Europe B.V., Frankfurt, Germany. Biotin (3822.1), Histofix (P087.5), chloroform (3313.4), glycogen (HP51.1), isopropanol (CP41.1), ethanol (5054.1), and nuclease-free water (T143.5) were purchased from Carl Roth GmbH + Co.KG, Karlsruhe, Germany. Bovine serum albumin (0 1400.100) was obtained from Biomol GmbH, Hamburg, Germany, and P/S (P06-07100) and FCS (P30-3306) from PAN-Biotech GmbH, Aidenbach, Germany. PBS with calcium and magnesium (882100-12), cDNA synthesis kit (331 470), and qPCR probe mix (331 455) were obtained from Biozym Scientific GmbH, Hessisch Oldendorf, Germany. Mounting medium (6502B) was bought from Thermo Fisher Scientific, Waltham, USA, and molds (7 x 7 mm; 27147-1) were bought from Ted Pella Inc., Redding, USA. Anti-human leptin Kit (900-K90) was purchased from PeproTech Inc., and the glycerol assay (GY105) was bought from Randox Laboratories, Crumlin, UK. All the cell culture requirements were purchased from Greiner Bio-One GmbH, Frickenhausen, Germany.
2.2 Cell Culture
2.2.1 Ethical Approval
Patients gave their written agreement to donate the samples. All research was carried out according to the declaration of Helsinki, defining rules for the work with human beings, and according to the permission of the Landesärztekammer Baden-Württemberg (F-2012-078).
2.2.2 AC and ASC Isolation
Both isolation procedures are based on previously published protocols.[28, 36] In brief, adipose tissue was separated from the upper skin layers, degenerated tissue parts, and blood vessels. For ASCs and ACs isolation, the remaining adipose tissue was cut into 5 mm3 big pieces, which were digested in a collagenase solution (100 U/mL) under mild agitation. After 1.5 h digestion, the suspension was filtered through a 500 and 200 µm mesh to separate ACs from tissue parts and collagenase. The flow-through and collected tissue parts were incubated for another 1.5 h. ACs were washed twice with the same volume of Dulbeccos's modified eagle medium (DMEM) by carefully inverting the mixture and then incubating for 1 h at 37 °C in DMEM/Ham's F12. Thereafter ACs without other cell types were ready to use. To gain ASCs, the collagenase incubation was stopped by filtering the flow-through through a 500 µm and 200 µm mesh and a centrifugation step for 5 min at 200 g. The supernatant was aspirated, and the cell pellet was incubated for 10 min in an erythrocyte-lysis buffer (155 mM ammonium chloride, 10 mM potassium hydrogen carbonate, 0.1 mM ethylenediaminetetraacetic acid), filtered through a 70 µm sieve, and centrifuged (5 min, 200 g). Finally, the supernatant was discarded and ASCs were counted and resuspended in mesenchymal stem cell growth medium (MSCGMx) with 20000 cells per cm2.
2.2.3 Cell Culture Media
Lobules and AC hydrogels were cultured in a 24-well plate with 750 µL Adipocyte Maintenance Medium-1 (AM-1). Half of the medium was changed twice a week. ASCs were grown in MSCGMx. Monolayer culture, spheroids, and diffASC-GG hydrogels were kept for 3 days in 500 µL, 150 µL, or 1.5 mL MSCGMx. Afterward, an exchange to DMEM supplemented with 10% fetal calf serum (FCS) and 1% penicillin/ streptomycin (P/S) (DMEM-FCS) followed for 24 h. Over the next 2 weeks, half of the media was exchanged 3 times per week with DMEM-Diff (DMEM-FCS + 1 µM dexamethasone, 100 µM indomethacin, 500 µM isobutylmethylxanthine, and 1 µg mL−1 insulin). During maintenance, half of the media was changed twice a week with DMEM-Main (DMEM + 3 % FCS, 8 µM pantothenate, 4 µM biotin, 1 µM dexamethasone, 1 µg mL−1 insulin). It was ensured that the total volume was constant.
2.3 Model Setup
2.3.1 Monolayer Culture Seeding
After seeding of 1.0 × 10⁴ ASCs cm−2 in MSCGMx, 3 days of culture followed. Afterward, the media was exchanged to DMEM-FCS and DMEM-Diff. The maintenance phase followed immediately after the differentiation. Therefore, the 14th day of differentiation was also the start of the evaluation of the maintenance phase.
2.3.2 ASC Spheroids
Spheroid formation occurred in a 96-well (up to 100000) and 48-well (from 150000) plate coated with 50 or 100 µL of 1% agarose. The desired cell number (1.0/ 5.0 × 10⁴, 1.0/ 1.5/ 2.0/ 3.0 × 10⁵) was adjusted in a volume of 150 µL MSCGMx, further, 150 µL medium was added into the 48-well plates. A 3-day static incubation at 37 °C and 5% CO2 for spheroid formation followed. The next day, the media was exchanged to DMEM-FCS, from day 0 until 14 to DMEM-Diff. Starting on day 14, DMEM-Main was given to the spheroids used for this study with 10000 cells. Before maintenance, spheroids were allowed to mature for one more week.
2.3.3 DiffASC-GG Hydrogels
For diffASC-GG hydrogels, as previously published,[32] a 1% GG solution was prepared by boiling and cooling to 37 °C in 90% by-volume double-distilled water. At the same time, the cell count was adjusted to 3.0 × 10⁶ ASCs per 1 mL of phosphate-buffered saline (w/ Ca2+ & Mg2+, PBS+), and this cell suspension was subsequently diluted 1:10 with the GG solution. A 1 mL syringe was used to pour 100 µL into a cylindrical mold to obtain cylindrical gels. Finally, cross-linking of the hydrogels with the appropriate volume of MSCGMx at 37 °C for 30 min and removal of the surrounding mold followed. DiffASC-GG hydrogels were cultured in MSCGMx for 3 additional days before switching to DMEM-FCS (24 h) and then DMEM-Diff. Differentiation was followed by a four-week maturation period before starting maintenance.
2.3.4 AC-GG Hydrogels
AC-GG hydrogels were prepared using a GG solution of varying concentrations (0.5% – 1.0%) with double-distilled water. After the temperature of the GG was adjusted to 37 °C, it was carefully mixed with the AC suspension in a ratio of 1:1 (AC cell count due to variable cell size not determined). 100 µL volumes were slowly poured into the cylindrical mold and subsequently crosslinked with the 750 µL AM-1 for 30 min at 37 °C. Finally, the surrounding mold was removed, and the corresponding analyses were started for the first day of evaluation. To achieve the highest cell integrity, as higher concentrations lead to damaged ACs, 0.5% GG-solution was used in this study.
2.3.5 Lobule Isolation and Culture
The lobules were isolated as previously published.[37] In brief, adipose tissue was separated from the upper skin layers. Individual lobules were then dissected by cutting along the connective tissue around the lobule. Care was taken not to cut or squeeze lobules. Lobules were placed directly into 750 µL AM-1 and analysis started.
2.4 Methods
2.4.1 Image Evaluation of Spheroids
Phase contrast images of the spheroids were analyzed concerning the size of the spheroids using a macro written with ImageJ FIJI 1.53c Java 1.8.0_172 and supported by Read_And_Write_Excel. First, the data were converted into an 8-bit format to set the threshold, whereby spheroids appear black and the background white. Possible irregularities of the spheroid, which could be perceived as white holes, were corrected by the function “fill holes”. Afterward, the pre-set parameters, area, and diameter were calculated and exported as an Excel file and tagged image file. The coordinates of the analyzed object are saved as a .roi (region of interest) file, and the individual values as .csv (comma-separated values) file.
2.4.2 Cryosectioning
After a 30-min fixation in Histofix and washing with PBS+, samples were embedded in a mounting medium within small molds on dry ice. Afterward, samples were cooled to −80 °C and sliced into 10 µm thick sections at a chamber temperature of −35 °C on a cryotome (CM3050S, Leica Biosystems Nussloch GmbH, Germany). For antibody staining, see 2.4.8.
2.4.3 Resazurin Turnover
Cells were treated with a resazurin working solution (0.11 µg mL−1 resazurin) 24 h before the measurement. 100 µL triplicates were pipetted into a 96-well plate and the absorbance was measured at 570 nm with a reference at 600 nm.
2.4.4 Storage and Loss Modulus
To measure the temperature-dependent storage and loss modulus, a rotating oscillating rheometer (Kinexus, Malvern Panalytical, Worcestershire, UK) with a 1° cone plate with a diameter of 60 mm was used. They were oscillated at a constant frequency of 0.1 Hz, a shear stress of 0.1 Pa, and a sampling interval of 2 s. The measurements were performed in a temperature range of 50–10 °C, at a ramp rate of 2.5 °C min−1.
2.4.5 Viability
For live-dead staining, the samples were incubated in a dye solution containing 2 µM calcein, 4 µM ethidium homodimer-1, and 1 µg mL−1 Hoechst 33 342 in PBS+ for 10 min (2D culture) or 30 min (all 3D models), respectively. Microscopy at an AxioObserver with an Axiocam 305 using ZENblue (all Carl Zeiss Microscopy, Oberkochern, Germany) followed directly.
2.4.6 Oil Red-O Staining
The fixed models were washed in PBS+ overnight, followed by incubation with 60 % isopropanol. The incubation time was 5 min for 2D cultures and 30 min for 3D cultures at 50 rpm. The filtered oil red-O solution (0.5 wt.% oil red-O in isopropanol, diluted 4:6 in water) was incubated for 10 and 60 min at 50 rpm, respectively. Unbound oil red-O was removed by washing 2 times with PBS+ at 50 rpm for 3 and 15 min, respectively. Finally, the bound oil red-O was dissolved in 100 % isopropanol for 15 or 60 min at 80 rpm. Triplicates were measured at a wavelength of 520 nm.
2.4.7 Cytoskeleton-Lipid Co Staining
All samples were fixated with Histofix for 15 min (2D culture), 30 min (spheroids), or 3 h (hydrogels and lobule), and stored in PBS+ overnight. The samples were permeabilized with 0.1 % Triton X-100 in PBS+ for 10 min (culture) or 30 min (½ 3D models). Afterward, they were incubated in a staining solution for 45 min, containing 1 µg mL−1 Hoechst 33342, BODIPY 493/503, and one droplet ActinRed 555 ReadyProbe. Finally, all samples were washed twice with PBS+. Microscopy was performed at a Zeiss LSM 880 Indimo.
2.4.8 Antibody Staining
Fixated and permeabilized samples were blocked with 1 % bovine serum albumin in PBS+ for 30 min, followed by incubating the primary antibody (in blocking solution) for 60 min. Samples were washed 3 times with 0.1 % Tween-20 in PBS+ for 2 min (culture) or 15 min (3D models) and incubated with the secondary antibody for 30 min. After another wash, samples were counterstained with 4′,6-Diamidin-2-phenylindol (DAPI, 1 µg mL−1) for 10 min and washed 3 more times. Used antibodies: anti-perilipin A (1:500; P1998; Sigma-Aldrich, St. Louis, MO, USA), anti-rabbit AlexaFluor 488 (1:200, ab150077; Abcam, Cambridge, UK), anti-collagen IV (1:400, ab6588; Abcam, Cambridge, UK) anti-cCas3 (1:400, 9661; Cell Signaling Technology Europe B.V., Frankfurt, Germany), anti-RIPK3 (1:200, LS-C354158; LifeSpan BioSciences Inc.).
2.4.9 Basal Glycerol Release
Glycerol was determined from 24 h conditioned cell culture supernatants by a kit according to the manufacturer's instructions. Supernatants from spheroids and diffASC-GG hydrogels were used undiluted, and supernatants from monolayer cultures, AC-GG hydrogels, and lobules were mixed 1:1 with buffer. The same amount of reagent was added. A standard series of 0–100 ng mL−1 was included. Absorbance was measured at 520 nm after 10 min of incubation.
2.4.10 Leptin ELISA
Secreted leptin was determined in 24 h cell culture supernatant by ELISA. Initial coating with capture antibody (1.0 µg mL−1) was performed overnight at 4 °C. The plate was then washed 4 times with wash buffer (0.05% Tween-20 in PBS). After blocking for 30 min, a washing step was performed. Undiluted samples (diffASC-GG, AC-GG hydrogels) and samples diluted 1:1 with diluent (0.3% bovine serum albumin and 0.1% Tween-20 in PBS) (monolayer culture, spheroids, lobules) and leptin standard (2000 – 0 pg mL−1) were added for 2 h. After another wash, the detection antibody (0.25 µg mL−1) was incubated for 2 h and washed again. Avidin-horseradish peroxidase was incubated for 30 min, washed, and tetramethylbenzidine was added for 10 min. The reaction was then stopped with 1 M hydrochloric acid and the absorbance was measured at 450 and 620 nm.
2.4.11 RNA Isolation
The RNA isolation was performed according to Table 1 using modified phenol-chloroform extractions. For quantification, the isolated RNA was photometrically measured at 230, 260, and 280 nm in duplicate determinations. The ratios 230:260 and 260:280 were calculated. Additionally, a 230–400 nm spectrum was recorded.
| Culture | Spheroid | diffASC hydrogel | AC hydrogel | Lobule | |
|---|---|---|---|---|---|
| Amount | 24-well plate | 96-well plate | 3 gels | 6 gels | 3 lobules |
| FastPrep | – | – | 6 for 30 s | 6 for 30 s | 6 for 30 s |
| TriZol | 1 mL | 1 mL | 1 mL | 1 mL | 1 mL |
| FastPrep | – | – | for 60 s | for 60 s | for 60 s |
| Lysis | 10 min | 60 min | 10 min | 10 min | 10 min |
| Thawing on ice | Centrifugation at 4 °C, 10 min, 12000 g | ||||
| Phase separation | Addition of 1/5 chloroform, inverted vigorously, 3 min incubation, centrifugation at 4 °C, 15 min, 12000 g, discarding phenol-phase | ||||
| Phase separation | Clear supernatant supplemented with a 5:1 mixture TRIzol: chloroform, inverted vigorously, 3 min incubation, centrifugation at 4 °C, 15 min, 12000 g | ||||
| Precipitation | Adding glycogen and isopropanol (1/2 volume) to the clear supernatant, inverted vigorously, incubated for 10 min, centrifugation at 4 °C, 10 min, 12000 g | ||||
| Washing (2×) | Adding 75 % ethanol, centrifugation at 4 °C, 15 min, 7500 g | ||||
| Dissolving | Adding sodium acetate-water (1:10) and ethanol (2.5 volume), incubation at -80 °C for 30 min, centrifugation at 4 °C, 15 min, 12000 g | ||||
| Washing | Adding 75 % ethanol, centrifugation at 4 °C, 15 min, 7500 g | ||||
| Dissolving | Drying the pellet on air and dissolving it in water | ||||
2.4.12 cDNA Synthesis
cDNA was synthesized according to the manufacturer's instructions. Briefly, 500 ng of RNA was taken from each sample and diluted with water to a volume of 12 µL. All other reagents were mixed in the following volume ratios: dNTP mix (2 x), RNase inhibitor (0.5 x), oligo dT (0.5 x), cDNA synthesis buffer (4 x), and reverse transcriptase or water for control (1 x). The diluted samples and synthesis reagents were mixed in a 3:2 ratio and heated at 50 °C for 30 min, followed by enzyme inactivation at 99 °C for 5 min. The cDNA was stored at −80 °C until it was used.
2.4.13 Quantitative Real-Time Polymerase Chain Reaction
The protocol was based on the manufacturer's instructions. First, all samples and primers (sequences available as Table S1, Supporting Information) were diluted with water at a ratio of 1:10 and 1:12, respectively. No reverse transcriptase and no template controls were included. For each gene of interest (GoI), an individual master mix was prepared using qPCR probe mix (w/ 50 µM ROX) containing forward/reverse primers at 400 nM concentration each and probes at 200 nM concentration each (reference gene beta-2 microglobulin). Sampling was performed on a Line Gene 9000 (Biozym Scientific GmbH, Hessisch Oldendorf, Germany). Initial denaturation and activation of the enzyme were performed at 90 °C for 2 min, followed by 40 cycles of denaturation at 95 °C for 5 s and annealing at 60 °C for 30 s each. The data obtained were normalized using the delta-delta Ct method.
2.4.14 Statistics
If not stated otherwise, data were obtained from 5 independent biological donors and a minimum of 3 technical replicates. All data were analyzed with GraphPad Prism 10.2.1 and are depicted as mean values ± standard deviation. All data were analyzed for normal distribution (Kolmogorov-Smirnov method). Significances were determined by a mixed-effect analysis, followed by a posthoc test, according to Tukey. Starting with a p-value of ≤0.05, values were considered statistically significant and indicated by a star throughout the manuscript.
3 Result
This study aimed to evaluate the in vivo similarity and usability of different human WAT models over time. ASC-based spheroids and AC-GG hydrogels were established and evaluated before analyzing the different WAT models. It was found that spheroids with 10000 ASCs exhibited the best suitability for adipogenic differentiation by evaluating spheroid volume and roundness, markers for apoptosis and necroptosis as well as intracellular lipid content, perilipin A, and collagen IV (data shown in Supplement S1, Supplement S2, Supporting Information). For AC-GG hydrogels it was demonstrated that a GG-solution with a concentration of 0.5%–resulting in 0.25% within the final hydrogel–allowed the setup of stable and soft hydrogels (see Supplement S3, Supporting Information). Based on these findings, the spheroids used herein have 10000 cells and the AC-GG hydrogels were prepared with a 0.5% GG solution. Figure 1 provides an overview of the whole study design.
3.1 Adipogenic Differentiation of ASC-Based Models
First, the differentiation of ASC-based cultures (monolayer culture, spheroids, and diffASC-GG hydrogels) was examined. In this part of the study, the capacity of the ASCs to differentiate along the adipogenic lineage was focused. To provide an overview of the cells during adipogenic differentiation in the ASC-based models, microscopic images of the intracellular lipids and cytoskeleton staining as well as the anti-perilipin A staining are shown at lower magnification in Supplement S4 (Supporting Information). The increase in the amount of intracellular lipids is visualized here. The following figures show the morphology of the respective cells in a more detailed way.
3.1.1 ASCs in 2D Culture Successfully Differentiated Along the Adipogenic Lineage
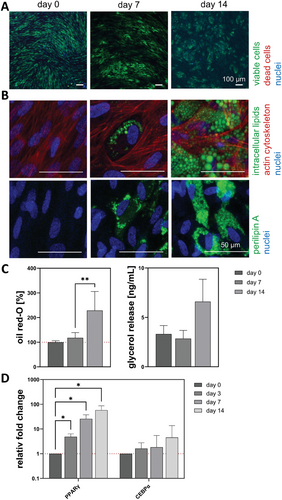
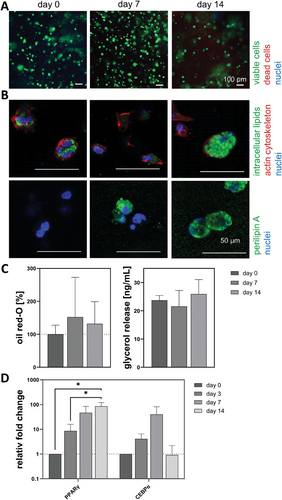
The viability (Figure 2A) was high, no dead cell can be visualized during differentiation. On day 0, no lipids were present, as shown by the staining of intracellular lipids (green) with the cytoskeleton (red) and with the anti-perilipin A (green) staining in Figure 2B. After induction of adipogenic differentiation, ASCs accumulated intracellular lipids that are visible on days 7 and 14. All visibly differentiated ASCs exhibited a multivacuolar morphology with small lipid-filled vacuoles and a spindle-shaped cytoskeleton around the nuclei. In line with this were the increasing values of the quantitative data (day 0 100 %, day 7 and 14 in brackets) of oil red-O (100% ± 6.0%, 117.7% ± 21.2%, and 228.5% ± 77.1%) and the basal glycerol release in ng/mL (3.3 ± 0.9, 2.9 ± 0.8 and 6.6 ± 2.3 ng mL−1) (Figure 2C). The gene expression of PPARγ (peroxisome proliferator-activated receptorγ) and CEBPα (CCAAT/enhancer-binding protein α) (key drivers of adipogenesis) relative to day 0 (visualized by a red dotted line) is depicted in Figure 2D. PPARγ increased significantly from day 0 through 3 and 7 to day 14 up to 57.8-fold, for CEBPα, similar development was visible as there was an increase up to 4.5-fold.
3.1.2 ASC Spheroids Increased Intracellular Lipid Accumulation During Differentiation
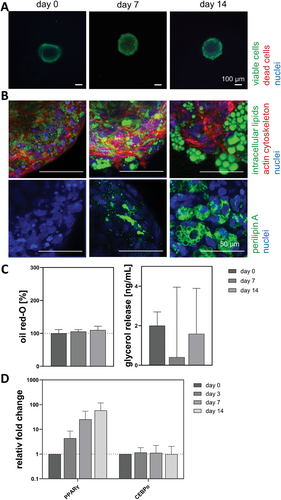
The viability of the cells is maintained at a high level throughout the entire culture, as the visible cells were stained green by calcein (Figure 3A). On day 0 (72 h after setup), small lipid droplets appeared in the spheroids visualized by lipid staining (green) in combination with the cytoskeleton (red) and nuclei (blue) (Figure 3B). While these initially small vacuoles increased their volume during differentiation, and the ASCs started to express perilipin A around the lipid vacuole, the cytoskeleton preserved its network-like structure. The multivacuolar morphology was still present on day 14. The quantitative analysis of oil red-O (100% ± 11.5%, 105.6% ± 13.3% and 110.2% ± 25.0%) and the basal glycerol release (2.0 ± 0.7, 0.4 ± 3.5 and 1.6 ± 2.3 ng mL−1) supported the assumption of increasing lipid content (Figure 3C). The gene expression of PPARγ increased up to 57.9-fold, but the CEBPα slightly decreased to 0.9-fold (Figure 3D).
3.1.3 ASC Encapsulated in GG Hydrogels Start to Accumulate Lipids Without Media Stimulation
With respect to viability (Figure 4A), no decrease was seen during the differentiation period. The ASCs started to accumulate intracellular lipids on day 0 (3 days after setup) without media stimulation, as small, green-stained lipids were detected next to the cytoskeleton (red) and the nuclei (blue) (Figure 4B). While the cytoskeleton surrounded the cells during the whole time of differentiation, the intracellular lipids increased. After 14 days, multivacuolar ASCs with a perilipin A (green) barrier were visible. Figure 4C shows the quantitative analysis of the oil red-O content (100% ± 27.6%, 152.16% ± 121.0% and 132.0% ± 66.9%) and the basal glycerol release (23.7 ± 1.7, 21.6 ± 5.6 and 25.9 ± 5.1 ng mL−1). The content of intracellular lipids increased while the glycerol release slightly fluctuated. The gene expression of PPARγ and CEBPα relative to day 0 (visualized by a red dotted line) is shown in Figure 4D. Both markers increased over time to 85.0-fold and 39.8-fold (day 7) or 0.9-fold (day 14), respectively.
3.2 Adipogenic Characteristics During Maintenance Phase
In the subsequent second part, the differentiated and individually matured ASC-based models as well as the AC-based models underwent a three-week maintenance analysis. The focus was on maintaining a stable adipocyte state including adipocyte-specific lipid accumulation, protein, and gene expression. A lower magnification, and therefore an overview, is shown in Supplement S5 and Supplement S6 (Supporting Information) demonstrating the preservation of intracellular lipids and the barrier by perilipin A. The figures within the results section visualize the cell morphology in more detail.
3.2.1 ASCs in the 2D Culture Increased Their Accumulated Lipids During Maintenance but Remained Multivacuolar and Elongated
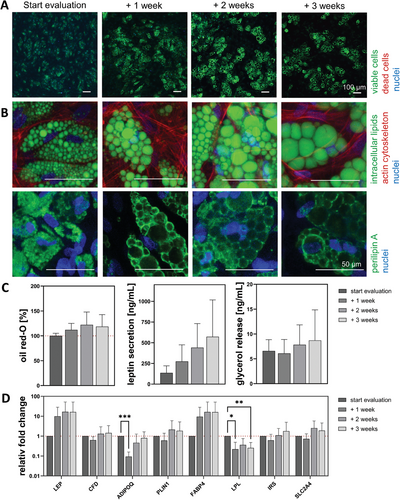
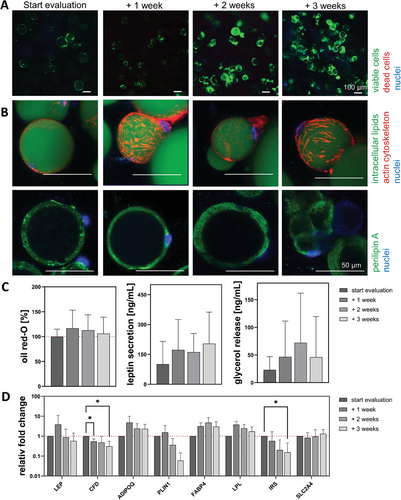
The cell viability, visualized by live-dead staining (Figure 5A), was high during the whole culture time, as all visible cells were stained green by calcein. When the individual lipid vacuoles and cytoskeleton are examined in more detail (Figure 5B), ASCs in the 2D culture exhibited small vacuoles (green) with actin stress fibers (red) at all time points. Due to the ever-increasing amount of intracellular lipids, the cytoskeleton also became less in proportion. However, multivacuolar cells with a centrally located nucleus (blue) were seen even after 3 weeks of maintenance. In line with the lipid accumulation, the volume of vacuoles and thus the size of the perilipin A ring (green) seemed to increase in each cell. The individual lipid vacuoles were arranged in a kind of strand within the cell and demonstrated the still elongated morphology. The quantitative analysis of secreted leptin, accumulated oil red-O, and basal glycerol release (Figure 5C) were normalized to the start of evaluation and increased over time or shown as absolute values in ng/mL. While there was a strong increase for the secreted leptin from start evaluation to + 3 weeks (135.3 ± 85.7, 274.3 ± 200.3, 441.4 ± 290.5, and 572.7 ± 443.6 ng mL−1), the amount of accumulated lipids was less pronounced (100% ± 5.2%, 112.1% ± 12.9 %, 122.2% ± 25.7 %, and 118.6% ± 23.9 %). The release of basal glycerol had minor fluctuations over time (6.6 ± 2.3, 6.1 ± 2.8, 7.8 ± 4.0, and 8.7 ± 6.1 ng mL−1). For the gene expression (Figure 5D), only a few genes showed a non-significant increase during the maintenance phase. These included the adipokines leptin (LEP) 16.2-fold and adipsin (CFD) 1.4-fold, the functionality marker perilipin A (PLIN1) 1.9-fold, fatty acid-binding protein 4 (FABP4) 16.0-fold, the insulin receptor-substrate-1 (IRS) 1.8-fold, and the glucose transporter-4 (SLC2A4)1.9-fold. The other genes showed a significant decrease at various time points. The adipokine adiponectin (ADIPOQ) decreased at + 1 week to 0.1-fold and increased afterward to 0.8-fold. Lipoprotein lipase (LPL) was significantly decreased on + 1 week (0.2-fold) and on + 3 weeks (0.3-fold).
3.2.2 ASC Spheroids Maintained Their Lipid Content, While Vacuoles Fused to form Larger Ones Within Numerous ASCs
Within the live-dead staining (Figure 6A), nearly all cells were stained in green, indicating viable cells at all times. Only very few dead cells (red due to ethidium homodimer) were identifiable. The staining of the intracellular lipids (green), in combination with the cytoskeleton (red) (Figure 6B), revealed that at the evaluation start, the ASCs exhibited a multi-vacuolar morphology, which partly remained until the end. Nevertheless, some cells showed an univacuolar morphology with a shifted cell nucleus. Within the spheroids, the cytoskeleton was predominantly at the outer spheroid parts and appeared as a dense network. The presence of multivacuolar cell morphologies and some univacuolar cells with more prominent vacuoles was supported by the staining of the vacuole membrane protection protein perilipin A (green).
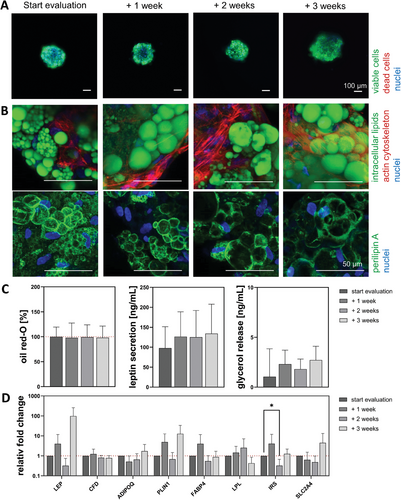
By analyzing the normalized (to start off the evaluation set as 100 %) or absolute amount of secreted leptin, accumulated oil red-O, and basal glycerol release (Figure 6C), slight changes over time were detected. For the secreted leptin (97.8 ± 53.5, 126.3 ± 62.4, 125.7 ± 67.2, and 134.2 ± 73.7 ng mL−1) and for accumulated lipids (100% ± 19.5 %, 97.9% ± 29.5 %, 99.2% ± 19.8 %, and 98.1% ± 21.9 %). The release of basal glycerol was relatively constant (1.1 ± 2.8, 2.3 ± 1.4, 1.8 ± 1.0, and 2.7 ± 1.4 ng mL−1). The gene expression (Figure 6D) revealed no significant increase for any adipocyte-specific gene. Fold changes at + 3 weeks were enhanced for LEP (97.9-fold), ADIPOQ (1.7-fold), PLIN1 (12.8-fold), IRS (1.3-fold), and SLC2A4 (4.5-fold). For the genes CFD (0.8-fold), FABP4 (0.9-fold), and LPL (0.4-fold) no significant decreases were detected. For IRS, a significant decrease to 0.3-fold was detected on + 2 weeks.
3.2.3 Encapsulated diffASC Exhibited Univacuolar Morphologies During Maintenance and Maintained their Adipocyte Characteristics
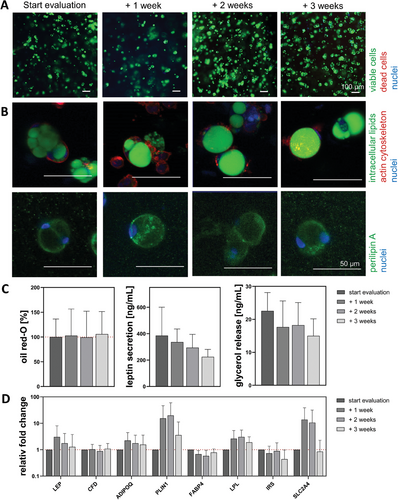
The live-dead staining (Figure 7A) indicated consistently high cell viability over time. As visualized by the green staining of the intracellular lipids and perilipin A (Figure 7B), diffASCs appeared roundish and univacuolar from the start of evaluation + 1 week. The stained cytoskeleton (red) had a roundish morphology, too, and was located around the lipid vacuole and the laterally displaced cell nuclei (blue). Within the quantitative analysis of secreted leptin, accumulated oil red-O and basal glycerol release (Figure 7C) were only non-significant fluctuations. The secreted leptin decreased over time (385.2 ± 215.2, 335.8 ± 99.8, 294.1 ± 101.1, and 224.6 ± 56.4 ng mL−1), while the amount of accumulated lipids was relatively constant (100% ± 36.3 %, 102.6% ± 51.5 %, 99.3% ± 52.7 %, and 105.8% ± 18.6 %) and the release of basal glycerol slightly decreased (22.6 ± 5.6, 17.7 ± 7.9, 18.3 ± 6.8, and 15.0 ± 5.2 ng/mL). The adipocyte-specific genes showed non-significant upregulations on + 3 weeks for LEP (1.3-fold), CFD (1.1-fold), ADIPOQ (1.6-fold), PLIN1 (3.5-fold), and LPL (1.9-fold). For FABP4 (0.8-fold), IRS (0.4-fold), and SLC2A4 (0.8-fold) slightly decreased values were measured on + 3 weeks (Figure 7D).
3.2.4 AC Hydrogels Preserved Their Univacuolar Morphology but Showed First Signs of Dedifferentiation
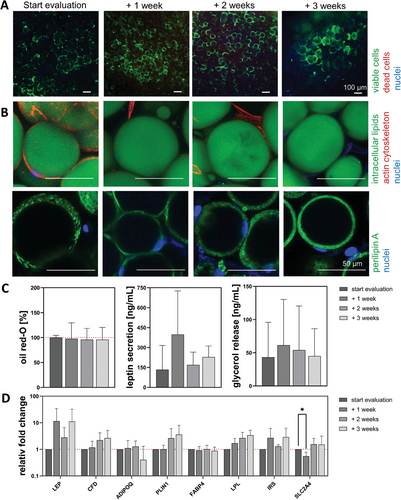
The cytoplasm of all visible cells was stained green by calcein, indicating viable cells (Figure 8A). The univacuolar morphology became apparent through the intracellular lipid, cytoskeleton, and perilipin A staining (Figure 8B). The big and round lipid vacuole (green) was surrounded by a network-like cytoskeleton (red) that was spun across the whole cell, which was small in relation to the intracellular lipid content. A continuous perilipin A expression was visible at all times during the analysis, showing the integrity of the ACs. For all 3 quantitative analyses, the same non-significant trend was observed. An increase until start evaluation + 1 or 2 weeks with a decrease until start evaluation + 3 weeks (Figure 8C). Which was for secreted leptin (100.1 ± 114.5, 172.3 ± 152.8, 161.8 ± 94.2, and 203.8 ± 158.4 ng mL−1), the amount of intracellular lipids (100% ± 14.9 %, 112.8% ± 11.0 %, 116.9% ± 19.0 %, and 105.9% ± 19.3 %) and the released basal glycerol (23.0 ± 24.1, 46.6 ± 64.8, 72.1 ± 89.8, and 46.1 ± 73.3 ng mL−1). Decreased values were detected for LEP (0.6-fold) and PLIN1 (0.1-fold), while significantly decreased values were measured for CFD (0.2-fold) and IRS (0.2-fold). However, most genes showed a decreasing trend over time. (Figure 8D).
3.2.5 Cultured Explanted Lobule Showed Stable Adipocyte Characteristics During Maintenance
At all time points of analysis, a few dead cells (red) were visible, but the majority of the cells were viable (green) (Figure 9A). The visualized intracellular lipids (green) in combination with the cytoskeleton (red) (Figure 9B) demonstrated that the ACs within the lobule had an univacuolar morphology with a weakly developed actin cytoskeleton around the vacuole. While most cells were round, some cells appeared elliptical. The perilipin A on the vacuole membrane was visible at all time points. All quantitative data were normalized to the start of the evaluation and showed non-significant changes (Figure 9C). The quantitative leptin secretion strongly increased until the start evaluation + 1 week and then decreased (133.1 ± 182.8, 389.3 ± 327.3, 169.3 ± 96.8, and 228.1 ± 82.9 ng mL−1), while the amount of intracellular lipids was relatively constant (100% ± 4.3 %, 97.7% ± 18.2 %, 96.0% ± 17.1 %, and 95.9% ± 16.4 %). For the released basal glycerol, a slight increase with a decreasing tendency could be detected (43.3 ± 52.6, 61.5 ± 68.8, 54.1 ± 66.4, and 45.0 ± 41.3 ng mL−1). Regarding the gene expression (Figure 9D), nonsignificant upregulations were found for the genes LEP (11.2-fold), CFD (2.6-fold), FABPS (3.6-fold), LPL (3.4-fold), IRS 2.9-fold), and SLC2A4 (1.5-fold). (2.3-fold), FABP4 (3.0-fold), LPL (1.7-fold), and SLC2A4 (1.3-fold). For the latest, there was a significant decrease at + 1 week with a 0.6-fold. Non-significant decreases were found for FABP4 (0.9-fold) and ADIPOQ (0.4-fold).
4 Discussion
For a more precise imitation of adipose tissue in vitro, there is an urgent need for in vivo-like 3D adipose cell models. Given their pivotal role in metabolic processes and the onset of diseases like diabetes, the significance of these 3D models for research is crucial.[38] Consequently, the adoption of 3D cultures has gained prominence to more accurately replicate in vivo cellular dynamics. This study analyzed adipogenic differentiation and maintenance of explanted WAT lobules, 3 different 3D adipose cell models (spheroids, diffASC-GG hydrogels, AC-GG hydrogels), and an ASC monolayer culture on TCPS. Following successful adipogenic differentiation and a maturation phase for ASC-based models, adipocyte characteristics during maintenance over 3 weeks were analyzed.
After establishing a functional spheroid model, it was first analyzed together with our previously established diffASC hydrogel[32] and the ASC monolayer culture, focusing on adipogenesis. Finally, those differentiated and matured models were evaluated as well as an AC-GG hydrogel and previously characterized explanted lobules[37] as control. Overall viability was analyzed as a fundamental requirement. As expected, viability was high in all models during both adipogenesis and adipogenic maintenance. Only a few isolated dead cells were observed. It can be concluded that the established models are stable within the evaluated time frame as the cells in all model types did not further lose viability over time.
4.1 ASCs Remain Elongated and Multivacuolar on TCPS
For many years, ASCs (of various origins) have been cultured on TCPS and differentiated adipogenically. A large number of studies addressing fundamental questions of lipid metabolism have been performed using this type of WAT model. Results comparable to sstate-of-the-art were obtained in the present study: During adipogenic differentiation, cells started to accumulate intracellular lipids, the cytoskeleton reorganized, perilipin A expression was found, and the quantitative amount of oil red-O increased. As expected, both key driver genes, PPARγ,[39] for adipogenesis were upregulated, with a significant upregulation of PPARγ and a non-significant upregulation of CEBPα. After differentiation for 2 weeks, diffASCs remained multivacuolar with an elongated morphology. As perilipin A is localized as a protective layer protein on the membrane of the lipid vacuole,[40] the cells can be identified as multivacuolar. At this point, most studies end the targeted analyses.
ASCs were maintained after differentiation, and the markers were analyzed again in the present study. Even though the accumulated lipids have increased and the cytoskeleton has become more cortical, univacuolar cells have not been achieved, reflecting a pre-mature cell state.[41] During adipogenesis, ASCs gradually round off and thus exhibit altered cell-cell and cell-matrix contacts.[42] It is possible that highly differentiated cells cannot be held by the developing cortical cytoskeleton. Therefore, they float away and are not present for further analysis. In addition to immunofluorescence, analysis of adipocyte-specific genes has been performed. Among these are 3 important adipokines: leptin (LEP), adipsin (CFD), and adiponectin (ADIPOQ). In general, LEP secretion is proportional to the amount of stored lipids,[43] and the expression of CFD is characteristic of adipocytes[9] and is associated with lipid accumulation.[44] Therefore, a stable or evaluated level is advantageous. Since ADIPOQ improves insulin sensitivity while inhibiting lipogenesis,[45] a stagnant or decreasing level is also beneficial. The other genes analyzed include genes reflecting metabolism and adipogenic markers. While PLIN1 (Perilipin A) is expressed in mature adipocytes as well as during differentiation, it can be assumed that increased or stable levels are positive. FABP4 is known to act as an intracellular lipid chaperone[46] and is upregulated during adipogenesis. Further, LPL (lipoprotein lipase) plays a key role in lipid metabolism by catalyzing the hydrolysis of TAGs from lipoproteins.[47] The decreased presence of LPL leads to an accumulation of lipoproteins in plasma,[48] whereas an increase is associated with TAG accumulation.[49] Therefore, adipogenesis is not yet complete when levels of these genes are elevated. Upregulation of IRS1, which plays a central role in insulin stimulation in adipose tissue,[50] suggests increased glucose metabolism. For SCL2A4—better known as GLUT4 transporter—an upregulation confirms increased translocalization of glucose into the cell.[51]
It can be assumed that the cells are maximally mature for this type of culture since no significant changes were observed in most of the genes analyzed during the maintenance of the monolayer culture. Exceptions are the significantly decreasing LPL from start evaluation to + 1 week and + 3 weeks and the significantly decreasing ADIPOQ from start evaluation to + 1 week. However, since none of the trends are constant over time, they are less meaningful.
To summarize, the monolayer culture shows the strongest indication of morphologically ongoing differentiation and thus represents a pre-mature cell state. Furthermore, the instability of cell adhesion limits the duration of the culture. Therefore, we see suitability for short-term experiments and high-throughput screening where mature phenotype is less important.
4.2 ASC Spheroids Benefit from High Cell Density but Have Weaknesses Regarding Univacuolar Cell Morphology and Stability
ASC spheroids are known to have higher adipogenic potential than monolayer cultures.[20-22] The results presented here also demonstrate this phenomenon. ASCs begin to differentiate and accumulate intracellular lipids prior to differentiating medium stimulation. This fact also explains why the increases during differentiation for oil red-O, glycerol, PPARγ, and CEBPα are not significant. The reason for this might be the normalization to day 0. The differentiation had already started, and therefore, the genes had an elevated level. Why there is no increase in CEBPα despite the positive feedback loop with PPARγ stimulating differentiation[52] is unclear. However, as expected, at the end of the two-week differentiation period, the ASCs show a multivacuolar morphology.
This morphology becomes univacuolar in some cells during maintenance, indicating the characteristic adipocyte phenotype. The network-like cytoskeleton runs through the spheroid, but increasing instability was observed as differentiation progressed. Increasing lipid contents could cause the spheroids to fall apart partially as human fat has a density of 0.9–0.97 g cm−3 [53] and is, therefore, buoyant compared to water. With one exception (IRS decreases significantly from start evaluation to + 2 weeks), there are no significant changes in gene expression in the spheroids. Stable expressions are, therefore, an indication of stable cell metabolism and cells that are no longer actively differentiating.
In summary, the spheroids presented here have a high differentiation capacity. The individual cells are roundish, and some are univacuolar toward the end of the analysis. However, since the spheroids partially disintegrate after ≈30 days, the culture has weaknesses with respect to longer culture periods. In our opinion, this makes adipogenic differentiated spheroids a potential candidate for studies requiring high initial cell density and self-organization potential.
4.3 diffASC-GG Hydrogels Mimic Native WAT with High Similarity in Morphology and Gene Expression
Culturing in the third dimension gained more and more importance.[10] Therefore, multiple studies evaluated various hydrogel materials for in vitro WAT. As we previously demonstrated, GG is a promising exopolysaccharide for setting up long-term stable WAT models. As in the case of spheroids, the diffASC-GG hydrogels showed induction of lipid accumulation prior to differentiation media stimulation. This could be attributed to the round cell morphology and cytoskeleton.[17] Upon differentiation, the cells exhibited a multivacuolar morphology, but during maturation, these mostly fused into one large vacuole.
DiffASCs exhibited a round and univacuolar morphology with a cortical cytoskeleton during maintenance. All reflecting characteristics of in vivo-like adipocytes. Within the quantitatively analyzed data (leptin, oil red-O, and basal glycerol release), no significant changes were found. Further, no significant changes were found for any gene expression. These findings are positive, considering that ACs are terminally differentiated cells that primarily control energy balance and secrete various protein and lipid factors.[54]
In conclusion, both morphologically and in terms of adipocyte-specific properties, diffASC-GG hydrogels show high comparability with explanted WAT. Moreover, a culture period of more than 56 days is possible. For long-term experiments focusing on cell maturation or mature phenotypes, we recommend the use of these hydrogels.
4.4 AC-GG Hydrogels Mostly Maintain the Characteristic Phenotype for 21 Days
Only a limited number of studies have used ACs as a physiological cell type[55] for creating WAT. One reason for their limited use may be that these cells are known to be difficult to handle and sensitive to mechanical cues.[12] However, there are studies that demonstrate the successful use of ACs for longer periods of time within a microchip-based system.[34, 35] The adipocytes in this study also show relatively stable characteristics over 3 weeks. However, they are also showing the first signs of the beginning of dedifferentiation, like the decreasing integrity of perilipin A.[56] This is indicated by the multivacuolar morphology in perilipin A staining, the decrease in quantitative data of oil red-O staining, leptin secretion, and glycerol release. A reduced level of lipid accumulation and altered glucose metabolism is suggested by the significant decrease in the CFD and IRS genes.
In summary, AC-GG hydrogels have a mature and physiological state at the beginning of the culture, but this diminishes as the culture progresses, currently limiting the use of the culture to ≈21 days. We consider it useful for experiments that require fully mature cells at the beginning and do not exceed 3 weeks.
4.5 Explanted WAT Serves as a Promising Control for Native Tissue
Loss of volume and shape is known to occur even in implanted adipose tissue.[57] However, to establish comparability to the in vivo situation, it is useful to have a native control with the mature and functional phenotype of an adipocyte. This was also done in another study using explanted WAT as a control for bovine fat.[58] Prior to this study, we demonstrated the general use of the explanted WAT lobule as a native control.[37] The results here show that lobules remain metabolically stable over 3 weeks. This is to be assumed since there are no obvious changes in morphology, leptin secretion, oil red-O accumulation, or glycerol release. There are also only minor fluctuations at the gene level, which, as with the diffASC-GG hydrogels, indicates stable adipocyte metabolism.
Explanted WAT lobules were successfully used as a native control for human WAT. They maintained their cell characteristics morphologically and at relative gene levels over the culture period. However, we recommend their use as a native control or as a close in vivo model with mature cells in a physiological environment, but with limited donor reproducibility and stability, as the culture has not been evaluated for more than 21 days.
4.6 Model Overarching Summary, Conclusion, and Outlook
In this study, we analyzed 2D and various 3D adipose cell models. The stability and suitability of the models were evaluated by analyzing the cells in the models for adipocyte characteristics. It has been shown that each of the models is advantageous for different applications, but when it comes to the in vivo similarity of adipocytes, there are 2 models that are particularly recommended. One is the diffASC-GG hydrogel for long-term and/ or differentiation studies. The other one is the explanted WAT lobule with fully matured cells from the very beginning.
A summary of the characteristics of the presented adipose cell models is given in Table 2. Whereby the outcome is categorized as excellent (++), high (+), neutral (o), insufficient (−), and low (−).
| 2D Culture | Spheroid | diffASC-GG hydrogel | AC-GG hydrogel | Explanted lobule | |
|---|---|---|---|---|---|
| During adipogenic differentiation | |||||
| Lipid accumulation | ++ | ++ | ++ | ||
| Roundish cell morphology | − | + | + | ||
| Glycerol release | ++ | + | + | ||
| Increased PPARγ & CEBPα levels | ++ | + | ++ | ||
| During adipogenic maintenance | |||||
| Univacuolar morphology | −− | o | + | ++ | ++ |
| Model stability over time | o | + | ++ | − | ++ |
| Leptin secretion | ++ | + | ++ | + | ++ |
| Gene expression variation | o | + | + | − | ++ |
| Suggested application in biomedicine | |||||
| Short-term and high-throughput experiments if maturity is less important | Experiments with high initial cell density and self-organization potential | Long-term experiments focusing on cell maturation or mature phenotypes | Short-term experiments with fully mature cells at the beginning | Native control or in vivo-close model with matured cells | |
Our results indicate that the use of 3D cell models already showed meaningful differences from 2D monolayer culture in terms of in vivo similarity. Even though these models are still highly simplified compared to the complex structure of WAT, which includes multiple cell types, blood vessels, and specific architectures. To address the model complexity, a co-culture with other cells, such as endothelial cells or ASCs and ACs, would be beneficial to bring the cell models closer to an in vivo-like tissue model. In addition, the architecture can be modified, with the cells being specifically positioned in a type of extracellular network to mimic the WAT lobule.
Acknowledgements
The authors thank the Schenke-Layland Lab (Tübingen, Germany) for the opportunity to use and support LSM microscopy. Further, the authors thank Dr. Ziegler and the Team (Charlottenhaus, Stuttgart, Germany) for kindly providing the biopsies. The authors are grateful for the financial support of the European Regional Development Fund (Transaction number 1 099 895), and the Ministry of Science, Research, and Arts Baden Württemberg (IP2019 and 1 099 895).
Conflict of Interest
The authors declare no conflict of interest.
Author Contributions
F.B.A., F.F.S., S.N., and P.J.K. performed conceptualization. F.B.A., A-K.S., and A.K. performed methodology. F.B.A., S.N., and P.J.K. performed validation. F.B.A. and A-K.S. performed formal analysis. F.B.A. performed an investigation. P.J.K. brought resources. F.B.A. wrote and prepared the original draft. All authors wrote, reviewed, and edited the original draft. F.B.A., S.N., and P.J.K. performed visualization. S.N. and P.J.K. performed supervision. P.J.K. performed project administration. P.J.K. performed funding acquisition. All authors have read and agreed to the published version of the manuscript.
Open Research
Data Availability Statement
The data that support the findings of this study are available from the corresponding author upon reasonable request.


