Knee joint biomechanics during gait improve from 3 to 6 months after anterior cruciate ligament reconstruction
Abstract
Gait alterations after anterior cruciate ligament reconstruction (ACLR) are commonly reported and have been linked to posttraumatic osteoarthritis development. While knee gait alterations have been studied at several time points after ACLR, little is known about how these biomechanical variables change earlier than 6 months after surgery, nor is much known about how they differ over the entire stance phase of gait. The purpose of this study was to examine knee gait biomechanical variables over their entire movement pattern through stance at both 3 and 6 months after ACLR and to study the progression of interlimb asymmetry between the two postoperative time points. Thirty-five individuals underwent motion analysis during overground walking 3 (3.2 ± 0.5) and 6 (6.4 ± 0.7) months after ACLR. Knee biomechanical variables were compared between limbs and across time points through 100% of stance using statistical parametric mapping; this included a 2 × 2 (Limb × Time) repeated measures analysis of variance and two-tailed t-tests. Smaller knee joint angles, moments, extensor forces, and medial compartment forces were present in the involved versus uninvolved limb. Interlimb asymmetries were present at both time points but were less prevalent at 6 months. The uninvolved limb's biomechanical variables stayed relatively consistent over time, while the involved limb's trended toward that of the uninvolved limb. Statement of Clinical Significance: Interventions to correct asymmetrical gait patterns after ACLR may need to occur early after surgery and may need to focus on multiple parts of stance phase.
1 INTRODUCTION
Anterior cruciate ligament (ACL) tears are one of the most common knee injuries among young, active populations.1 Over the past few decades, the number of individuals who have opted to undergo ACL reconstructive (ACLR) surgery after tearing their ACL has increased.2, 3 Many of these individuals undergo this procedure with the hope of restoring stability to their knee and returning to their preinjury level of activity. While this procedure is successful at restoring knee stability, it often fails to resolve alterations in gait mechanics.
Interlimb (involved vs. uninvolved) asymmetries in gait mechanics are commonly reported after surgery and tend to persist even after being cleared to return to sport.4, 5 Frequently reported alterations include changes in involved limb peak knee flexion angles (KFAs),5-10 peak knee extension angles (KEA),11-13 peak knee flexion moments (KFMs),14-20 peak knee adduction moments (KAMs),15, 16, 18, 21, 22 quadriceps strength,17, 23, 24 and peak medial compartment contact forces (MCFs)15 (vs. uninvolved and healthy controls). The continuation of these asymmetries are concerning as they leave individuals at risk of reinjury25 and are thought to have long-lasting effects on joint health.15, 26-31 While gait abnormalities tend to normalize around 2 years after surgery,17, 32 changes in the loading environment that occur during these time periods may contribute to the premature development of posttraumatic knee osteoarthritis (OA).15, 28, 30, 31, 33 Understanding how gait aberrations progress during the early months after surgery, when interventions may be most feasible, can help inform new rehabilitative strategies to mitigate asymmetries and preserve long-term joint health.
Three months after ACLR, Lin et al.10 found an association between reduced involved limb knee flexion range of motion and lower knee extensor moments. Similarly, Sigward et al.9 found that asymmetries in knee moments, work, and flexion angles 1 month after surgery that persisted to when individuals were cleared for running (~4 months). Likewise, Di Stasi et al.5 found that regardless of return to sport status, at 6 months the involved limb demonstrates smaller knee extensor moments, suggesting that current rehabilitation protocols are not meeting their desired goals. These findings could be associated with quadriceps weakness. Lewek et al.24 found that individuals with quadriceps weakness 4 months after ACLR exhibited reduced knee angles and moments. However, regaining quadriceps strength may not be enough to regain symmetry in gait mechanics. Roewer et al.17 found that even after quadriceps strength symmetry was regained, asymmetries in KFAs, moments, and power persisted up to 6 months. Similarly, Arhos et al.34 found that restoration of quadriceps strength symmetry was not associated with symmetry in gait mechanics among individuals who were well rehabilitated. While gait mechanics have been assessed before 6 months after surgery, they have relied on surrogate measures for knee loading and have only assessed discrete points in the movement pattern (often peaks).
Many groups rely on surrogate measures for knee loading such as sagittal and frontal plane knee moments, due to the difficulty of obtaining in vivo joint loads.9, 35 KFM is used as a surrogate for total joint load and KAM is thought to represent the distribution of load between the medial and lateral compartments of the knee.36-38 In older populations, higher knee moments have been correlated to the occurrence and severity of knee OA.38-40 Early after ACLR, however, peak KFM4, 9, 17 is lower and peak KAM is reported to be lower15, 16, 18, 21 or no different15, 22 in the involved limb compared to the uninvolved limb and healthy controls. While these measures play a role in knee joint loading, neither account for muscle co-contraction, which is heightened in the ACLR population and can also play a major role in joint load.41, 42 Thus, an EMG-informed neuromusculoskeletal model, accounting for relative co-contraction of the muscles, may give a more accurate estimate of joint loads.43, 44 A study performed by Wellsandt et al.15 utilized this approach and found that individuals who developed radiographic OA 5 years after ACLR displayed significantly lower peak MCFs in their involved limb 6 months after surgery, compared to those who do not develop OA. These individuals also tended to underload their involved limb (vs. uninvolved).
Many have examined gait mechanics in the months and years following ACLR,8, 27 mostly focusing on peak values of knee biomechanical variables during gait. While this approach may be traditional, the reduction of continuous n-dimensional (nD) data to discrete values (0D) can lead to biasing of statistical results45 and does not provide the full picture of how the variable of interest is progressing throughout stance, which may result in missing regions where alterations occur.45-47 Since many biomechanical variables are time-varying (1D) data, employing a continuous analysis technique may give a more accurate and comprehensive view of how these variables are affected after surgery.45, 46 Statistical parametric mapping (SPM), the applied form of Random Field Theory,48, 49 allows for the statistical analysis of continuous data. SPM was originally developed for neuroimaging,50, 51 but recently has been utilized within the biomechanics community.13, 52, 53 By utilizing SPM techniques for continuous data analysis, we seek to gain a more accurate and holistic view of how limb asymmetries evolve throughout the stance phase of gait, and over early postsurgery time points when interventions may be most effective.
Therefore, the purpose of this study was to (1) examine knee gait variables (flexion angle, flexion moment, adduction moment, extensor forces, and medial compartment force [MCF]) between limbs at 3 and 6 months after ACLR and (2) assess how these variables change from 3 to 6 months after ACLR. We hypothesized that (1) interlimb asymmetries in knee gait variables would be present at 3 and 6 months after ACLR and (2) these asymmetries would be greater at 3 months than at 6 months, with the involved limb changing over time.
2 METHODS
2.1 Participants
Thirty-five individuals (Table 1) from a cohort study (R01-HD087459) were included in this study. Inclusion criteria were: no previous history of lower leg injury, no concomitant grade III ligament sprains, between the ages of 16 and 45, no meniscus repair, and unilateral primary ACLR. All data were collected at one institution following approval from an Institutional Review Board. All participants provided informed consent before participation in the study. For individuals under the age of 18, both minor assent and parental consent were obtained before enrolment.
| Variable | Mean ± standard deviation or number (%) |
|---|---|
| Age | 22 ± 6 years |
| Sex | 18 women (51%), 17 men (49%) |
| Height | 1.7 ± 0.1 m |
| Weight | 72.7 ± 14.0 kg |
| BMI | 24.7 ± 3.7 kg/m2 |
| Graft type | 6 soft-tissue allograft (17%), 11 hamstring autograft (32%), 18 bone-patellar tendon-bone autograft (51%) |
| Meniscal treatment | 7 partial lateral meniscectomy (20%), 5 partial medial meniscectomy (14%), 2 partial medial and lateral meniscectomy (6%), 21 no meniscectomy (60%) |
| Walking speed | 1.6 ± 0.2 m/s |
- Abbreviation: BMI, body mass index.
2.2 Gait analysis
All participants completed gait analysis during overground walking 3 (3.2 ± 0.5) and 6 (6.4 ± 0.7) months after ACLR using previously described methodologies.54, 55
Retroreflective markers were placed bilaterally on bony landmarks (iliac crests, greater trochanters, femoral epicondyles, malleoli, first and fifth metatarsal heads, and two markers on each calcaneus) and rigid shells containing multi-marker groupings were placed on the shanks, thighs, and pelvis.54 Participants were directed to walk down a 6-m walkway at a self-selected speed that was maintained across time points (±5%). Walking speed was monitored using two photoelectric beams (Brower Timing Systems). Once self-selected speed was established through practice trials, eight walking trials were collected for each limb. Kinematic (120 Hz) and kinetic (1080 Hz) data were recorded using an 8-camera Vicon system (Oxford Metrics Limited) and an embedded force platform (Bertec Corporation), respectively. Kinematic data were filtered at 6 Hz using a zero-lag, fourth-order Butterworth filter, while kinetic data were filtered at 25 Hz. Stance phase joint angles and moments were calculated using inverse dynamics in Visual3D using a 6 DOF approach (C-motion) and were normalized to 100% of stance. All joint moments were normalized to body weight (BW) and height (HT) (%BW × HT) and reported as external moments in the tibial coordinate system.
Surface electromyography (EMG) electrodes (MA-300 EMG System, Motion Lab Systems) were placed over seven muscles on each leg (rectus femoris, medial and lateral vasti, semimembranosus, long head of biceps femoris, medial and lateral gastrocnemii). EMG data were collected at 1080 Hz. Before walking, participants performed maximum voluntary isometric muscle contractions that were used to normalize the EMG signal obtained during overground walking. EMG data were high-passed filtered (30 Hz), rectified, and then low-passed filtered (6 Hz) using a second-order Butterworth filter to create linear envelopes for the seven muscles. Additionally, the semitendinosus was set equal to the linear envelope of the semimembranosus, the short head of the biceps femoris to the long head of the biceps femoris, and the vasus intermedius was calculated by averaging the linear envelopes of the medial and lateral vasti.
The EMG and gait analysis data were used as inputs to a previously validated EMG-informed neuromusculoskeletal model to compute muscle forces and joint contact forces.43, 55 Validation was performed using in vivo contact force data recorded from an instrumented knee prosthesis and was found to produce accurate predictions of joint forces.55 This model consisted of three components: an anatomical model, an activation dynamics model, and a contractions dynamics model. The anatomical model included a pelvis and femur, tibia, and foot segments that were scaled using subject anthropomorphic measurements and was actuated by 10 muscle-tendon units. The activation dynamics model transformed the EMG data into muscle activations and the contraction dynamics model subsequently transformed muscle activations to muscle forces using a previously described calibration process which varied adjustable muscle activation/contraction parameters so that the sagittal plane moment from the forward and inverse dynamics models matched.54 The MCF was then estimated using a frontal plane moment balance between the external and internal frontal plane knee moments.44
The variables of interest in this study were chosen based on previous evidence associating them with OA after ACLR.15, 26, 27 These variables of interest included: KFA, KFM, KAM, knee extensor forces (KEFs), and knee MCF. Extensor muscle forces were estimated by summing the forces of the rectus femoris, vastus medialis, vastus lateralis, and vastus intermedius.56 Both the KEF and the MCF were normalized by BW.
2.3 Statistical methods
Statistical analyses were performed using SPM1D57 in MATLAB (MathWorks). For each variable of interest, normality was assessed using D'Agostino–Pearson K2 tests.58 SPM was used to conduct a 2 × 2 (Limb × Time) repeated measures analysis of variance (α = 0.05). Additionally, two-tailed Student's t-tests were conducted to assess limb asymmetry at each time point and to assess change in interlimb differences (ILD = involved limb − uninvolved limb) from 3 to 6 months. For both tests, parametric or nonparametric approaches, depending on normality,59 were used (SPM1D supports both) to evaluate the data.
3 RESULTS
Significant differences between limbs were observed at both 3 and 6 months for many of the kinematic and kinetic variables of interest. Generally, interlimb differences decreased from 3 to 6 months.
3.1 KFA
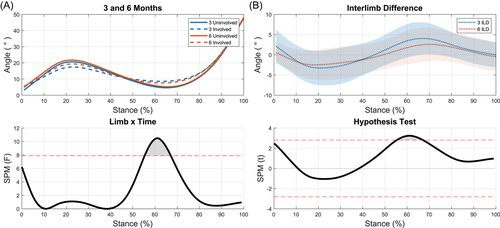
A significant limb-by-time interaction for KFA was present during terminal stance (56%–66% of stance, p = 0.038; Figure 1A) as the knee was extending. During this portion of stance, the ILD significantly decreased from 3 to 6 months (p = 0.010; Figure 1B). At 3 months, significant differences were present between limbs during weight acceptance through midstance (11%–33% of stance, p = 0.011) and during terminal stance (52%–85% of stance, p = 0.002; Figure 2A). While the magnitude of interlimb differences decreased at 6 months, the differences were still significant during weight acceptance and part of midstance (8%–30% of stance, p = 0.014) and terminal stance (60%–80% of stance, p = 0.019; Figure 2B).
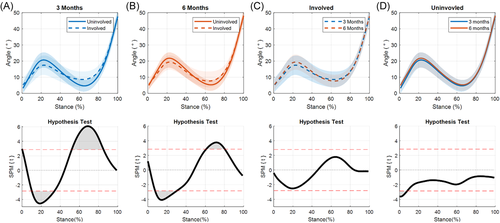
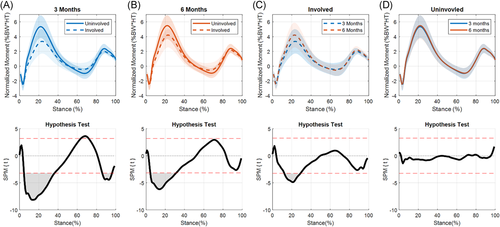
No significant differences were seen when comparing the involved limb across time points (Figure 2C). The uninvolved limb showed significant differences between time points during heel strike (0%–7%, p = 0.042; Figure 2D).
3.2 KFM
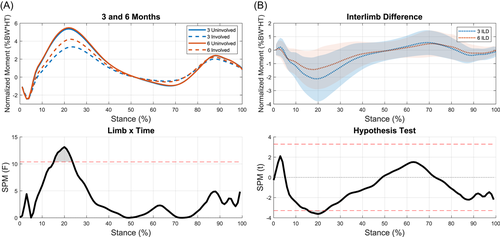
A significant limb-by-time interaction for KFM was present during the end of weight acceptance and the start of midstance (15%–24% of stance, p = 0.009; Figure 3A). The ILD significantly decreased from 3 to 6 months during this part of stance (p = 0.007; Figure 3B). t-tests showed significant differences between limbs at 3 months during weight acceptance and part of midstance (5%–36% of stance, p < 0.001), terminal stance (64%–71% of stance, p = 0.014), and preswing (86%–96% of stance, p = 0.005; Figure 4A). Interlimb differences decreased from 3 to 6 months with significant differences seen only during weight acceptance through midstance at 6 months (5%–31% of stance, p < 0.001; Figure 4B). During the transition from weight acceptance to midstance, KFM in the involved limb increased from 3 to 6 months (13%–29%, p < 0.001; Figure 4C). No differences were found for the uninvolved limb between time points (Figure 4D).
3.3 KAM
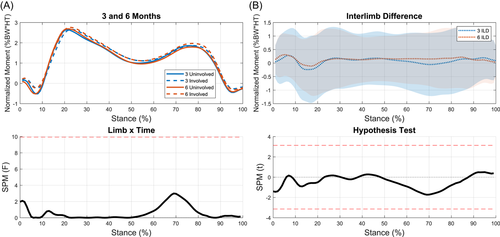
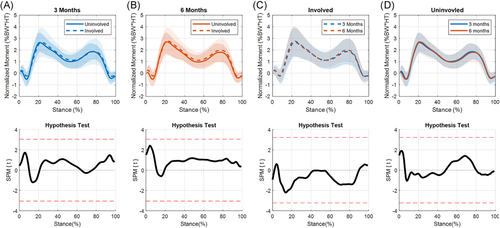
No significant differences were seen between limbs at either time point when assessing KAM (Figures 5 and 6).
3.4 KEFs
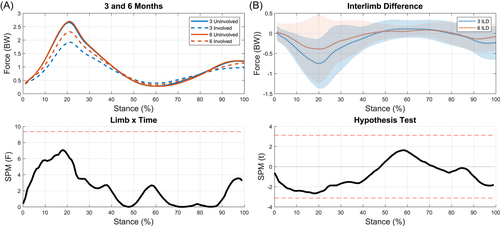
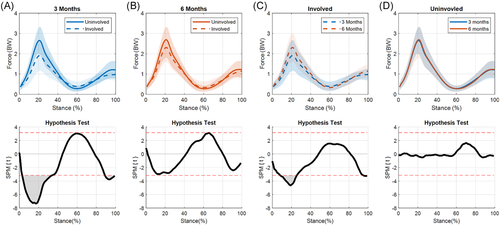
Interlimb differences were not significantly different between time points and no limb-by-time interaction occurred (Figure 7). Significant differences were present between limbs at 3 months (3%–34%, p < 0.001; 89%–100%, p = 0.01; Figure 8A), and approached significance at 6 months (Figure 8B). The involved limb's KEFs significantly increased from 3 to 6 months (9%–25%, p = 0.001; 95%–100%, p = 0.038; Figure 8C). There were no statistical differences between the uninvolved limb at 3 and 6 months (Figure 8D).
3.5 MCF
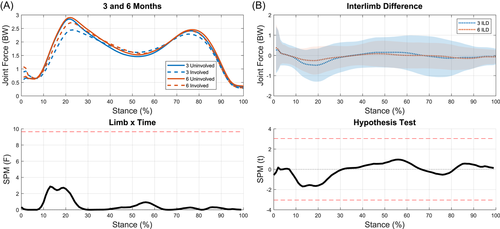
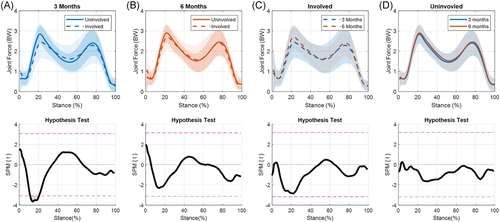
There was no limb-by-time interaction for MCF, nor was there a significant change in ILD over time (Figure 9). The medial compartment of the involved limb was significantly underloaded compared to the uninvolved limb at 3 months (12%–20%, p = 0.019; Figure 10A). While underloading was still present at 6 months, it was no longer statistically significant (Figure 10B). The reduction in MCF interlimb difference from 3 to 6 months appears to be driven by changes in the involved limb over time, as the involved limb's MCF increased from 3 to 6 months (Figure 10C) while the uninvolved limb's MCF stayed relativity consistent (Figure 10D).
4 DISCUSSION
Our first hypothesis was partially supported; asymmetries in KFA and KFM were present at both time points. Asymmetries in KEF and MCF were present only at 3 months, while no asymmetries were found for KAM regardless of time point. Our second hypothesis, that asymmetries would be greater at 3 months than 6 months, was also partially supported. Descriptively, interlimb asymmetries were greater at 3 months (vs. 6 months) for all our variables of interest except for KAM. However, this was only statistically supported in KFA and KFM, in which interlimb differences improved over time but were still present at the 6-month time point. Gait mechanics in the uninvolved limb stayed relatively consistent between 3 and 6 months, while the involved limb's mechanics trended towards that of the uninvolved limb over time. This pattern indicates that changes in mechanics early after ACLR primarily occur within the involved limb. The data presented here add to the timeline of how gait adapts early after ACLR. Understanding how gait alterations progress in the early months after surgery, when interventions may be most effective, may help inform the design of postoperative treatments aimed at mitigating altered biomechanics that are associated with the early onset of OA.
One of the most unique aspects of this study was the use of SPM to assess biomechanical asymmetries, and their changes, over stance phase. Recent work using SPM has highlighted the importance of considering the entire time-dependent data set rather than using discrete points. A study performed by Pataky et al.46 compared SPM to scalar extraction by re-analyzing biomechanical data sets that had been published using traditional 0D statistical analyses. These two analysis techniques produced conflicting statistical conclusions. Pataky concluded that discrete analyses may suffer from type I and type II errors as they fail to consider the entire measurement domain and ignore covariance among vector components. The utilization of SPM reduces the chance of these two sources of biases by performing hypothesis tests that consider the whole time series.45, 46 Thus, the use of SPM in this study, rather than traditionally used discrete values, reduces the likelihood of producing biased results.
4.1 KFA
Previous studies have reported smaller peak KFAs and peak KEAs in the involved limb (vs. uninvolved and healthy controls) 3 and 6 months after ACLR.5-9, 12 Our data align well with these findings showing significant differences between limbs at 3 and 6 months around the peaks of KFA during stance. ILDs were present during weight acceptance into midstance and terminal stance at both time points. While the magnitude of interlimb difference decreased from 3 to 6 months during both these phases of stance, they only significantly decreased during terminal stance. Individuals who demonstrate smaller KFAs typically exhibit quadriceps weakness.24 While quadriceps strength was not collected in this study, we did see an increase in the involved limb's KEFs during weight acceptance into midstance from 3 to 6 months. However, it is unclear if this is driven by changes in neuromuscular activation patterns or increases in strength. Regardless, these increase in KEFs may explain the increases in KFA between these time points.
A reduced KFA after ACLR is of concern as this may result in load being applied to regions of cartilage that are ill-suited to the new loading environment.29 From 0° to 30° of flexion, the point of contact within the medial compartment shifts posteriorly as KFA increases.60-62 This means that individuals who exhibit a reduction in KFA may load more anterior regions of cartilage, which are normally thinner and less capable of load bearing.62-64 Stress alterations in these newly loaded areas could be initiating irreversible cartilage damage.64 The involved limb's peak KFA tends to increase up to 1 year following ACLR, after which no differences between limbs have been reported.8, 26 A new concern arises when the point of contact within the joint now moves posteriorly as these flexion angles increase, as this region of cartilage may have experienced lower loads and stresses since ACLR.29, 62, 65 During this period of relative unloading, the cartilage is at risk of being altered to resemble nonweight bearing cartilage, potentially leaving the tissue unable to withstand the return to preinjury loads.64, 65 Therefore, it may not only be the reduction of KFA after ACLR that leads to irreversible cartilage damage but also the recovery of range of motion over this 1-year timeline. Further studies are warranted to explore this hypothesis and to identify what is considered a clinically meaningful change in KFA over the entire stance phase.
4.2 KFM
KFM showed ILDs at both 3 and 6 months however these ILDs significantly decreased by the 6-month time point. The decrease in interlimb difference from 3 to 6 months is driven by a significant increase in the involved limb's KFM. Asymmetries have been reported to persist in peak KFM up to 2 years after surgery14, 17, 20 and are partly attributed to insufficient quadriceps strength.6, 24, 66 Experiencing lower KFM after ACLR may also be attributed to lack of confidence, as assessed by patient-reported outcomes, in the individual's knee.67 Future work looking at patient-reported outcomes could help clarify if kinesiophobia is playing a role in these changes.
While decreases in interlimb difference are seen in these data, the involved limb is still experiencing significantly lower KFMs during weight acceptance into midstance at 6 months. A recently published study by our group using the same cohort found an association between lower involved limb (vs. uninvolved) KFMs and quantitative magnetic resonance imaging (MRI) values indicative of cartilage degradation 3 months after ACLR.68 This agrees with reports that healthy individuals who walked with higher peak KFM had thicker (and thus healthier) cartilage.69 However, conflicting evidence does exist as Teng et al.70 found that higher KFMs 6 months after ACLR were associated with worsening of joint cartilage (as assessed via quantitative MRI measures).70 It remains unclear if regaining symmetry in KFM from 3 to 6 months after ACLR will help preserve healthy knee cartilage, or if these adaptations may actually spur changes in the cartilage's biochemical health.
4.3 KAM
KAM did not show any significant differences between limbs at either time point. These data align well with previous studies that have found no difference in peak KAM between limbs at 6 months22 and 1 year15 after ACLR. However conflicting evidence suggesting lower peak KAM during this time also exists.15, 20, 71 In individuals with medial compartment knee OA, increases in peak KAM have been associated with increases in OA severity.26, 72 This association, in conjunction with the results seen here, may suggest that altered KAM is a result of OA rather than an initiating factor; however, future work is needed to explore this idea.
4.4 KEFs
There were significant differences between limbs in KEFs during weight acceptance into midstance at 3 months. These differences decreased from 3 to 6 months as the involved limb's KEFs significantly increased. While there were no statistical differences between limbs at 6 months, it should be noted that no significant changes in interlimb differences occurred from 3 to 6 months. This is not necessarily surprising as there is a high degree of variability in KEFs at 6 months; likely reflective of the large variability in ability to regain quadriceps strength early after surgery.73 A previous study from our lab assessing a different cohort reported KEF between 2 and 3 BW at peak MCF which align well with the results of the current study.56
Quadriceps weakness after ACLR is common in the involved limb and has been linked to alterations in gait.74, 75 Individuals who were classified as having weak quadriceps were shown to have similar gait patterns to individuals who were ACL deficient, while those classified as having strong quadriceps were similar to healthy controls.24 While it cannot be determined if differences in extensor forces reported here are due to muscle strength or how the muscle is being activated, these data suggest that regaining symmetric quadriceps forces could be essential to return to preinjury gait patterns. However, recent evidence from a separate cohort indicates that improving quadriceps strength alone is not sufficient to restore symmetrical gait mechanics.34
4.5 MCF
The magnitude, peak values (~2–3 BW), and shape of MCF curves in this study align well with previous studies utilizing the same model15, 44, 76 and a study that reported values from instrumented knee implants.77 We found significant asymmetries in MCFs at 3 months, but not 6 months. These results contradict previous findings from our lab that reported lesser loading in the involved limb at 6 months after ACLR.15 These findings highlight the importance of using EMG-driven models to assess joint loading as we saw different “loading” patterns when assessing KAM (no differences between limbs) and KFM (differences at 3 and 6 months) when compared to the MCF.
It is still unclear how changes in loading magnitude and distribution affect the health of the cartilage over time. Since cartilage is conditioned for specific loading environments,29 the combination of changes in load and altered gait patterns may cause excessive loading in regions of cartilage that were once considered non-loadbearing.62 A study by Kaiser et al.78 provided evidence of this by using a combination of dynamic and quantitative MRI to assess joint contact and cartilage biochemical health. They found that reconstructed knees exhibited increased contact areas along the medial spine of the medial tibial plateau and exhibited quantitative MRI values that are indicative of early cartilage degeneration in this area when compared to the contralateral limb and healthy controls.
4.6 Limitations and future work
There are several limitations that should be considered when interpreting the results of this study. First, no strength measurements were performed. While we can estimate the muscle forces exerted throughout gait, no conclusions can be drawn about how muscular strength deficits progressed in the early months after surgery and how they relate to changes in knee mechanics. Another limitation is that we were not able to control for participants' postoperative rehabilitation and graft types used during surgery. Participants were recruited from multiple clinics from the surrounding area and therefore may have undergone different rehabilitation protocols. Similarly, participants underwent their ACL reconstructive surgery from a variety of surgeons who used different graft types and surgical techniques. While controlling these measures would be ideal, this would limit the generalizability of this study to the broader ACLR population. This study excluded individuals who required a meniscal repair due to the extended nonweight-bearing period that is required after this procedure; however, individuals who received a meniscectomy are not required to remain nonweight bearing for an extended time due to the procedure and therefore were eligible for this study. It is unlikely that all the participants included in this study will develop OA. Future work will examine the effect early changes in gait mechanics have on long-term cartilage health.
While SPM has been shown to be a useful tool for analyzing biomechanical data it is not without limitations as a statistical analysis technique. Biomechanical curves may require registration due to data misalignment. For this study, we normalized our curves to 100% of stance, which helped with data alignment. However, applying nonlinear registration may also be a helpful approach to mitigating misalignment of data and should be investigated. Another limitation is that significance does not necessarily indicate meaningful differences. Previous studies have reported clinically meaningful differences at discrete points during gait,26, 79 but none currently exist for continuous data analysis. Future work should establish these thresholds for SPM. Finally, no power analysis was performed for the current study. Since the data for this study is a subset of data from a larger cohort, if a power analysis were performed it would be classified as a postexperimental power analysis, which has been shown to be an inappropriate test for power.80, 81
5 CONCLUSION
In this study, we utilized SPM to assess how gait adapts from 3 to 6 months after ACLR. We found significant asymmetries between limbs in KFA, KFM, KEF, and MCF 3 months after ACLR but by 6 months KEF and MCF were no longer significantly different. While differences between limbs were still present for KFA and KFM, these asymmetries had significantly decreased by 6 months. These early time points after surgery may be the ideal period for interventions to develop a healthy gait pattern, since abnormal gait biomechanics as early as 6 months after ACLR is linked to the development of posttraumatic OA.15, 31, 35, 82
The use of discrete values to analyze gait after ACLR underutilizes the wealth of data that is collected during gait analyses. Through the use of SPM to assess the entire gait cycle we can paint a more holistic picture of alterations in gait after ACLR. This study expands upon the existing literature which has focused on discrete values to understand aberrations in gait mechanics. Altogether, this study adds to our understanding of how biomechanical alterations are changing over stance phase during the early months after surgery. These results may be used to help inform the design of future studies investigating the pathogenesis of OA and may ultimately be useful in the design of early gait interventions aimed at mitigating the development of the disease.
ACKNOWLEDGMENTS
Funding was provided by the National Institutes of Health (NIH) including Eunice Kennedy Shriver National Institute of Child Health and Human Development: R01-HD087459, F30 HD096830, and F32 AG066274. The content is solely the responsibility of the authors and does not necessarily represent the official views of the National Institutes of Health. Thank you to Martha Callahan, Jennifer Marmon, and the Delaware Rehabilitation Institute Clinical Research Core for assistance with subject recruitment and retention, and Bryn Bonner for her assistance with data processing.
AUTHOR CONTRIBUTIONS
Kelsey Neal contributed to research design, data acquisition, data analysis, data interpretation, and manuscript drafting. Jack R. Williams, Abdulmajeed Alfayyadh, Jacob J. Capin, and Ashutosh Khandha contributed to data acquisition, data analysis, data interpretation, and critical review of the manuscript. Kurt Manal contributed to data interpretation and critical review of the manuscript. Lynn Snyder-Mackler and Thomas S. Buchanan contributed to research design, funding acquisition, data interpretation, and critical review. All authors have read and approved the manuscript before submission.


