Influence of Multiband Technique on Temporal Diffusion Spectroscopy and Its Diagnostic Value in Breast Tumors
Jie Ding, Zhen Zhang, and Hongyan Xiao are cofirst authors.
Abstract
Background
Temporal diffusion spectroscopy (TDS) is a noninvasive diffusion imaging technique used to characterizing cellular microstructures. The influence of multiband (MB) on TDS, particularly in breast tumor imaging remain unknown.
Purpose
To investigate the influence of MB on TDS in terms of scanning time, image quality, and quantitative parameters and to assess the diagnostic value of TDS with MB in breast tumors.
Study Type
Prospective.
Population
Seventy-one women with 71 confirmed lesions.
Field Strength/Sequence
3.0 T; oscillating gradient spin-echo (OGSE), OGSE with MB, and pulsed gradient spin-echo, and routine magnetic resonance imaging squences.
Assessment
TDS with MB was used to assess diagnostic efficacy in differentiating benign and malignant tumors. A comparison of scanning time and image quality was performed in 17 patients. Imaging parameters were analyzed using limited spectrally edited diffusion (IMPULSED) and apparent diffusion coefficient (ADC) values were compared between MB and non-MB protocols. The cell diameter from TDS was compared with histopathological measurements in 21 patients.
Statistical Tests
Bland–Altman plot, paired t test, Mann–Whitney U test, kappa test, DeLong's test, intraclass correlation coefficient agreement, receiver operating characteristic curve, area under the curve (AUC), and simple linear regression, with statistical significance set at P < 0.05.
Results
The TDS with MB protocol had a shorter average scanning time than that without MB protocol (7 minutes 22 seconds vs. 12 minutes 28 seconds); image quality was improved by reducing image artifacts. Most IMPULSED parameters and ADC values did not significantly differ between the MB and non-MB protocols (P = 0.23, P = 0.17). The IMPULSED parameters of cellularity and intracellular volume fraction achieved the highest AUC values for distinguishing breast tumors (0.865 and 0.821, respectively), surpassing the diagnostic efficiency of conventional ADC-1000 (0.776). The correlation between IMPULSED parameters and microscopic cell size was strong (r = 0.842).
Data Conclusion
The MB technique improved the TDS protocol's efficiency and reduced the image artifacts. TDS parameters correlated with pathological findings and showed good performance in differentiating benign from malignant breast tumors.
Plain Language Summary
We explored the impact of simultaneous multislice acquisition technology on temporal diffusion spectroscopy (TDS) and whether combining this method could help distinguish benign from malignant breast tumors. Our findings showed that simultaneous multislice acquisition technology shortened the scanning time and improved image quality by reducing motion-related issues. Additionally, measurements of cell size using simultaneous multislice acquisition technology matched well with results from pathology tests. Overall, our study suggests that simultaneous multislice acquisition enhanced TDS could make breast cancer diagnosis more accurate and efficient, offering good advantages compared to conventional imaging methods.
Level of Evidence
2
Technical Efficacy
Stage 2
According to the 2024 estimates from the International Agency for Research on Cancer Global Cancer Observatory, breast cancer has the highest incidence and mortality rates among cancers in women.1 Timely and precise breast cancer diagnosis is important for effective clinical treatment. However, the standard for confirming breast cancer relies on cellular structural assessments, including cell size, arrangement, and nuclear morphology, which are usually obtained through invasive pathological methods and have limitations for screening and longitudinal monitoring of a large number of patients.2 Therefore, noninvasive acquisition of cellular microstructural information characterizing the pathological cellular features is necessary.
Recent advancements in time-dependent microstructural diffusion magnetic resonance imaging (MRI) have enabled the in vivo characterization of tumor pathology.3 Temporal diffusion spectroscopy (TDS), a novel diffusion imaging technique utilizing pulsed gradient spin-echo (PGSE) and oscillating gradient spin-echo (OGSE) sequences with varying diffusion times, has recently emerged in breast cancer research.4 Through TDS, microstructural information at the cellular and subcellular levels can be indirectly calculated,5 including imaging microstructural parameters using limited spectrally edited diffusion (IMPULSED) parameters such as mean cell diameter (D), intracellular fraction (Vin), extracellular diffusivity (Dex), cellularity (cell density), and derived apparent diffusion coefficient (ADC) values (obtained according to different diffusion times and their difference change rates). Based on these specific imaging markers, specific tumor microstructures can be used to precisely describe the pathological characteristics of breast tumors precisely.5
Current research on TDS indicates that achieving optimal results often requires extended scanning times compared with standard durations (eg, 12 vs. 6 minutes) to ensure better accuracy in diffusion parameter estimation. This is due to the complexity of signal acquisition and the sensitivity of TDS to variations in diffusion metrics under shorter scanning conditions. Conversely, the scanning time needs to be reduced by changing parameters such as the b-value to facilitate the use of TDS in clinics. However, this could compromise the accuracy of the results. Therefore, to ensure the efficiency and reliability of TDS technology in clinical applications, the imaging technique must be optimized, and its accuracy must be systematically verified. In simultaneous multislice scanning (multiband [MB]), multiple slices can be excited simultaneously using multiband radiofrequency pulses.6, 7 This significantly reduces imaging time and lowers the likelihood of motion-induced artifacts, thereby improving the scanning efficiency and improving image quality. In the breast field, MB technology is currently mainly used for routine diffusion-weighted imaging (DWI) scanning based on echo planar imaging sequences, and few reports6, 7 are available on its use in high-order diffusion imaging, such as TDS of the breast. Therefore, whether the MB technique has any effect on the image signal-to-noise ratio (SNR) and quantitative parameters when applied to diffusion higher-order modeling in breast MRI needs to be considered.
Xu et al4 recently demonstrated the practicability of TDS microstructural imaging using a high-performance scanner in seven patients with breast cancer. Nevertheless, its diagnostic value in benign and malignant breast tumors remains unclear. Iima et al8, 9 reported that found that ΔADC% (the difference ratio of ADC values at different diffusion times) obtained through TDS technology exhibited greater sensitivity in discriminating benign and malignant head and neck tumors and breast tumors than conventional ADC values. However, the broader biological research implications of TDS quantitative parameters are yet to be explored.
This study aimed to examine the impact of MB technology on scanning time, image quality, and quantitative parameters of TDS. We aimed to evaluate the diagnostic value of TDS combined with MB in differentiating benign tumors from malignant breast tumors and to compare these results with histopathology for noninvasive characterization of breast tumor cellular properties.
Materials and Methods
Study Population
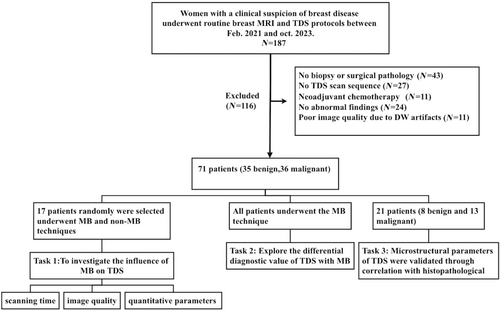
Patients with suspected breast disease at People's Hospital of Ningxia Hui Autonomous Region between February 2021 and October 2023 were prospectively enrolled. The Ethics Committee of Ningxia Hui Autonomous Region approved our study (approval number [2021]-NZR-040), and all patients with clinically suspected breast tumors provided written informed consent. Inclusion in this study required (1) completion of routine MRI and TDS scanning and (2) measurable lesions visible on the TDS sequence. The exclusion criteria were as follows: (1) absence of biopsy or surgical pathology; (2) incomplete imaging sequences or clinical data; (3) prior treatment before the scan; (4) lack of abnormal findings; and (5) poor image quality preventing region of interest (ROI) delineation (Fig. 1). All included patients were scanned using MB technology, and a total of 17 patients who were underwent both MB and non-MB scanning protocols were selected based on the alternating parity of the image number.
Magnetic Resonance Imaging Data Acquisition
All patients underwent routine MRI using the Ingenia 3.0 T CX scanner (Philips, Best, The Netherlands) with a maximum gradient of 80 mT/m, slew rate of 200 mT/m/second, and a 16-channel breast coil. Breast imaging protocols included routine sequences (T1W, T2W, DWI, and dynamic contrast-enhanced) and TDS-based scanning protocols prior to enhanced scanning. TDS sequence scanning included OGSE and PGSE. OGSE sequences were acquired with two sets of parameters: OGSE-N1 (fdiff = 25 Hz, effective diffusion time = 10 msec, one cycle) and OGSE-N2 (fdiff = 50 Hz, effective diffusion time = 5 msec, two cycles) based on the varying oscillation periods and diffusion frequencies. Two TDS-based scanning protocols were used in this study: one set of protocols involved a multilayer simultaneous excitation technique with an MB factor of 2 (OGSE-N1MB, OGSE-N2MB, and PGSE-MB), with an acquisition time of 7 minutes 22 seconds, whereas the other set of protocols involved scanning without MB technology (OGSE-N1, OGSE-N2, and PGSE), with an acquisition time of 12 minutes 28 seconds. The scanning parameters are listed in Table 1. The MB technique was used in all enrolled patients, and 17 patients additionally underwent non-MB TDS.
| OGSE-N1a | OGSE-N2a | PGSE | |
|---|---|---|---|
| Orientation | Axial | Axial | Axial |
| TR/TE, msec | 8300/110 | 4500/110 | 3000/105 |
| TR/TE (MB), msec | 3200/120 | 2200/120 | 3000/105 |
| FOV, mm | 340 × 255 | 340 × 255 | 340 × 255 |
| Matrix | 228 × 229 | 228 × 229 | 228 × 229 |
| Diffusion time, msec | 10 | 5 | 74 |
| Resolution, mm | 3 × 3 | 3 × 3 | 3 × 3 |
| Slice thickness, mm | 5 | 5 | 5 |
| Acquisition time, minutes | 2.39 | 0.4 | 4.03 |
| b-value, seconds/mm2 | 0, 100, 250, 300, 500, 750, 1000 | 0, 100,150,200, 250, 300 | 0, 100, 200, 300, 500, 750,1000, 1400 |
| Number of sections | 8 | 8 | 8 |
| Diffusion frequency, Hz | 25 | 50 | NA |
| MB (factor = 2) acquisition time | 2 minutes 39 seconds | 0.4 minutes | 4 minutes 3 seconds |
| Non-MB acquisition time | 7 minutes 5 seconds | 1 minutes 20seconds | 4 minutes 3 seconds |
- OGSE = oscillating gradient spin-echo; PGSE = pulsed gradient spin-echo; TR = repetition time; TE = echo time; FOV = field of view; MB = multiband.
- a OGSE-N1 and OGSE data were acquired at an oscillating frequency of 25 Hz and one cycle of oscillation. OGSE-N2 and OGSE data are acquired at oscillating frequencies of 50 Hz for two cycles of oscillation.
Data Processing
All the OGSE and PGSE sequence images were registered using MATLAB (MathWorks, Natick, MA, USA). Using MATLAB software, two radiologists (Z.Z. and J.D.) with 5 and 10 years of experience in breast MRI diagnosis delineated the entire tumor ROI based on the lesion size on images with a PGSE sequence b-value of 1000, resulting in 3D-ROI. Tumor boundaries and internal signals were defined on the early dynamic contrast-enhanced images, and necrosis, hemorrhage, and cysts were excluded from 3D-ROI mapping. The IMPULSED parameters (cellularity, Vin, diameter, Dex) were calculated with the IMPULSED model,3 and the derived ADC values (ADC-N1, ADC-N2, ADC-PG, ADC-1000, ADC%N1-PG, ADC%N2-PG) were calculated using the MATLAB software based on the mapped 3D-ROI. The formula for the ADC value change rate was as follows: ADC%N1/N2-PG = (ADCOGSEN1/N2 − ADCPGSE)/ADCOGSEN1/N2. ADC values derived at different diffusion times were calculated using the highest b-values in the corresponding sequence.
Image Quality Evaluation
IMAGE SUBJECTIVE SCORING
The original dataset was anonymized, and MRI parameters were removed. The MB and non-MB TDS sequences were adjusted to the same size using an MRI multiviewer image browser on a Philips Workstation (Intelligence Portal 10). Four radiologists (Z.Z., J.D., R.Z., and L.Y.) with 5, 10, 7, and 12 years of experience in breast MRI diagnosis, respectively, independently and blindly examined random images of each patient. Viewers independently ranked images with and without MB technology based on image quality and preference. Four readers conducted a Likert scale scoring of the overall image quality of the two TDS scanning scheme sequences in terms of image blur degree, lesion boundary sharpness, clarity of adjacent organs, overall image distortion degree, and motion artifacts.13 The scoring assigned a single score to each image based on the above criteria on a 5-point scale: 5 (best image quality), 4 (good image quality), 3 (satisfactory image quality), 2 (poor image quality), and 1 (nondiagnostic image quality) (Appendix S1).13, 14 A score of ≥3 was considered to satisfy clinical diagnostic needs.
IMAGE OBJECTIVE SCORING
Histopathological Analysis
Statistical Analysis
Statistical analyses were performed using SPSS version 25 (IBM Corp., Armonk, NY, USA) and GraphPad Prism version 9.0. Continuous count data are presented as mean ± standard deviation. The normality of paired sample differences was assessed using the Shapiro–Wilk W test. ADC values for each b-value were compared between the non-MB and MB groups using a t-test. The consistency of IMPULSED parameters and derived ADC values was examined between the MB and non-MB groups using the Bland–Altman plot, paired t test, and Mann–Whitney U test, with statistical significance set at P < 0.05. Consistency between observers was evaluated using the kappa test, with the kappa values of <0.4, 0.41–0.75, and >0.75, indicating poor, good, and excellent consistency, respectively. Inter- and intra-agreement was assessed using intraclass correlation coefficient (ICC), with ICC values of ≤0.40, 0.40–0.59, 0.60–0.74, and 0.75–1.00, indicating poor, fair, good, and excellent agreement, respectively. IMPULSED quantitative parameters (cellularity, Vin, diameter, and Dex) and derived ADC values (ADC-N1, ADC-N2, ADC-PG, ADC-1000, ADC%N1-PG, and ADC%N2-PG) were investigated using receiver operating characteristic (ROC) curves. The Jorden index was used to evaluate the efficacy of differentiating between malignant and benign breast tumors. A binary logistic regression model was developed to diagnose and predict TDS quantitative parameters and to derive ADC values to distinguish benign from malignant breast lesions. Simple linear regression was used to assess the correlations between pathology- and IMPULSED-derived diameters from the whole-slide image sections of 21 patients. The correlation coefficient (r) was categorized as follows: r ≤ 0.24 indicates little or no correlation; 0.25–0.49 indicates fair correlation; 0.50–0.74 indicates moderate correlation; and 0.75–1.00 indicates good correlation.20
Results
Baseline Characteristics
Out of 187 patients who underwent routine breast MRI and TDS, 116 were excluded; a total of 71 patients were included in the final sample (Fig. 1). Among them, 17 patients were selected to be scanned using both the MB and non-MB scanning protocols. All 71 patients analyzed had lesions; however, only 17 patients underwent the two scanning protocols simultaneously. Seventeen patients had 17 lesions: among these lesions, 10 were benign (6 adenoses with hyperplastic nodules, 1 intraductal papilloma, and 3 fibroadenomas), whereas 7 were malignant (6 invasive ductal carcinomas and 1 ductal carcinoma in situ). All patient characteristics, tumor size, and histology are summarized in Table 2.
| Characteristics | Number |
|---|---|
| Demographics | |
| No. of patients | 71 |
| Age, mean ± standard deviation (years) | 50.4 ± 14.5 |
| Menstruation state | |
| Premenopausal women | 39 (54.93%) |
| Postmenopausal women | 32 (45.07%) |
| Tumor size (mm) | |
| Malignant tumor | 28.3 ± 12.8 mm |
| Benign tumor | 13.7 ± 1.2 mm |
| Histology | |
| IDC | 29 (80.55%) |
| DCIS | 4 (11.11%) |
| ILC | 3 (8.33%) |
| Fibroadenoma | 17 (51.51%) |
| Intraductal papilloma | 6 (18.18%) |
| Adenosis with hyperplastic nodules | 10 (28.57%) |
| UDH | 2 (6.06%) |
- IDC = invasive ductal carcinoma; DCIS = ductal carcinoma in situ; ILC = invasive lobular carcinoma; UDH = usual ductal hyperplasia.
Subjective and Objective TDS Scores for MB and Non-MB Image Quality
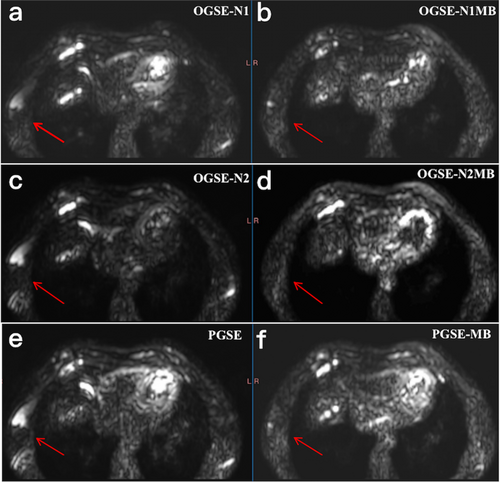
Subjective scoring indicated that the MB scenario group (OGSE-N1MB, 4.02 ± 0.67; OGSE-N2MB, 3.98 ± 0.61; PGSE-MB, 4.12 ± 0.57) had slightly higher scores than the non-MB group (OGSE-N1, 3.90 ± 0.57; OGSE-N2, 3.82 ± 0.68; PGSE 4.06 ± 0.64); however this difference did not reach statistical significance (Z = −1.46, P = 0.21). The MB technique could reduce image artifacts (Fig. 2; Appendix S1).
The MB group had slightly lower objective scores for SNR (SNRN1MB, 39.90 ± 29.91; SNRN2MB, 67.22 ± 52.99; SNRPGMB, 48.59 ± 31.86) and CR (CRN1MB, 143.05 ± 116.59; CRN2MB, 378.60 ± 305.46; CRPGMB, 70.71 ± 61.64) than the non-MB group (SNRN1, 55.88 ± 59.71; SNRN2, 84.21 ± 111.60; SNRPG, 68.66 ± 115.88; CRN1, 178.74 ± 182.19; CRN2, 469.95 ± 438.80; CRPG, 95.00 ± 83.33). However, these differences were not statistically significant (tSNR(N1MB−N1nonMB) = 1.32, P = 0.21; tSNR(N2MB−N2nonMB) = 1.88, P = 0.08; tSNR(PGMB−PGnonMB) = 1.58, P = 0.13; tCR(N1MB−N1nonMB) = 1.71, P = 0.15; tCR(N2MB−N2nonMB) = 1.91, P = 0.06; tCR(PGMB−PGnonMB) = 1.69, P = 0.11). The kappa test indicated consistent image scores for both the MB and non-MB groups, with kappa values of 0.55 and 0.61, respectively.
Analysis of the Consistency of TDS Parameters
Intra-reader agreement among the four radiologists was good and excellent for the overall image quality of both TDS-MB (ICC = 0.746, range: 0.593–0.847) and TDS non-MB (ICC = 0.758, range:0.661–0.839) images. The Bland–Altman results of 17 patients indicated good consistency in (Fig. 3; Appendix S1). The bias and 95% limits of agreement for the IMPULSED parameters and derived ADC values between the MB and non-MB groups were follows: cellularity (−0.13, −1.32 to 1.07), Vin (−0.01, −0.09 to 0.08), Dex (0.04, −0.29 to 0.37), diameter (0.99, −2.27 to 4.26), ADC-N1 (0.19, −0.31 to 0.68), ADC-N2 (0.06, −0.54 to 0.67), ADC-PG (0.06, −0.12 to 0.24), and ADC-1000 (0.06, −0.15 to 0.27). All parameters did not significantly differ between the MB and non-MB groups (tcellularityMB−nonMB = −0.84, P = 0.41; tVinMB−nonMB = −0.15, P = 0.89; tDexMB−nonMB = 0.90, P = 0.38; tdiameterMB−nonMB = 1.46, P = 0.15; tADCN1MB−nonMB = 1.23, P = 0.16; tADCN2MB−nonMB = 1.58, P = 0.11; tPGMB−nonMB = 0.38, P = 0.57).

Diagnostic Efficacy of the TDS-MB Protocol
IMPULSED PARAMETERS OF THE TDS-MB PROTOCOL FOR DIAGNOSING BENIGN AND MALIGNANT BREAST LESIONS
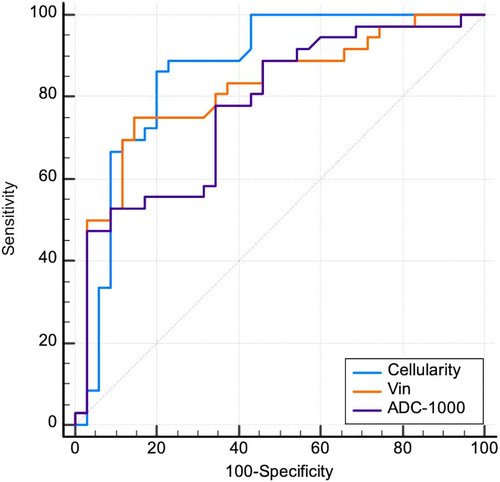
The area under the curve (AUC) values were 0.865 for cellularity, 0.821 for Vin, 0.581 for diameter, and 0.622 for Dex. Vin and cellularity demonstrated the highest diagnostic efficacy in distinguishing benign from malignant breast lesions. Malignant breast lesions exhibited higher cellularity and lower Dex than benign lesions (Table 3).
| Parameters | Benign | Malignant | AUC | Sensitivity | Specificity | PPV% | NPV% | Accuracy% |
|---|---|---|---|---|---|---|---|---|
| Cellularity | 1.12 ± 0.69 | 2.44 ± 1.21 | 0.865 | 86.11 | 80.00 | 83.78 | 85.29 | 84.51 |
| Vin | 0.17 ± 0.11 | 0.29 ± 0.12 | 0.821 | 75.00 | 85.71 | 84.37 | 76.92 | 80.28 |
| Diameter | 18.37 ± 4.52 | 16.96 ± 4.63 | 0.581 | 58.33 | 65.71 | 63.64 | 60.53 | 61.97 |
| Dex | 2.41 ± 0.42 | 2.21 ± 0.43 | 0.622 | 66.67 | 57.14 | 61.54 | 62.50 | 61.97 |
| ADC-N1MB | 1.91 ± 0.54 | 1.53 ± 0.44 | 0.715 | 66.67 | 77.14 | 47.06 | 40.00 | 45.07 |
| ADC-N2MB | 2.17 ± 0.57 | 1.89 ± 0.42 | 0.659 | 80.56 | 54.29 | 59.18 | 68.18 | 61.97 |
| ADC-PGMB | 1.43 ± 0.45 | 1.07 ± 0.40 | 0.738 | 58.33 | 82.86 | 42.00 | 28.57 | 38.03 |
| ADC-1000 | 1.66 ± 0.45 | 1.20 ± 0.41 | 0.776 | 61.11 | 88.57 | 84.62 | 68.89 | 74.65 |
| △ADC%N1-PGMB | 0.27 ± 0.10 | 0.31 ± 0.12 | 0.608 | 50.00 | 74.29 | 45.45 | 40.74 | 43.66 |
| △ADC%N2-PGMB | 0.31 ± 0.13 | 0.44 ± 0.12 | 0.760 | 66.67 | 74.29 | 48.98 | 45.45 | 47.89 |
- △ADC%N1-PGMB = (ADCOGSEN1MB − ADCPGSEMB)/ADCOGSEN1MB.
- △ADC%N2-PGMB = (ADCOGSEN2MB − ADCPGSEMB)/ADCOGSEN2MB.
- Vin = intracellular volume fraction; Dex = extracellular diffusion coefficient; AUC = area under the receiver operating characteristic curve; PPV = positive predictive value; NPV = negative predictive value.
ADC VALUES DERIVED FROM THE TDS-MB PROTOCOL FOR DIAGNOSING BENIGN AND MALIGNANT BREAST LESIONS
The AUC values for the derived ADC values (ADC-N1MB, ADC-N2MB, ADC-PGMB, ADC%N1-PGMB, and ADC%N2-PGMB) were 0.715, 0.659, 0.738, 0.608, and 0.760, respectively. The ADC-N1MB, ADC-N2MB, and ADC-PGMB values of malignant lesions were (1.53 ± 0.44, 1.89 ± 0.42, 1.07 ± 0.40) were lower than those of benign lesions (1.91 ± 0.54, 2.17 ± 0.57, 1.43 ± 0.45, respectively) (Table 3). However, the rate of change in ADC values, indicated by ADC%N1-PGMB and ADC%N2-PGMB, was higher in malignant lesions (0.31 ± 0.12 and 0.44 ± 0.12) than in benign lesions (0.27 ± 0.10 and 0.31 ± 0.13). The derive ADC values (ADC-N2MB, ADC-N1MB, ADC-PGMB) for both benign (2.17 ± 0.57, 1.91 ± 0.54, 1.43 ± 0.45) and malignant (1.89 ± 0.42, 1.53 ± 0.44, 1.07 ± 0.40) breast lesions decreased with extended diffusion time (5,10, and 70 msec).
COMPARISON OF DIAGNOSTIC EFFICACY WITH CONVENTIONAL ADC-1000 VALUES
Cellularity and Vin demonstrated superior diagnostic efficacy in distinguishing benign from malignant breast lesions, with areas under the ROC curves of 0.865 and 0.821, respectively, compared with conventional ADC-1000 (0.776, P = 0.03) (Fig. 4). The AUC value of ΔADC%N2-PGMB (0.760) was comparable to that of conventional ADC, with no statistically significant difference (Z = 0.21, P = 0.83).
Correlation of the Diameter Between IMPULSED and Histopathology
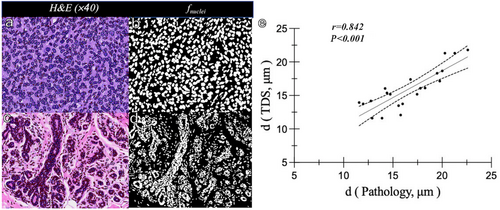
In H&E-stained sections, the cell density of breast invasive carcinoma was significantly higher than that of breast adenopathy, and the cell morphology and distribution were more irregular than those of benign lesions (Fig. 5a–d). The IMPULSED-derived diameters in these two cases were 22.61 and 18.76 μm, respectively, which were similar to the automated quantified pathologic nuclei diameters of 21.79 and 17.60 μm, respectively. The correlation between IMPULSED-derived and pathologic nuclei diameters was positive in a subset of 21 representative samples (13 malignant and eight benign lesions, r = 0.842) (Fig. 5e).
Discussion
Our study investigated the impact and clinical value of MB technology on TDS, focusing on optimizing scanning protocols and differentiating breast tumors. The results demonstrated that MB technology significantly reduced the total TDS scanning time (from 12 minutes 28 seconds to 7 minutes 22 seconds), while maintaining comparable image quality and quantitative parameter consistency to non-MB images in terms of lesion depiction. Although MB images exhibited a lower SNR compared to non-MB images, the shorter scanning time minimized patient movement, effectively reducing motion artifacts, especially in the axillary region. This reduction in motion artifacts likely contributed to the improved depiction of lesion boundaries. These results highlight the potential of MB technology to enhance clinical workflow efficiency and diagnostic accuracy in TDS applications.
No statistically significant difference between the two subjective scores was observed, and the kappa values of the two observers indicated in good agreement. The MB technology group had lower SNR and CR objective scores than the non-MB group, aligning with the findings of Preisner et al.21 This may be attributable to the ability of MB technology to merge multiple radiofrequency pulses into a single composite pulse, allowing for simultaneous excitation and acquisition at multiple slices with one excitation. This acquisition method can significantly reduce the repetition time required for image scanning. However, the multiple levels of the acquisition process are prone to image signal aliasing, thereby reducing the SNR to varying degrees.21 Despite this, the image quality after using the MB technique in our study was above 3 points, which satisfies the clinical diagnostic requirements. Meanwhile, the consistency comparison of TDS parameters showed no significant differences. The parameters in the MB and non-MB groups aligned well, consistent with Tang et al's findings.22 Ba et al17 explored the prediction of hormone receptor subtypes by IMPULSED parameters at different diffusion times, with two scanning protocols and 16 b-values, totaling approximately 9 minutes of acquisition time. In our study, which focused on the identification of benign and malignant breast tumors, 21 b-values were used with a total acquisition time of 7 minutes 22 seconds, accelerated by the MB technique. Although Ba et al17 used only 4.5 minutes in a single diffusion scanning protocol but only 8 b-values, the tissue diffusion information may be less than our scanning protocol which may affect the fitting accuracy of IMPULSED parameters of TDS. The number of patients in our study (N = 71) and the subset with histopathology cell size correlation (N = 21) were higher than those of Ba et al's study17 (N = 54 subjects, subset of N = 6 with cell size measurements) and Xu et al's study4 (N = 7, all with cell size measurements). Therefore, regarding the degree of improvement in clinical examination efficiency, the MB-accelerated TDS protocol can complete multidimensional cellular microstructure imaging of the breast in 7 minutes 22 seconds, which is feasible with the current clinical equipment.
Based on our findings, we further investigated the diagnostic effectiveness of the MB-accelerated TDS scanning protocol compared to conventional ADC values in distinguishing breast tumors. A key clinical finding was that the IMPULSED parameters, (specifically cellularity and Vin) in the MB-accelerated TDS scanning protocol were superior to the conventional ADC (ADC-1000) value for identifying breast tumors. Additionally, the diameters obtained using the TDS-MB protocol strongly correlated with pathological findings. Our results indicated that cellularity and Vin exhibited the highest diagnostic efficacy and that malignant breast lesions displayed higher cellularity and Vin than benign lesions These results are supported by the findings of previous histopathological studies,8, 9, 11, 23, 24 which reported that malignant breast tumors would increase, the morphology would become irregular, and the number of nuclear divisions and cell atypia would increase. The ADC value variation is influenced by the b-value setting, diffusion time, and other conditions. Our study found that malignant breast lesions exhibited lower ADC values than benign lesions in both OGSE and PGSE sequences, which is consistent with the results of prior research.8, 9 This disparity is attributed to water molecules having a higher likelihood of interacting with microscopic tissue features over a more extended period, resulting in less signal attenuation and smaller ADC. This trend is prominent in tumors, particularly those with an increased number of tumor cells.
Our results demonstrated that the ADC values for both benign and malignant breast lesions decreased with extended diffusion time, which is consistent with the findings of previous reports.8, 11 This observation supports the hypothesis that tissue diffusion obstruction, including that in tumors, intensifies over time owing to the increased interactions with cellular microstructures. The strong dependence on the diffusion time observed in benign and malignant breast lesions should be highlighted. Other studies, such as those by Maekawa et al24 and Iima et al,8 have stressed the importance of reporting the diffusion time factor when evaluating oncologic lesions using ADC values.
To further validate the impact of MB technology on the accuracy of the IMPULSED diameter, pathological H&E-stained sections were randomly selected for complete digital pathological scanning, and the nuclei of the pathological sections were categorized using Hover-Net25 software to calculate the cell size. An excellent linear correlation between the cell diameter measured using TDS and the pathological results was observed. The shape of the cells in the malignant lesions was irregular, whereas the shape of the cells in the benign lesions were uniform and regularly distributed. However, this study found that malignant cells were smaller than benign cells, while pathological malignant tumors were larger than benign cells. This finding may be because, in addition to cancer cells, malignant tumors contain many small lymphocytes and inflammatory cells.17 Another reason may be that, in the IMPULSED model, the calculated cell size is the average value of the unit pixel; on average, the malignant cell diameter may be smaller than that of benign lesions. In addition, in our study, malignant breast lesions included individual ductal carcinoma in situ and lobular carcinoma, and these two cancer cells were smaller.26 Consequently, the average size of malignant cells may be smaller than that of benign cells. In contrast, benign lesions exhibited small and uniform cell heterogeneity, and the difference in the average cell size was not significant, potentially making them larger than those of malignant lesions.
Limitations
First, due to the limitation of scanning time, we only compared 17 patients who underwent both MB and non-MB TDS scans, which were monitored simultaneously. Future research should involve a larger cohort to assess the impact of MB technology and reduce the b-values on TDS parameters and accuracy. Additionally, different molecular types should be studied further, and multicenter research should be conducted. Second, the number of pathologically verified cases is small. H&E staining was primarily used to stain the nuclei, which could not accurately distinguish the cell membrane boundary and differed from the actual cell size. Additionally, matching images and pathological sections have been challenging to find in relevant studies. In the future, we will attempt to narrow the mapping gap between imaging and pathology through Na+-K-APT enzyme staining of cell membranes and large pathological sections.
Conclusion
This study examined the influence of MB technology on image quality and quantitative parameters in TDS scanning, evaluated its application in distinguishing benign from malignant breast tumors, and validated the findings with pathology-measured cell sizes. The results showed that accelerated TDS scanning could not only save scanning time but also guarantee image quality. It surpasses the conventional ADC value in differentiating breast tumors and shows a strong correlation with pathological cell size. This study supports the clinical use of accelerated TDS scanning protocols.
Acknowledgments
The authors thank Dr Yishi Wang from MR research collaboration team of Siemens Healthineers Ltd. for help in solving MR's technical problems. This study was supported by National Natural Science Foundation of China (NSFC 82071878) and Natural Science Foundation of Ningxia (2022AAC03369).
Conflict of Interest
The authors report no conflict of interest.


