SYNGR2 serves as a prognostic biomarker and correlates with immune infiltrates in esophageal squamous cell carcinoma
Funding information: Science and Technology Key Research and Development Program of Gansu Province, Grant/Award Number: 20YF3FA032; Key Talent Project of Gansu Province, Grant/Award Number: Gan Zu Tong Zi (2021) 17 Hao
Abstract
Background
Synaptogyrin-2 (SYNGR2) plays an important role in regulating membrane traffic in non-neuronal cells. However, the role of SYNGR2 in esophageal squamous cell carcinoma (ESCC) remains unclear.
Methods
All original data were downloaded from The Cancer Genome Atlas (TCGA) and Gene Expression Omnibus (GEO) databases and integrated via R 3.5.3. SYNGR2 expression was explored in the TCGA and GEO databases. The correlations between SYNGR2 and cancer immune characteristics were analyzed via the TIMER and TISIDB databases.
Results
In general, SYNGR2 was predominantly overexpressed and had reference values in the diagnosis and prognostic estimation of ESCC. Upregulated SYNGR2 was associated with poorer overall survival, disease-specific survival and T stage in ESCC. Mechanistically, we identified hub genes that included a total of 38 SYNGR2-related genes, which were tightly associated with the protein polyubiquitination pathway in ESCC patients. SYNGR2 expression was negatively related to the infiltrating levels of T helper cells. SYNGR2 methylation was positively correlated with the expression of chemokines (CCL2 and CXCL12), chemokine receptors (CCR1 and CCR2), immunoinhibitors (CXCL12 and TNFRSF4) and immunostimulators (CSF1R and PDCD1LG2) in ESCC.
Conclusion
SYNGR2 may be used as a biomarker for determining prognosis and immune infiltration in ESCC.
Abbreviations
-
- AUC
-
- the area under the ROC curve
-
- BP
-
- biological process
-
- CC
-
- cellular component
-
- DAVID
-
- Database for Annotation, Visualization and Integrated Discover
-
- ESCC
-
- esophageal squamous cell carcinoma
-
- GEO
-
- Gene Expression Omnibus
-
- GO
-
- Gene Ontology
-
- GSEA
-
- gene set enrichment analysis
-
- KEGG
-
- Kyoto Encyclopedia of Genes and Genomes
-
- MF
-
- molecular function
-
- OS
-
- overall survival
-
- ROC
-
- receiver operating characteristic
-
- SYNGR2
-
- synaptogyrin-2
-
- TCGA
-
- The Cancer Genome Atlas
-
- TILs
-
- tumor-infiltrating lymphocytes
1 INTRODUCTION
Esophageal cancer is one of the most common malignancies with the highest morbidity and mortality in the world, and it consists of two histological types, esophageal squamous cell carcinoma (ESCC) and esophageal adenocarcinoma.1-4 Among them, ESCC is the main type of esophageal cancer, ranking sixth and fourth in the morbidity and mortality of all malignant tumors in China.5, 6 Although current chemotherapy, radiotherapy and surgery have improved the overall survival of ESCC patients, the prognosis of ESCC patients is poor owing to the high recurrence probability of ESCC and limited treatment methods. In China, the 5-year survival rate of ESCC patients is only approximately 20%.7, 8 Therefore, it is necessary to explore new biomarkers for ESCC diagnosis, prognosis and treatment.
Immunotherapy has achieved remarkable results in a variety of tumors, but the interaction between ESCC and the immune system is unclear.9, 10 Tumor-infiltrating lymphocytes (TILs) have been shown to have prognostic and predictive roles in ESCC, and TILs can be effective prognostic markers for ESCC.11, 12 TILs can affect the tumor microenvironment by triggering an inflammatory response to form an immunostimulatory, antitumor or protumor microenvironment.13 Studies have shown that the level of T helper cells is related to the prognosis of ESCC.14 Therefore, it is of great clinical significance to study the infiltration of immune cells in ESCC.
The SYNGR2 gene is located at 17q25.3 and is a member of the synaptogyrin family. SYNGR2 has a transcript length of 1.6 kb and is highly expressed in all organs and tissues except the brain.15 Current studies have indicated that SYNGR2 plays an important role in cellular exocytosis, the storage and transport of GLUT4 at the cytoplasmic membrane, and the formation and maturation of microvesicles in neuronal cells.16 A recent study showed that SYNGR2 was significantly up-regulated during infection with severe fever with thrombocytopenia syndrome bunyavirus. Overexpression of SYNGR2 could induce the formation of synaptic vesicle-like microbubbles in neuroendocrine cells. SYNGR2 triggers the formation of vesicles or the reconstruction of existing vesicles through interaction and aggregation with virtual non-structural proteins, including membrane rearrangement or the fusion of lipid droplets on non-structural proteins, so as to reshape lipid droplets into unique formations of inclusion bodies or virus-like structures, which is conducive to the spread of bunyavirus.17, 18 A study on the cell cycle and apoptosis of lymphocytes induced by the Aggregatibacter actinomycetemcomitans cytolethal distending toxin (cdt) showed that SYNGR2 was highly expressed in human macrophages, promoted the combination of cholesterol in the lipid-rich membrane microdomain and cdtb (the active subunit B of cdt), and internalized and translocated cdtb to intracellular compartments, which played a key role in the cytotoxicity of cdt.19 At present, the achievements regarding synapsin family members in the field of tumor research are limited. Chromophobe renal cell carcinoma and renal oncocytoma are two different types of renal tumors. They have strong morphological and genetic similarities, but the current techniques for detecting the differences between them are very limited. Tan et al. found that SYNGR3 was expressed in the cytoplasm of chromophobe renal cell carcinoma, but not in the cytoplasm of renal oncocytoma. Therefore, SYNGR3 may play an important role in the differential diagnosis of chromophobe renal cell carcinoma and renal oncocytoma.20 However, the function of SYNGR2 in other diseases has been poorly studied, and there are no reports on the role of SYNGR2 in ESCC development and progression.
To better understand the role of the SYNGR2 gene in ESCC, we comprehensively assessed the relationship between the expression level of SYNGR2 and prognosis in the The Cancer Genome Atlas (TCGA), Gene Expression Omnibus (GEO) and Kaplan–Meier Plotter databases. Additionally, we validated the correlation between SYNGR2 and TILs in the TIMER and TISIDB databases. Our findings suggest that SYNGR2 can be a biomarker for predicting prognosis and immune cell infiltration in ESCC patients.
2 MATERIAL AND METHODS
2.1 Patient datasets
The mRNA expression data (including 82 ESCC samples and one adjacent non-tumor sample, RNAseq, TPM) and clinical information were downloaded from the TCGA database (https://cancergenome.nih.gov).21 We also downloaded the following gene expression profiles from the GEO database (https://www.ncbi.nlm.nih.gov/geo/)22: GSE26886 (including nine ESCC samples and 19 normal esophageal squamous epithelium samples),23 GSE45670 (including 28 ESCC samples and 10 normal esophageal epithelial samples)24 and GSE161533 (including 28 ESCC samples, 28 paired adjacent non-tumor samples and 28 normal esophageal epithelial samples).24
2.2 Survival analysis
Kaplan–Meier plots were generated, and the log-rank test was performed using ESCC data from the TCGA database by the R survival package to estimate the correlation between SYNGR2 expression and the survival rate of different clinical features in ESCC patients. The hazard ratio (HR) and log-rank p-value of the 95% confidence interval were also calculated.
2.3 Establishment and evaluation of the nomograms for ESCC survival prediction
The receiver operating characteristic (ROC) curve of diagnosis and time-dependent curve of diagnosis were created using R packages, including the pROC and time-ROC. Independent clinicopathological prognostic variables were chosen from Cox regression analysis, and a nomogram was constructed using the R package to evaluate the 1-, 3-, and 5-year overall survival (OS) probability of ESCC patients.
2.4 Protein–protein interaction network
Protein–protein interaction data were extracted from the STRING database (https://string-db.org) based on protein interactions and signaling pathways to predict the protein–protein interaction network of SYNGR2 coexpressed genes.25 An interaction with a combined score >0.15 was considered statistically significant. The network was constructed using Cytoscape 3.9.1 applications.26
2.5 Functional enrichment analysis
To understand the biological processes and pathways that SYNGR2 may participate in, we conducted the following analysis. The first 471 genes related to SYNGR2 in ESCC and the first 913 genes related to ESCC survival were obtained from the TCGA. These genes were enriched by Gene Ontology (GO) (including biological processes, cellular components and molecular function) and Kyoto Encyclopedia of Genes and Genomes (KEGG) pathway analyses using the Database for Annotation, Visualization and Integrated Discover (DAVID) and visualized by the R package ggplot2.27 A corrected p < 0.05 was determined to be statistically significant.
2.6 Immune infiltration analysis by single-sample GSEA
Immune infiltration analysis of ESCC samples was performed by the single-sample gene set enrichment analysis (GSEA) method using the GSVA package in R (http://www.biocondutor.org/package/release/bioc/html/GSVA.html) for 24 types of immune cells. Spearman’s correlation coefficient analysis was performed to identify relationships between ESCC and each immune cell subset.
2.7 LinkedOmics database analysis
The LinkedOmics database (http://www.linkedomics.org) was used to explore the expression profile of SYNGR2. We explored the GO and KEGG pathways of SYNGR2 and its coexpressed genes using GSEA in the Link Interpreter module.28
2.8 TISIDB database analysis
TISIDB is an integrated knowledge base portal that plays a vital role in detecting the interaction between tumors and the immune system (http://cis.hku.hk/TISIDB/).29 To further clarify the immune correlation of SYNGR2 in cancer, we used the “Immunomodulator” module of the TISIDB database to analyze and evaluate the correlation between SYNGR2 methylation levels and the levels of immune checkpoint genes. We further studied the association between SYNGR2 methylation levels and chemokine/chemokine receptor expression through the “chemokine” module.
2.9 Statistical analysis
Box plots were used to assess the expression level of the SYNGR2 gene in ESCC patients. The cutoff value of SYNGR2 expression was selected as the median method of gene expression. The Wilcoxon signed-rank test and logistic regression were used to investigate the relationship between clinical characteristics and SYNGR2 expression in ESCC. Forest plots were constructed using the R package “forestplot”. Univariate Cox analysis was performed to test for possible prognostic factors, and multivariate Cox analysis was utilized to confirm the influence of SYNGR2 expression on survival in conjunction with other clinical variables. R statistical software (version 3.5.3) or SPSS software was used for all statistical analyses (version 24.0). Statistical significance was defined as a p-value less than 0.05.
3 RESULTS
3.1 Baseline characteristics of patients
Data from a total of 82 ESCC patients with the required clinical features were acquired from the TCGA data portal. The detailed clinical features are listed in Table 1. Among the 82 participants, 70 were male (75.4%) and 12 were female (14.6%). Among them, 63 patients (64.6%) were younger than or equal to 65 years, and 29 patients (35.4%) were older than 60 years. In terms of ESCC stage, seven patients were stage I (8.9%), 47 patients were stage II (59.5%), 22 patients were stage III (27.8%) and three patients were stage IV (3.8%). In terms of histological grade, 15 patients were grade 1 (20.8%), 38 patients were grade 2 (52.8%) and 19 patients were grade 3 (26.4%).
| Characteristic | Low expression of SYNGR2 | High expression of SYNGR2 | p-Value |
|---|---|---|---|
| n | 41 | 41 | |
| T stage, n (%) | 0.114 | ||
| T1 | 3 (3.8%) | 5 (6.3%) | |
| T2 | 10 (12.7%) | 17 (21.5%) | |
| T3 | 26 (32.9%) | 15 (19%) | |
| T4 | 1 (1.3%) | 2 (2.5%) | |
| N stage, n (%) | 0.246 | ||
| N0 | 26 (33.3%) | 20 (25.6%) | |
| N1 | 12 (15.4%) | 14 (17.9%) | |
| N2 | 1 (1.3%) | 4 (5.1%) | |
| N3 | 0 (0%) | 1 (1.3%) | |
| M stage, n (%) | 0.615 | ||
| M0 | 36 (49.3%) | 34 (46.6%) | |
| M1 | 1 (1.4%) | 2 (2.7%) | |
| Pathological stage, n (%) | 1.000 | ||
| Stage I | 4 (5.1%) | 3 (3.8%) | |
| Stage II | 24 (30.4%) | 23 (29.1%) | |
| Stage III | 11 (13.9%) | 11 (13.9%) | |
| Stage IV | 1 (1.3%) | 2 (2.5%) | |
| Radiation therapy, n (%) | 0.857 | ||
| No | 25 (32.9%) | 22 (28.9%) | |
| Yes | 14 (18.4%) | 15 (19.7%) | |
| Primary therapy outcome, n (%) | 0.217 | ||
| PD | 2 (3.1%) | 4 (6.2%) | |
| SD | 2 (3.1%) | 0 (0%) | |
| PR | 0 (0%) | 1 (1.6%) | |
| CR | 33 (51.6%) | 22 (34.4%) | |
| Gender, n (%) | 0.755 | ||
| Female | 7 (8.5%) | 5 (6.1%) | |
| Male | 34 (41.5%) | 36 (43.9%) | |
| Race, n (%) | 0.744 | ||
| Asian | 19 (23.8%) | 18 (22.5%) | |
| Black or African American | 2 (2.5%) | 4 (5%) | |
| White | 20 (25%) | 17 (21.2%) | |
| Age, n (%) | 1.000 | ||
| ≤60 | 27 (32.9%) | 26 (31.7%) | |
| >60 | 14 (17.1%) | 15 (18.3%) | |
| Weight, n (%) | 0.744 | ||
| ≤70 | 30 (37%) | 33 (40.7%) | |
| >70 | 10 (12.3%) | 8 (9.9%) | |
| Height, n (%) | 0.957 | ||
| <170 | 14 (17.9%) | 16 (20.5%) | |
| ≥170 | 24 (30.8%) | 24 (30.8%) | |
| BMI, n (%) | 0.885 | ||
| ≤25 | 30 (38.5%) | 30 (38.5%) | |
| >25 | 8 (10.3%) | 10 (12.8%) | |
| Histological type, n (%) | 1.000 | ||
| Squamous cell carcinoma | 41 (50%) | 41 (50%) | |
| Residual tumor, n (%) | 0.674 | ||
| R0 | 31 (43.7%) | 34 (47.9%) | |
| R1 | 3 (4.2%) | 1 (1.4%) | |
| R2 | 1 (1.4%) | 1 (1.4%) | |
| Histological grade, n (%) | 0.785 | ||
| G1 | 7 (9.7%) | 8 (11.1%) | |
| G2 | 19 (26.4%) | 19 (26.4%) | |
| G3 | 11 (15.3%) | 8 (11.1%) | |
| Smoker, n (%) | 1.000 | ||
| No | 13 (16.5%) | 14 (17.7%) | |
| Yes | 26 (32.9%) | 26 (32.9%) | |
| Alcohol history, n (%) | 0.293 | ||
| No | 12 (15%) | 7 (8.8%) | |
| Yes | 28 (35%) | 33 (41.2%) | |
| Barrett’s esophagus, n (%) | 1.000 | ||
| No | 27 (46.6%) | 31 (53.4%) | |
| Yes | 0 (0%) | 0 (0%) | |
| Reflux history, n (%) | 0.482 | ||
| No | 25 (37.3%) | 29 (43.3%) | |
| Yes | 4 (6%) | 9 (13.4%) | |
| Tumor central location, n (%) | 0.113 | ||
| Distal | 21 (25.9%) | 17 (21%) | |
| Mid | 15 (18.5%) | 22 (27.2%) | |
| Proximal | 5 (6.2%) | 1 (1.2%) | |
| Columnar mucosa dysplasia, n (%) | 1.000 | ||
| High-grade dysplasia | 2 (8.7%) | 2 (8.7%) | |
| Low-grade dysplasia | 0 (0%) | 0 (0%) | |
| Negative/no dysplasia | 7 (30.4%) | 12 (52.2%) | |
| Columnar metaplasia, n (%) | 1.000 | ||
| No | 19 (44.2%) | 23 (53.5%) | |
| Yes | 0 (0%) | 1 (2.3%) | |
| OS event, n (%) | 0.009 | ||
| Alive | 34 (41.5%) | 22 (26.8%) | |
| Dead | 7 (8.5%) | 19 (23.2%) | |
| DSS event, n (%) | 0.062 | ||
| Alive | 36 (43.9%) | 28 (34.1%) | |
| Dead | 5 (6.1%) | 13 (15.9%) | |
| PFI event, n (%) | 0.657 | ||
| Alive | 24 (29.3%) | 21 (25.6%) | |
| Dead | 17 (20.7%) | 20 (24.4%) | |
| Age, mean ± SD | 58.05 ± 10.9 | 58.51 ± 10.08 | 0.842 |
- Abbreviations: BMI, body mass index; CR, complete response; DSS, disease-specific survival; PD, progressive disease; PFI, progression-free interval; PR, partial response; OS, overall survival; SD, stable disease; SYNGR2, Synaptogyrin-2.
3.2 SYNGR2 is highly expressed in ESCC
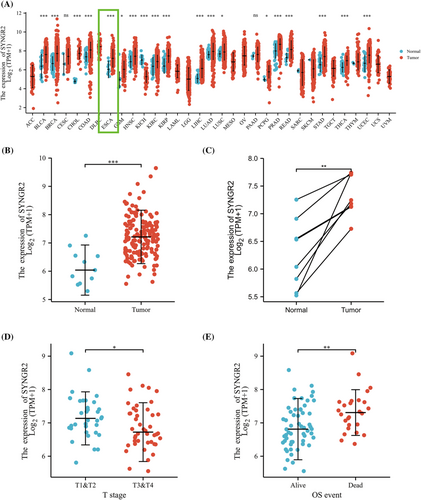
To explore the expression level of SYNGR2 in normal and tumor tissues, we downloaded and analyzed the expression levels of SYNGR2 mRNA in different tumors and normal tissues from the TCGA using the R package. The results showed that SYNGR2 expression was significantly higher in tumor tissues such as esophageal carcinoma, bladder urothelial carcinoma, breast cancer, colon adenocarcinoma, head and neck squamous cell carcinoma, glioblastoma multiforme, kidney renal clear cell carcinoma, kidney renal papillary cell carcinoma, liver hepatocellular carcinoma, lung adenocarcinoma, lung squamous cell carcinoma, pheochromocytoma and paraganglioma, prostate adenocarcinoma, rectum adenocarcinoma, stomach adenocarcinoma, thyroid carcinoma and uterine corpus endometrial carcinoma than in normal tissues. In addition, lower expression was observed in kidney chromophobe (Figure 1A). We used the TCGA database to evaluate the mRNA expression levels of SYNGR2 in ESCC patients and compared these with the expression levels in adjacent tissues. The results showed that the expression level of SYNGR2 in ESCC was significantly higher than that in paracarcinoma tissues (p < 0.001; Figure 1B). The results were verified in ESCC and paired paracarcinoma tissues (Figure 1C). Next, we used logistic analysis to analyze the relationship between different clinical parameters and the prognosis of patients, and we found that the T stage was associated with OS (Table 2). To analyze the correlation between the SYNGR2 expression and clinical characteristics in ESCC patients, we analyzed the mRNA expression levels of SYNGR2 in different clinical categories in the TCGA database. The association identified between SYNGR2 expression and clinical features in patients with ESCC is summarized in Table 3. The results showed that high expression of SYNGR2 was significantly related to T stage (p < 0.05) and OS (p < 0.05) (Figure 1D and Table 3). These data suggest that SYNGR2 is significantly upregulated in ESCC.
| Characteristics | Total (N) | Odds ratio | p-Value |
|---|---|---|---|
| T stage (T3 and T4 vs. T1 and T2) | 79 | 0.372 (0.146–0.917) | 0.034 |
| N stage (N1, N2 and N3 vs. N0) | 78 | 1.900 (0.767–4.826) | 0.169 |
| M stage (M1 vs. M0) | 73 | 2.118 (0.194–46.801) | 0.548 |
| Pathological stage (stages III and IV vs. stages I and II) | 79 | 1.167 (0.450–3.043) | 0.750 |
| Histological grade (G2 and G3 vs. G1) | 72 | 0.787 (0.245–2.477) | 0.681 |
| Age (>60 vs. ≤60) | 82 | 1.113 (0.449–2.773) | 0.817 |
| Gender (male vs. female) | 82 | 1.482 (0.432–5.432) | 0.534 |
| BMI (>25 vs. ≤25) | 78 | 1.250 (0.434–3.693) | 0.679 |
| Smoker (yes vs. no) | 79 | 0.929 (0.363–2.362) | 0.876 |
| Alcohol history (yes vs. no) | 80 | 2.020 (0.713–6.090) | 0.193 |
| Radiation therapy (yes vs. no) | 76 | 1.218 (0.481–3.101) | 0.677 |
| Residual tumor (R1 and R2 vs. R0) | 71 | 0.456 (0.060–2.505) | 0.383 |
| Race (Black or African American and White vs. Asian) | 80 | 1.008 (0.417–2.437) | 0.987 |
| Weight (>70 vs. ≤70) | 81 | 0.727 (0.247–2.082) | 0.553 |
| Height (≥170 vs. <170) | 78 | 0.875 (0.348–2.184) | 0.775 |
| Reflux history (yes vs. no) | 67 | 1.940 (0.558–7.868) | 0.315 |
| Tumor central location (mid and proximal vs. distal) | 81 | 1.421 (0.593–3.445) | 0.432 |
| Columnar mucosa dysplasia (high-grade dysplasia vs. negative/no dysplasia) | 23 | 0.583 (0.058–5.759) | 0.626 |
| Characteristics | Total (N) | Univariate analysis | Multivariate analysis | ||
|---|---|---|---|---|---|
| Hazard ratio (95% CI) | p-Value | Hazard ratio (95% CI) | p-Value | ||
| T stage | 79 | ||||
| T1 and T2 | 35 | Reference | |||
| T3 and T4 | 44 | 0.942 (0.414–2.142) | 0.887 | ||
| N stage | 78 | ||||
| N0 | 46 | Reference | |||
| N1, N2 and N3 | 32 | 2.337 (1.007–5.425) | 0.048 | 0.983 (0.287–3.367) | 0.979 |
| M stage | 73 | ||||
| M0 | 70 | Reference | |||
| M1 | 3 | 3.197 (0.909–11.238) | 0.070 | 1.028 (0.247–4.275) | 0.970 |
| Pathological stage | 79 | ||||
| Stages I and II | 54 | Reference | |||
| Stages III and IV | 25 | 2.178 (0.958–4.952) | 0.063 | 1.748 (0.563–5.430) | 0.334 |
| Histological grade | 72 | ||||
| G1 | 15 | Reference | |||
| G2 and G3 | 57 | 1.293 (0.434–3.851) | 0.645 | ||
| Smoker | 79 | ||||
| No | 27 | Reference | |||
| Yes | 52 | 1.661 (0.620–4.447) | 0.313 | ||
| Age | 82 | ||||
| ≤60 | 53 | Reference | |||
| >60 | 29 | 1.592 (0.676–3.749) | 0.288 | ||
| Gender | 82 | ||||
| Male | 70 | Reference | |||
| Female | 12 | 0.100 (0.013–0.756) | 0.026 | 0.000 (0.000-Inf) | 0.998 |
| BMI | 78 | ||||
| ≤25 | 60 | Reference | |||
| >25 | 18 | 1.066 (0.434–2.619) | 0.889 | ||
| Residual tumor | 71 | ||||
| R0 | 65 | Reference | |||
| R1 and R2 | 6 | 2.454 (0.804–7.489) | 0.115 | ||
| Reflux history | 67 | ||||
| No | 54 | Reference | |||
| Yes | 13 | 1.348 (0.524–3.469) | 0.536 | ||
| Alcohol history | 80 | ||||
| No | 19 | Reference | |||
| Yes | 61 | 3.087 (0.722–13.204) | 0.128 | ||
| SYNGR2 | 82 | ||||
| Low | 41 | Reference | |||
| High | 41 | 3.756 (1.546–9.128) | 0.003 | 3.309 (1.116–9.812) | 0.031 |
- Note: Values with p-value < 0.05 are in bold.
3.3 Validation using independent external databases and clinical specimens
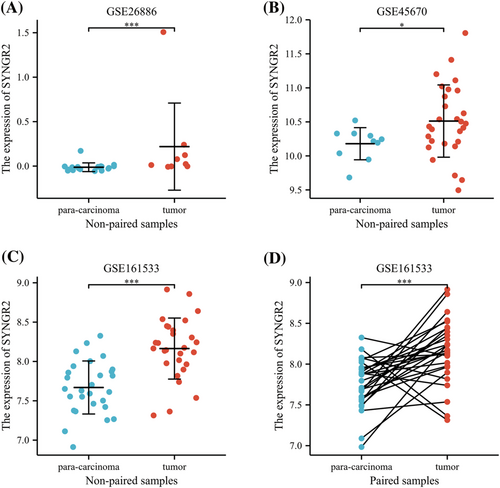
To further verify the expression level of SYNGR2 in ESCC, we selected another three independent external GEO datasets (validation cohort) to analyze the SYNGR2 transcription levels of cancer tissues and adjacent tissues in SYNGR2, including GSE26886, GSE45670 and GSE161533. The results showed that the transcription level of SYNGR2 in ESCC was significantly higher than that in non-cancerous adjacent tissues from ESCC datasets (GSE26886, GSE45670 and GSE161533, p < 0.001; Figure 2A–C). The results of this comparison were also verified in ESCC tissues and accurately matched non-cancerous tissues (GSE161533, p < 0.001; Figure 2D). These data verify that SYNGR2 is highly expressed in ESCC.
3.4 High expression of SYNGR2 is an independent prognostic factor for the overall survival of ESCC
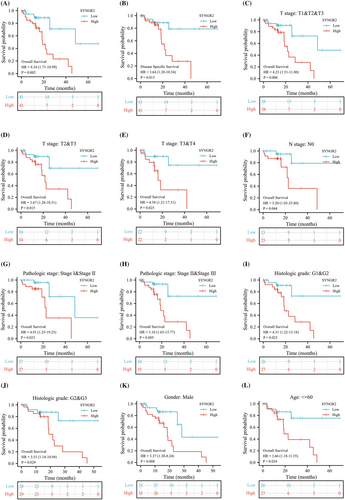
To identify whether SYNGR2 expression affects patient survival, we classified ESCC patients in the TCGA database into a high SYNGR2 expression group (the top 50% of samples with the highest expression) and a low SYNGR2 expression group (the remaining 50% of the samples) to perform survival analysis according to the mean expression value of SYNGR2. The Kaplan–Meier survival analysis showed that the high expression of SYNGR2 was related to the overall survival (HR = 4.34, p = 0.002) and disease-specific survival (HR = 3.64, p = 0.015) of ESCC patients (Figure 3A and B). Subgroup analysis showed that high SYNGR2 expression was significantly correlated with poor prognosis in ESCC in the following cases: T1, T2 and T3 stages, HR = 4.23, p = 0.006; T2 and T3 stages, HR = 3.67, p = 0.015; T3 and T4 stages, HR = 4.58, p = 0.025; N0 stage, HR = 5.20, p = 0.044; pathological stages I and II, HR = 4.91, p = 0.023; pathological stages II and III, HR = 5.10, p = 0.005; histological grades 1 and 2, HR = 4.31, p = 0.023; histological grades 2 and 3, HR = 3.53, p = 0.029; male sex, HR = 3.37, p = 0.008; and age ≤60 years old, HR = 3.66, p = 0.024. These data are shown in Figure 3C–L. Univariate Cox analysis demonstrated that high SYNGR2 expression was significantly correlated with poor OS (HR = 3.309, 95% CI = 1.126–9.812, p = 0.031; Figure 4, Table 3). These data suggest that high expression of SYNGR2 is an independent prognostic factor for the OS of ESCC patients.

3.5 Diagnostic value of SYNGR2 expression in ESCC
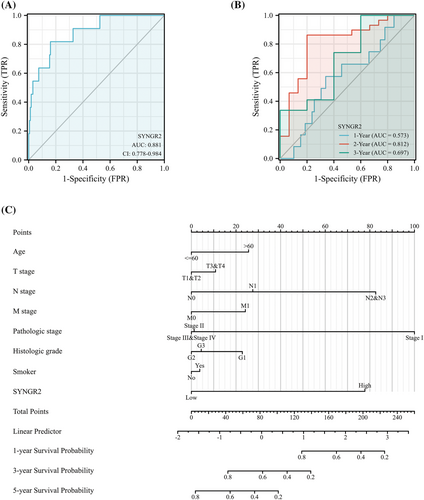
To analyze the diagnostic value of SYNGR2 expression in ESCC, we drew the ROC curve and performed nomogram analyses on the SYNGR2 gene expression data from the TCGA database to evaluate the diagnostic value of the gene. The area under the ROC curve (AUC) was 0.881, suggesting a higher diagnostic value, as shown in Figure 5A. A time-dependent survival ROC curve of SYNGR2 was created to predict the 1, 3 and 5 year survival rates. All of these AUC values were >0.55, which is considered suitable for prediction (Figure 5B). Then, we combined the expression level of SYNGR2 with the clinical variables to construct a nomogram to predict the survival probability of patients at 1, 3 and 5 years. The nomogram indicated that the prognostic prediction of the expression level of SYNGR2 was better than that of the traditional clinical features of age, T stage, M stage and histological grade (Figure 5C).
3.6 Functional enrichment and analyses of SYNGR2-related genes in ESCC
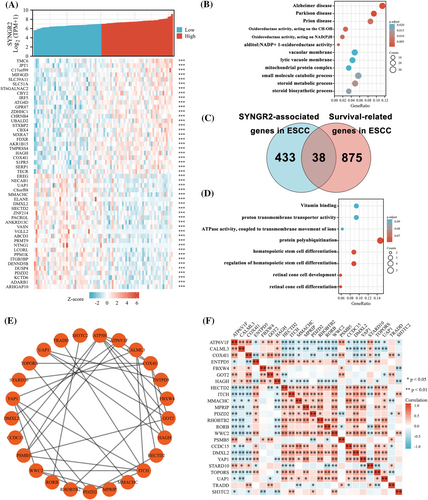
To understand the biological function of SYNGR2 in ESCC, we used the LinkFinder module of the LinkedOmics website to detect the coexpression pattern of SYNGR2 in ESCC in the TCGA database. The red dot indicates the top 25 genes that were positively correlated with SYNGR2, and the green dot represents the bottom 25 genes that were negatively correlated with SYNGR2 (Figure 6A). We used DAVID Functional Annotation Bioinformatics Microarray Analysis to identify the enriched GO functional enrichment and KEGG pathways among the SYNGR2-related genes (top 600) and found that the steroid metabolic process, small molecule catabolic process and steroid biosynthetic process were enriched among these genes (Figure 6B and Table 4). To identify genes with the same regulatory direction in high SYNGR2 and non-survival patients, we crossed the 471 genes (the absolute value of correlation coefficient ≥0.3) with the highest SYNGR2 correlation with the 913 survival-related upregulated genes (p Cox < 0.05) in ESCC and detected 38 genes at the intersection that were related to SYNGR2 and ESCC survival (Figure 6C). These 38 protein-coding genes may be potential genetic biomarkers for ESCC patients. GO functional enrichment and KEGG pathway analysis were performed for these 38 genes, and the results showed that differentially expressed genes were significantly enriched in retinal cone cell differentiation, retinal cone cell development and protein polyubiquitination (Figure 6D and Table 5). After discovering significantly different pathways, protein–protein interactions and correlated analysis were used to identify the interactions between these 38 proteins. We found that there was a stronger enrichment network among these proteins than in random proteins (Figure 6E). Gene coexpression correlation analysis showed that most of the proteins in the network had a strong positive correlation with each other (Figure 6F). Therefore, these SYNGR2-associated established genes have a strong intertwined interaction and can be used as multigene biomarkers to predict the survival of ESCC patients.
| Ontology | ID | Description | Gene ratio | Bg ratio | p-Value | p-Adjust | q-Value |
|---|---|---|---|---|---|---|---|
| BP | GO:0008202 | Steroid metabolic process | 26/528 | 331/18670 | 2.91 × 10⁻⁶ | 0.012 | 0.011 |
| BP | GO:0044282 | Small molecule catabolic process | 30/528 | 445/18670 | 1.11 × 10⁻⁵ | 0.017 | 0.016 |
| BP | GO:0006694 | Steroid biosynthetic process | 18/528 | 196/18670 | 1.22 × 10⁻⁵ | 0.017 | 0.016 |
| BP | GO:0010498 | Proteasomal protein catabolic process | 30/528 | 477/18670 | 4.12 × 10⁻⁵ | 0.042 | 0.041 |
| BP | GO:0031146 | SCF-dependent proteasomal Ubiquitin-dependent protein catabolic process | 11/528 | 95/18670 | 7.62 × 10⁻⁵ | 0.057 | 0.055 |
| CC | GO:0005774 | Vacuolar membrane | 27/558 | 412/19717 | 5.09 × 10⁻⁵ | 0.021 | 0.019 |
| CC | GO:0098852 | Lytic vacuole membrane | 24/558 | 355/19717 | 8.15 × 10⁻⁵ | 0.021 | 0.019 |
| CC | GO:0098798 | Mitochondrial protein complex | 19/558 | 262/19717 | 1.81 × 10⁻⁴ | 0.021 | 0.019 |
| CC | GO:0000152 | Nuclear ubiquitin ligase complex | 7/558 | 43/19717 | 1.86 × 10⁻⁴ | 0.021 | 0.019 |
| CC | GO:0005765 | Lysosomal membrane | 23/558 | 354/19717 | 2.04 × 10⁻⁴ | 0.021 | 0.019 |
| MF | GO:0016655 | oxidoreductase activity, acting on NAD(P)H, quinone or similar compound as acceptor | 10/530 | 60/17697 | 1.05 × 10⁻⁵ | 0.005 | 0.004 |
| MF | GO:0016616 | Oxidoreductase activity, acting on the CH-OH group of donors, NAD or NADP as acceptor | 14/530 | 119/17697 | 1.30 × 10⁻⁵ | 0.005 | 0.004 |
| MF | GO:0004032 | Alditol: NADP+ 1-oxidoreductase activity | 5/530 | 13/17697 | 2.49 × 10⁻⁵ | 0.005 | 0.005 |
| MF | GO:0016614 | Oxidoreductase activity, acting on CH-OH group of donors | 14/530 | 128/17697 | 3.00 × 10⁻⁵ | 0.005 | 0.005 |
| MF | GO:0016627 | Oxidoreductase activity, acting on the CH–CH group of donors | 9/530 | 58/17697 | 5.22 × 10⁻⁵ | 0.007 | 0.007 |
| KEGG | hsa05012 | Parkinson disease | 23/245 | 249/8076 | 1.72 × 10⁻⁶ | 4.73 × 10⁻⁴ | 4.35 × 10⁻⁴ |
| KEGG | hsa05010 | Alzheimer disease | 28/245 | 369/8076 | 6.23 × 10⁻⁶ | 8.60 × 10⁻⁴ | 7.90 × 10⁻⁴ |
| KEGG | hsa05020 | Prion disease | 21/245 | 273/8076 | 7.86 × 10⁻⁵ | 0.007 | 0.006 |
| KEGG | hsa05022 | Pathways of neurodegeneration—multiple diseases | 30/245 | 475/8076 | 9.78 × 10⁻⁵ | 0.007 | 0.006 |
| KEGG | hsa00190 | Oxidative phosphorylation | 13/245 | 133/8076 | 1.88 × 10⁻⁴ | 0.010 | 0.010 |
- Abbreviations: BP, biological process; Bg, background; CC, cellular component; ES, enrichment score; FDR, false discovery rate; KEGG, Kyoto Encyclopedia of Genes and Genomes; MF, molecular function; NOM, nominal. Gene sets with NOM p-value < 0.05 and FDR q-value < 0.25 were considered as significantly enriched.
| Ontology | ID | Description | Gene ratio | Bg ratio | p-Value | p-Adjust | q-Value |
|---|---|---|---|---|---|---|---|
| BP | GO:0042670 | Retinal cone cell differentiation | 2/34 | 11/18670 | 1.75 × 10⁻⁴ | 0.061 | 0.050 |
| BP | GO:0046549 | Retinal cone cell development | 2/34 | 11/18670 | 1.75 × 10⁻⁴ | 0.061 | 0.050 |
| BP | GO:0000209 | Protein polyubiquitination | 5/34 | 310/18670 | 2.29 × 10⁻⁴ | 0.061 | 0.050 |
| BP | GO:1902036 | Regulation of hematopoietic stem cell differentiation | 3/34 | 72/18670 | 3.02 × 10⁻⁴ | 0.061 | 0.050 |
| BP | GO:0060218 | Hematopoietic stem cell differentiation | 3/34 | 83/18670 | 4.59 × 10⁻⁴ | 0.063 | 0.051 |
| MF | GO:0015078 | Proton transmembrane transporter activity | 3/32 | 133/17697 | 0.002 | 0.093 | 0.066 |
| MF | GO:0044769 | ATPase activity, coupled to transmembrane movement of ions, rotational mechanism | 2/32 | 36/17697 | 0.002 | 0.093 | 0.066 |
| MF | GO:0019842 | Vitamin binding | 3/32 | 138/17697 | 0.002 | 0.093 | 0.066 |
- Abbreviations: BP, biological process; CC, cellular component; ES, enrichment score. Gene sets with NOM p-value < 0.05 and FDR q value < 0.25 were considered as significantly enriched.
3.7 Correlation of SYNGR2 expression with immune characteristics
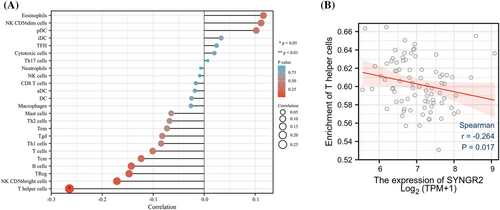
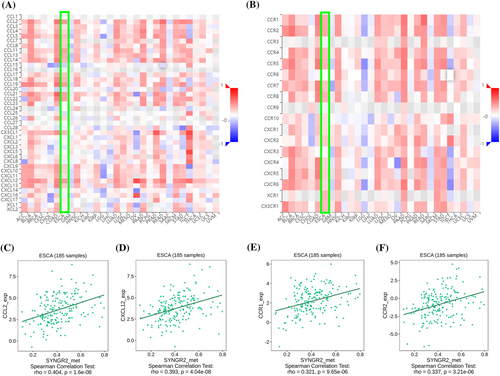
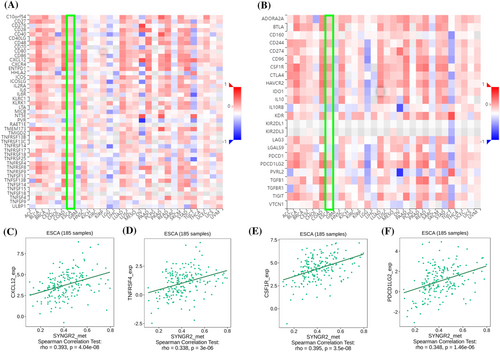
To explore the correlation between the expression level of SYNGR2 and the tumor immune response, we used the TIMER database to investigate immune infiltration in ESCC with different SYNGR2 expression levels. The expression of SYNGR2 was negatively correlated with T helper cells (Figure 7A). We further analyzed the correlation between the expression level of SYNGR2 and immune infiltration in ESCC, and the results showed that the expression level of SYNGR2 was negatively correlated with the infiltrating levels of T helper cells (r = −0.264, p = 0.017; Figure 7B). Therefore, we used TISIDB to analyze the correlation between the methylation level of SYNGR2 and immune cell chemokines and chemokine receptors in ESCC. The heatmap results showed that several chemokines and chemokine receptors were significantly correlated with the methylation level of SYNGR2 in ESCC (Figure 8A, B). These results demonstrate that SYNGR2 methylation may play an important role in tumor immunity. To further clarify the relationship between SYNGR2 methylation and immune cell migration, we comprehensively analyzed the correlation between SYNGR2 methylation and chemokine/chemokine receptors. The results showed that SYNGR2 methylation was positively correlated with CCL2 (r = 0.404, p < 1.6 × 10⁻⁸), CXCL12 (r = 0.393, p < 4.04 × 10⁻⁸), CCR1 (r = 0.321, p < 9.65 × 10⁻⁶) and CCR2 (r = 0.337, p < 3.21 × 10⁻¹⁴; Figure 8C–F). These data indicated that SYNGR2 methylation is positively correlated with the expression of chemokines/chemokine receptors in ESCC. Immune checkpoint inhibitors are a significantly novel strategy for tumor immunotherapy that has gradually improved the prognosis of patients with many types of cancers. Subsequently, we analyzed the correlation between SYNGR2 methylation and the expression of immunoinhibitors and immunostimulators in different types of human cancers using the TISIDB database (Figure 9A, B). Interestingly, SYNGR2 methylation was positively correlated with CCL12 (r = 0.393, p < 4.04 × 10⁻⁸), TNFRSF4 (r = 0.338, p < 3 × 10⁻⁶), CSF1R (r = 0.395, p < 3.5 × 10⁻⁸) and PDCD1LG2 (r = 0.348, p < 1.46 × 10⁻⁶) (Figures 9C–F). Therefore, these results suggest that SYNGR2 may play a role in regulating tumor immunity.
4 DISCUSSION
SYNGR2 plays an important role in biological processes such as cell exocytosis, the storage and transport of GLUT4 in the cytoplasmic membrane, and the formation and maturation of microvesicles in neuronal cells.16 A recent study indicated that SYNGR2 can be used as a promoter to enhance the infectivity of novel tick-borne bunyaviruses in humans.17 However, there are no reports of SYNGR2 in tumors. We integrated multiple bioinformatic analysis methods to determine the biological functions and potential regulatory pathways in ESCC. In this study, we first determined the expression and prognostic value of the SYNGR2 gene in cancer and found that the expression level of SYNGR2 was upregulated in ESCC. High SYNGR2 expression was associated with poorer OS in ESCC. Moreover, a high SYNGR2 expression level was associated with poorer T stage and poorer overall survival and disease-specific survival. In addition, we also found that SYNGR2 has an important reference value for the diagnosis of ESCC. These findings strongly suggest that SYNGR2 can be used as a biomarker for ESCC diagnosis and prognosis.
To explain the underlying molecular mechanism by which SYNGR2 affects ESCC prognosis, we defined 38 genes in the SYNGR2 gene network as our hub genes, which included 913 genes closely associated with ESCC prognosis and 471 genes with the highest correlation with SYNGR2 intersection. Then, we further analyzed the biological processes and signaling pathways of the hub genes using GO functional enrichment and KEGG pathway analyses. The enrichment results suggested that most of the hub genes were related to biological processes such as protein polyubiquitination. Protein polyubiquitination is a common biological process in cells, and a large number of studies have suggested that it plays an important role in the progression of ESCC.30, 31 A study indicated that the protein FLOT1 in ESCC cells promotes the recruitment of tumor necrosis factor-alpha receptors to lipid rafts, promotes polyubiquitination of tumor necrosis factor receptor-associated factor 2 and receptor-interacting proteins, and persists in activating NF-κB.32 Zhao et al. pointed out that the protein FAM175B inhibits ATF4 ubiquitination and promotes ESCC cell apoptosis in a p53-independent manner.33 Therefore, SYNGR2 may be involved in regulating ESCC progression by regulating protein polyubiquitination.
Numerous studies have pointed out that the development of cancer is closely related to the tumor microenvironment.34 The tumor microenvironment is composed of immune cells, extracellular matrix and inflammatory mediators, which interact with each other to promote the growth, survival and metastasis of tumor cells.35, 36 Although an effective immune response can produce antitumor effects, cancer cells can evade attack by immune cells through antigen presentation dysfunction and the recruitment of immunosuppressive cells.37, 38 Previous studies have reported that the degree of immune cell infiltration in tumors can affect the prognosis of patients, and the grade of tumor-infiltrating lymphocytes is an independent predictor of the prognosis of tumor patients.39, 40 This study explored the correlation between SYNGR2 expression and the level of immune infiltration in ESCC. Our results showed that the expression of SYNGR2 was negatively correlated with the infiltration level of T helper cells. Studies have shown that the frequency of Th cells in ESCC patients is significantly reduced, and the average expression of IFN-γ in Th cells is also greatly reduced, indicating that the dysregulation of Th-cell subsets contributes to the occurrence and development of ESCC.14, 41, 42 These findings suggest that SYNGR2 may play an important regulatory role in the tumor immune microenvironment and ESCC development.
Chemokines and their receptors play an important role in the directed migration of immune cells. In this study, the TISIDB database was used to analyze the correlation between the methylation level of SYNGR2 and the expression of immune cell chemokines and chemokine receptors in ESCC. The results showed that the methylation level of SYNGR2 was positively correlated with the expression of CCL2, CXCL12, CCR1 and CCR2, suggesting that the methylation of SYNGR2 may inhibit the migration of immune cells to the tumor microenvironment. The CCL2–CCR2 axis, one of the major chemokine signaling pathways, increases tumor cell proliferation and invasiveness during tumor progression and creates the tumor microenvironment by increasing angiogenesis and recruitment of immunosuppressive cells.43-45 The interaction of CXCL12 and its receptor CXCR4 stimulates downstream signaling pathways, which affect tumor angiogenesis, tumor cell proliferation and chemotherapy resistance.46-48 In addition, studies have pointed out that CCL3/CCR1 can promote the chemotaxis of monocytes in tumors and affect tumor angiogenesis and cell proliferation.49, 50 This may explain the mechanism by which SYNGR2 regulates immune infiltration in ESCC.
In conclusion, our study found that the expression of SYNGR2 was significantly upregulated and closely related to the poor prognosis of ESCC patients. SYNGR2 has a certain reference value for the diagnosis and prognosis of ESCC. SYNGR2 may affect ESCC progression through immune infiltration and it could serve as a novel premarker for ESCC patients.
However, even though we systematically analyzed SYNGR2 and performed cross-validation using different databases, this study has limitations. First, the role of SYNGR2 in ESCC may vary in the reproducibility of microarray data generated by different laboratories. Second, we need in vivo and in vitro experiments to demonstrate the effect of SYNGR2 on ESCC to increase the reliability of our results. Third, our results show that the AUC area of SYNGR2 is 0.881, indicating that SYNGR2 has a good diagnostic effect on esophageal cancer. At present, the relevant experiments for detecting SYNGR2 in peripheral blood and liver tissues are in progress, and the relevant research results will be published in the follow-up research reports. Finally, although we concluded that SYNGR2 is closely associated with immune infiltration and prognosis in ESCC, we lack direct evidence that SYNGR2 affects prognosis through its involvement in immune infiltration. We will further explore these questions in future experiments.
ACKNOWLEDGEMENTS
This study was supported by Science and Technology Key Research and Development Program of Gansu Province (no. 20YF3FA032) and Key Talent Project of Gansu Province (no. Gan Zu Tong Zi (2021) 17 Hao).
CONFLICT OF INTEREST
The authors declare that they have no competing interests.
AUTHOR CONTRIBUTIONS
B.L., MY.R., YZ.C. and YQ.M. wrote the main manuscript text and prepared Figures 1-9, B.L., TN.S., ZP.S. and B.Y. prepared Tables 1–5. All authors reviewed the manuscript.
Open Research
DATA AVAILABILITY STATEMENT
All datasets used and/or analyzed during the current study are available from the public database.


