Long non-coding RNA SNHG1 activates glycolysis to promote hepatocellular cancer progression through the miR-326/PKM2 axis
Funding information: Department of Science and Technology of Jilin Province; Graduate Innovation Fund of Jilin University; National Natural Science Foundation of China; Norman Bethune Program of Jilin University
Abstract
Background
Hepatocellular cancer (HCC) is a lethal malignancy with extremely poor prognosis. In the present study, we aimed to investigate the role and underlying mechanism of SNHG1 in HCC progression.
Methods
Combined with bioinformatics and experimental validation, we explored the clinical significance of SNHG1 in HCC. A Cell Counting Kit-8 assay, cell colony formation assay, and subcutaneous tumorigenesis experiments of nude mice were conducted to evaluate the pro-proliferative capacity of SNHG1. Glucose consumption and lactate production were measured to explore the regulatory role of SNHG1 in glycolysis. Nuclear-cytoplasmic separation, quantitative real-time polymerase chain reaction and Western blot assays, chromatin immunoprecipitation, and luciferase reporter and RNA immunoprecipitation assays were performed to investigate the molecular mechanisms of SNHG1 in HCC.
Results
SNHG1 expression was dramatically increased in HCC and positively correlated with poor prognosis. E2F1 bound to the SNHG1 promoter region to activate SNHG1 transcription. Furthermore, SNHG1 served as a molecular sponge for miR-326 to sequester the interaction of miR-326 and pyruvate kinase M2 (PKM2), facilitating the expression of PKM2. Activating PKM2 expression was revealed to be one of mechanisms of SNHG1 with respect to promoting glycolysis and the proliferation of HCC cells.
Conclusions
E2F1-activated SNHG1 modulates the miR-326/PKM2 axis to facilitate glycolysis and the proliferation of HCC cells. Targeting SNHG1 could be a promising therapeutic option for HCC.
1 INTRODUCTION
Hepatocellular cancer (HCC) is an aggressive human malignant tumor originating from liver parenchymal cells. As the most prevalent histological subtype of primary liver cancer, HCC poses a serious threat to global public health.1 According to global cancer statistics in 2020, liver cancer ranks sixth and third in cancer-related incidence and mortality worldwide, respectively.2 Although great technological advances in cancer treatment, the 5-year overall survival (OS) rate of HCC patients remains low because of difficulties in early detection, rapid progression, and deficiency of effective therapeutic targets.3, 4 Thus, a better understanding of the underlying mechanisms of tumorigenesis and progression of HCC would facilitate to develop effective targets for its diagnosis and therapeutic inventions.
Long non-coding RNAs (lncRNAs) are a type of nucleotides transcripts with length more than 200 nucleotides and limited protein-coding potential.5 Recently, increasing lncRNAs have been reported to be implicated in the tumorigenesis of HCC. For example, GMAN, LINC00662, and HULC have been identified as oncogenes to facilitate HCC progression.6-8 Conversely, ID2-AS1, RUNX1-IT1, and Linc00261 serve as tumor suppressors to inhibit HCC pathogenesis.9-11 However, specific biological functions and molecular mechanisms of the vast majority of lncRNAs in the occurrence and progression of HCC remain largely unknown.
Metabolic reprogramming is an essential hallmark of cancer cells, in which the glycolysis level is boosted to support sufficient energy and material for the fast-growing tumor cells.12 Multiple lncRNAs have been reported to play pivotal roles in cell glycolysis through modulating glycolytic transporters and enzymes, as well as various glycolysis-related genes and signaling pathways. For example, lncRNA SLC2A1-AS1 suppresses cell glycolysis of HCC through inactivating GLUT1, whereas lncRNA SOX2OT promotes cell glycolysis and metastatic potential of HCC through upregulating pyruvate kinase M (PKM) 1/2 expression.13, 14 Moreover, lncRNA MALAT1 facilitates TCF7L2 translation and thus enhances glycolysis.15 These extensive connections between lncRNAs and cell glycolysis suggest that glycolysis-related lncRNAs may be effective therapeutic targets for HCC patients with respect to reversion metabolic reprogramming.
In the present study, we compared the genome-wide lncRNA expression profile between adjacent normal and tumor tissues of HCC, from which we observed the majority of snoRNA Host Genes (SNHGs), an emerging class of lncRNAs with pro-tumorigenic roles, were significantly upregulated in HCC tissues. Currently, studies focusing on the relationships between SNHGs and HCC are limited. Especially, the roles and molecular mechanisms of SNHG1 in the progression of HCC have not been fully elucidated. Thus, we validated that the expression of SNHG1 was drastically elevated in HCC tissues and could be a risk indicator for HCC patients. We then demonstrated that SNHG1 expression in HCC was activated by E2F1. The oncogenic roles of SNHG1 in hepatocellular carcinogenesis were genetically confirmed both in vitro and in vivo. Moreover, we validated that SNHG1 activated glycolysis to promote the proliferation of HCC cells. More importantly, we found that SNHG1 exerted its effect on glycolysis via upregulating PKM2 expression. PKM2, the dominant isoform of pyruvate kinase in HCC cells, converts phosphoenolpyruvate to pyruvate as the final step of glycolysis, which is essential for aerobic glycolysis in cancer cells.16 Mechanistically, we confirmed that PKM2 was a target of miR-326. SNHG1, acting as a competitive endogenous RNA, bound to miR-326 to hinder its interaction with PKM2, facilitating PKM2 expression and thereby increasing glycolysis levels and promoting the proliferation of HCC cells. All of these results suggest that SNHG1 is a promising prognostic and therapeutic target for HCC patients.
2 MATERIALS AND METHODS
2.1 Data acquisition and bioinformatic analysis for HCC
The gene expression profile of HCC patients were downloaded from the TCGA data portal (https://portal.gdc.cancer.gov) (i.e., TCGA-LIHC).17 Differential expression analysis was performed using DESeq2 package of R, version 3.6.1 (R Foundation, Vienna, Austria), with absolute of log2foldchange (|log2FC|) > 1 and p < 0.05 as threshold. A total of 15,830 lncRNAs were annotated based on the ENSEMBL genome database (http://ftp.ensembl.org/pub/release-101/gtf/homo_sapiens). A list of 318 tumor-related transcription factors was obtained from the Cistrome Cancer website (http://cistrome.org/CistromeCancer). In addition, 200 glycolysis-related genes were obtained from HALLMARK_GLYCOLYSIS of the Molecular Signature Database (MSigDB, http://www.gsea-msigdb.org/gsea/msigdb/search.jsp). Differentially expressed lncRNAs, transcription factors, and glycolysis-related genes were respectively screened out from the results of differential expression analysis. The gene expression profile of GSE84402 (consisting of 14 pairs hepatocellular cancer tissues and corresponding non-cancerous tissues) and GSE76427 (consisting of 115 primary HCC tissues and 52 non-tumor tissues samples) datasets were downloaded from Gene Expression Omnibus (GEO) (https://www.ncbi.nlm.nih.gov/geo) database via the “GEOquery” R package. The expression levels of SNHG1 between non-cancerous and HCC tissues of TCGA and GSE84402 were compared using Wilcoxon signed-rank tests. With the median value of SNHG1 expression as cut-off, samples of GSE76427 were classified into high-SNHG1 and low-SNHG1 subgroups to perform Gene Set Enrichment Analysis (GSEA) using GSEA, version 4.0.1.18
2.2 Tissue cDNA microarrays
Human tissues cDNA microarrays consisting of 30 pairs of adjacent normal and HCC tissues (LncDNA-HLivH060PG02) were purchased from Outdo Biotech (Shanghai, China). All sample donors provided informed consent and the study was approved by the China Ethical Review Committee. Detailed clinical characteristics of sample donors are listed in the Supporting information (Table S1).
2.3 Cell lines and culture condition
Human hepatocellular cancer cell lines (HepG2, SMMC-7721, Huh7, and Hep3B), and the human normal hepatic cell line (LO2) were purchased from the cell bank of Shanghai Institute of Life Sciences (China). These cells were cultured in Dulbecco's modified Eagle's medium (Gibco, Waltham, MA, USA) adding 10% fetal bovine serum (Kimberly-Clark, Dallas, TX, USA) and 1% penicillin–streptomycin (100 U/mL penicillin and 0.1 mg/ml streptomycin (Beijing Dingguo Changsheng Biotechnology, China). All cells were maintained in the incubator with 90% relative humidity and 5% CO2 at 37°C.
2.4 Quantitative real-time polymerase chain reaction analysis (qRT-PCR)
Cultured cells were collected using RNAiso Plus (Takara, Beijing, China) and total RNAs were extracted in accordance with the manufacturer's instructions. The RNA concentration and purity were determined by ultraviolet spectrophotometry (Eppendorf, Hamburg, Germany). mRNAs, lncRNAs and miRNAs were reverse-transcribed to cDNA using PrimeScript RT Master Mix (Takara) in accordance with the manufacturer's instructions. Then, cDNA was diluted 1:30 with diethylpyrocarbonate (DEPC) water (Beyotime, Shanghai, China) for subsequent qRT-PCR analysis. A total of 20 μl of reaction system consisting of 2 μl of cDNA template, 0.8 μl of forward primer, 0.8 μl of reverse primer, 10 μl of FastStart Universal SYBR Green Master (Vazyme, Nanjing), and 6.4 μl of DEPC water was constructed. Next, qRT-PCR was conducted on the CFX96 machine (Bio-Rad, Hercules, CA, USA), setting qRT-PCR conditions as: 95°C for 5 min; 40 cycles of 95°C for 15 s, 57°C for 30 s, and 72°C for 30 s; 95°C for 15 s, 60°C for 1 min, and 95°C for 15 s. The relative quantification of mRNA (E2F1 and PKM2) and lncRNA (SNHG1) was determined using the 2−ΔΔct approach, with GAPDH as the internal reference. Similarly, the relative quantification of miR-326 was determined using the 2−ΔΔct approach, with U6 as the internal reference. The primers for qRT-PCR were purchased from ShengGong BioTech (Shanghai, China), with the detailed sequences: SNHG1, (forward) 5′-GCCAGCACCTTCTCTCTAAAGC-3′ and (reverse) GTCCTCCAAGA CAGATTCCATTTT; E2F1, (forward) 5′-TCCAGACCATTAACCTCAGTGC-3′ and (reverse) 5′-TGTATTCCATCACCACCAGCC-3′; PKM2, (forward) 5′-TCCAAACTCAAAGAGACCAGC-3′ and (reverse) 5′-TTCCACTTCAACTTCCCCAG-3′; GAPDH, (forward) 5′-GGGAGCCAAAAGGGTCATCA-3′ and (reverse) 5′-TGAT GGCATGGACTGTGGTC-3′. In addition, the qRT-PCR primers of miR-326 (hsa-miR-326 Primer Set) and U6 (Bulge-Loop U6 qPCR Primer Set) were purchased from RiboBio (RiboBio, Guangzhou, China).
2.5 Plasmid construction and cell transfection
Full-length complementary cDNA of human E2F1 and SNHG1 was synthesized and cloned into the expression vector pcDNA3.1 to overexpress E2F1 and SNHG1, respectively, with empty plasmid of pcDNA3.1 as control (GenePharma, Shanghai, China). The small hairpin RNAs (shRNA) of SNHG1 (SNHG1 shRNA1 and SNHG1 shRNA2) were synthesized and cloned into the pLVX-shRNA1 vector (GeneCreat, Wuhan, China). E2F1 siRNA, SNHG1 siRNAs (SNHG1 siRNA1 and SNHG1 siRNA2) and PKM2 siRNA were synthesized by GenePharma to inhibit the expression of E2F1, SNHG1 and PKM2 respectively, with the Negative Control (NC) sequence as control. The siRNA and shRNA sequences are listed in the Supporting information (Table S2). The inhibitor and mimics of miR-326 were synthesized by GenePharma for silencing and overexpression of miR-326. HepG2 and SMMC-7721 cells were grown to 80% confluence before being transiently transfected using Lipofectamine 2000 (Invitrogen, Waltham, MA, USA), in accordance with the manufacturer's instructions.
2.6 Western blotting
In accordance with the manufacturer's instructions, total proteins were extracted from cultured cells using radio-immunoprecipitation assay lysis buffer (Sigma, St Louis, MO, USA) mixed with proteinase and phosphatase inhibitors (Thermo Fisher Scientific, Waltham, MA, USA). The concentrations of protein were measured using a Pierce™ BCA protein assay kit (Thermo Fisher Scientific). Then, protein samples with the same quantity were separated by 10% sodium dodecyl sulfate-polyacrylamide gel electrophoresis and then transferred to polyvinylidene difluoride membranes (Millipore, Burlington, MA, USA). The membranes containing proteins were blocked with 5% non-fat milk in Tris-buffered saline-Tween 20 at room temperature for 4 h, followed by incubation with specific primary antibodies secondary antibodies overnight at 4°C and secondary antibodies for 2 h at room temperature. Then, protein signals were detected by enhanced chemiluminescence kit and visualized using the Image Quant LAS 4000 digital imaging system (GE Healthcare Life Sciences, Piscataway, NJ, USA). Protein expression was normalized to GAPDH. The primary antibodies were provided as: PKM2 (dilution 1:1000; 15822-1-AP; Proteintech, Rosemont, IL, USA) and GAPDH (dilution 1:2000; 10494-1-AP; Proteintech).
2.7 Chromatin immunoprecipitation (ChIP) assay
The binding sites of E2F1 on the promoter region of SNHG1 were predicted using the JASPAR database (http://jaspar.genereg.net).19 The ChIP assay was carried out using an EpiQuik Chromatin Immunoprecipitation Kit (Epigentek, Farmingdale, NY, USA) in accordance with the standard procedure. HepG2 cells cultured on a 10-cm dish were cross-linked with 1% formaldehyde solution for 10 min and quenched with 125 mm glycine for 5 min at room temperature. DNA fragments ranging from 200 to 500 bp were yielded via sonication. Then the lysates were immunoprecipitated with E2F1 antibody (dilution 1:100; 66515-1-Ig; Proteintech), with immunoglobin (IgG) antibody as NC. Primers of specific SNHG1 promoter sequences containing E2F1 binding sites (−600 bp to +150 bp relative to the transcription start site [TSS] of SNHG1) were designed for the qRT-PCR assay of the immunoprecipitated DNA sequences. The corresponding primers were: forward: 5′-CGTGG TAAGTGGCT TCGTGGTC-3′; reverse: 5′-CCAGGCAGCTACAACACAGAAGG-3′.
2.8 Luciferase reporter assay
2.8.1 SNHG1 promoter luciferase reporter assay
The promoter segments of SNHG1 containing E2F1 binding sites (−600 to +150 bp, −200 bp to −100 bp, −500 bp to −400 bp, and −600 bp to −500 bp relative to the TSS of the SNHG1) were respectively synthesized and cloned into the firefly luciferase GPL4-basic vector (GenePharm). The pRL-TK vector carrying Renilla luciferase (Promega, Madison, WI, USA) was designed as internal control. HepG2 cells were plated in 24-well plates and cotransfected with GPL4-SNHG1 (with GPL4-basic as control), pRL-TK vector and pcDNA3.1-E2F1 (with pcDNA3.1 as control). After 24 h, luciferase activity was measured using a Dual Luciferase Assay system (Promega). Renilla luciferase activity was normalized using a firefly luciferase activity.
2.8.2 miR-326-targeted genes luciferase reporter assays
The miRNAs that potentially target SNHG1 were predicted using miRNA-lncRNA module of the ENCORI database (http://starbase.sysu.edu.cn).20 The miRNAs targeting 3′ UTR of PKM2 were obtained from miRWalk 3.0 (http://mirwalk.umm.uni-heidelberg.de). The binding sites of miR-326 on SNHG1 or 3′ UTR of PKM2 were predicted by the ENCORI database. The segments of SNHG1 or PKM2 3′ UTR containing predicted microRNA binding sites (wild-type) or mutated microRNA binding sites (mutant type) were respectively synthesized and inserted into the pmirGLO luciferase vector (GenePharma). Wild-type/mutant vector and the miR-326 mimics/NC were co-transfected into HepG2 cells. Twenty-four hours later, luciferase activity was determined using the Dual Luciferase Assay system (Promega). Renilla luciferase activity was normalized to firefly luciferase activity.
2.9 Cell proliferation assays (Cell Counting Kit-8 [CCK-8] and cell colony formation assays)
For CCK8 assays, transfected cells were seeded into 96-well plates at the density of 1 × 10³ cells per well. Then, absorbance at 450 nm of cells treated with 10 μl of CCK-8 solution was determined on days 1, 2, 3, and 4 . For cell colony formation assays, 24 hours after transfection, cells were resuspended in a single-cell suspension and cultured in six-well plates for approximately 2 weeks. Then, the cells were stained with crystal violet (0.2%) for 30 min and colony numbers were counted using ImageJ (NIH, Bethesda, MD, USA).
2.10 Xenograft mouse model
Five-week-old SPF-grade Balb/c female nude mice were randomly divided into the following groups: pLVX-sh-SNHG1 group that silences SNHG1 and its control pLVX-shRNA1 group, and pcDNA3.1-SNHG1 group that upregulates SNHG1 and its control pcDNA3.1 group (n = 6 mice per group). Each group of nude mice was injected with HepG2 cells (2 × 10⁶) transfected with the corresponding vectors on the inside of their front legs. Four weeks later, the mice were humanly sacrificed and tumors were excised, photographed, and weighed. We calculated the volume of tumors as: V = (width2 × length)/2. Then, these tumor samples were embedded in paraffin for immunohistochemistry staining with Ki67 antibody (dilution 1:400; WL03319; Wanlleibio, Wanlei, Shenyang, China) to assess the proliferation of tumor cells. The experiments on animals were conducted with approval (2019-31) of the Animal Research Ethics Committee of Jilin University.
2.11 Subcellular fractionation location
The subcellular localization of SNHG1 in various cancer cells was predicted by lncATLAS (http://lncatlas.crg.eu). Furthermore, HepG2 and SMMC-7721 cells were collected and separated into nuclear and cytoplasmic fraction using a PARISTM Kit (Invitrogen). In accordance with the operating instructions, Cell Fractionation Buffer and Cell Disruption Buffer were added to obtain cytoplasmic and nuclear separation products. The cytoplasm and nucleus separation products were lysed, filtered, and eluted to obtain RNA in cytoplasm and nucleus, respectively. The expression of SNHG1 in in cytoplasm and nucleus was detected by qRT-PCR, with GAPDH and U6 as the cytoplasmic and nuclear markers respectively.
2.12 RNA immunoprecipitation (RIP) assay
The EZ Magna RNA immunoprecipitation Kit (Millipore, USA) was used following the instruction of manufacturer. HepG2 cells were lysed in RIP lysis buffer. Magnetic beads were pre-incubated with AGO2 antibody (dilution 1:500; 10686-1-AP; Proteintech) for 30 min at room temperature, with IgG antibody as NC. Then, the cell lysates were immunoprecipitated with beads for 6 h at 4°C. After RNA purification, the relative contents of SNHG1 or PKM2 were detected by qRT-PCR.
2.13 Assessment of glucose consumption and lactate production
Cells were seeded into six-well plates and transfected with indicated siRNAs or vectors. After 48 h, the culture medium was collected to evaluate the level of glucose consumption and lactate production in different treated groups. Moreover, the concentrations of total proteins extracted from cultured cells were measured using Pierce™ BCA protein assay kit (Thermo Fisher Scientific). The glucose assay kit (Rongsheng Biotech, Shanghai, China) was used for measurement of glucose concentrations in accordance with the manufacturer's instructions. Glucose consumption was calculated by deducting the glucose concentration of the culture medium collected above from the glucose concentration of the original culture medium. The glucose consumption of each group was calibrated by the total protein concentration of their corresponding treated group. The LA Assay Kit (Solarbio, Beijing, China) was used to measure the lactate production of different treated groups in accordance with the manufacturer's instructions. Similarly, the results of lactate production were also normalized by total protein concentrations.
2.14 Statistical analysis
All the experiments were conducted independently at least three times. The results are presented as the mean ± SD and analyzed using SPSS, version 19.0 (IBM Corp., Armonk, NY, USA), R, version 3.6.1 (R Foundation), or Prism, version 6.05 (GraphPad Software Inc., San Diego, CA, USA). A chi-squared test or Fisher's exact test was performed to assess the relationships between SNHG1 and the clinicopathological features of HCC patients. A Shapiro–Wilk normality test was applied to test normal distribution of continuous variables. Student's t-test and a Wilcoxon rank sum test or Wilcoxon signed rank test (for paired samples) were used as needed to compare the difference between continuous variables. Differences in OS and progress-free interval (PFI) between different groups were estimated by the Kaplan–Meier method and a log-rank test using the “survminer” R package. The time-dependent receiver operating characteristic (ROC) curve at 1, 3, 5 years was delineated using the “timeROC” R package to calculate the corresponding area under the curve (AUC). Univariate and multivariate Cox proportional hazards regression analyses were applied to evaluate the independence of SNHG1 as the prognostic indicator for HCC. Pearson's correlation analysis was applied to analyze the correlations between the expression patterns of specific genes. p < 0.05 (two-sided) was considered statistically significant.
3 RESULTS
3.1 SNHG1 is upregulated in HCC and predicts poor prognosis
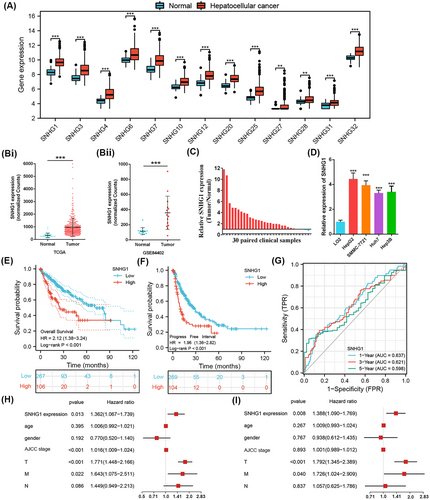
We identified 3898 differentially expressed lncRNAs in 362 HCC tissues compared to 49 adjacent non-cancerous tissues (|log2FC| > 1 and p < 0.05), of which 3055 were upregulated and 843 were downregulated (see Supporting information, Figure S1a, b). We noted that the majority of SNHGs were significantly upregulated in HCC tissues (Figure 1A). The upregulation of SNHG1 expression in HCC was validated via TCGA (p < 0.001) (Figure 1B-i) and GSE84402 (p < 0.001) (Figure 1B-ii). Likewise, we observed the upregulation of SNHG1 both at tissue and cellular levels by qRT-PCR (p < 0.001) (Figure 1C, D). To confirm the oncogenic role of SNHG1 in HCC, we analyzed the relationships between SNHG1 expression and clinic-pathological characteristics of HCC patients. Results indicated that high SNHG1 expression might predict lower age at diagnosis (p < 0.001), higher AFP level (p < 0.001), and higher tumor grade (p < 0.001) (Table 1). In addition, Kaplan–Meier analysis indicated that HCC patients with higher SNHG1 expression exhibited a shorter OS time and PFI (p < 0.001 for OS; p < 0.001 for PFI) (Figure 1E, F). Meaningfully, time-dependent ROC analysis validated the promising predictive potential of SNHG1, with 1-year AUC = 0.637, 3-years AUC = 0.621, 5-years AUC = 0.598 (Figure 1G). Univariate Cox regression analysis demonstrated that SNHG1 expression (p = 0.013), American Joint Committee on Cancer (i.e., AJCC) stage (p < 0.001), T stage (p < 0.001), and M stage (p = 0.022) were closely associated with the prognosis of HCC patients (Figure 1H). Multivariate Cox regression analyses identified SNHG1 expression (p = 0.008), T stage (p < 0.001), and M stage (p = 0.04) as independent predictors for the prognosis of HCC patients (Figure 1I). The above results validated the clinical significance of SNHG1 in HCC. Thus, SNHG1 was identified as the target of our interest in the following studies.
| Clinical characteristics | Variables | Number of patients (n = 358) | SNHG1 expression | p | |
|---|---|---|---|---|---|
| Low (n = 179) | High (n = 179) | ||||
| Gender | male | 242 | 125 | 117 | 0.366 |
| female | 116 | 54 | 62 | ||
| Age at diagnosis (years) | ≤ 60 | 173 | 70 | 103 | < 0.001* |
| > 60 | 185 | 109 | 76 | ||
| AFP (ng/ml) | ≤ 400 | 208 | 123 | 85 | < 0.001* |
| > 400 | 63 | 11 | 52 | ||
| NA | 87 | 45 | 42 | ||
| Tumor grade | G1 + G2 | 224 | 134 | 90 | < 0.001* |
| G3 + G4 | 129 | 41 | 88 | ||
| NA | 5 | 4 | 1 | ||
| AJCC TMN stage | I–II | 248 | 125 | 123 | 0.238 |
| III–IV | 86 | 37 | 49 | ||
| NA | 24 | 17 | 7 | ||
| Tumor invasion depth | T1 + T2 | 265 | 135 | 130 | 0.377 |
| T3 + T4 | 90 | 41 | 49 | ||
| NA | 3 | 3 | 0 | ||
| Lymph node metastasis | M0 | 258 | 119 | 139 | 1.000 |
| M1 | 4 | 2 | 2 | ||
| Mx | 96 | 58 | 38 | ||
| Distant metastasis | N0 | 243 | 114 | 129 | 0.377 |
| N1 | 3 | 1 | 4 | ||
| Nx | 112 | 64 | 46 | ||
| Vascular invasion | Yes | 102 | 46 | 56 | 0.194 |
| No | 110 | 106 | 94 | ||
| NA | 56 | 27 | 29 | ||
| No | 169 | 84 | 85 | ||
| NA | 96 | 61 | 35 | ||
- HCC, hepatocellular cancer; AFP, alpha-fetoprotein; AJCC, American Joint Committee on Cancer.
3.2 E2F1 activates SNHG1 transcription in HCC cells
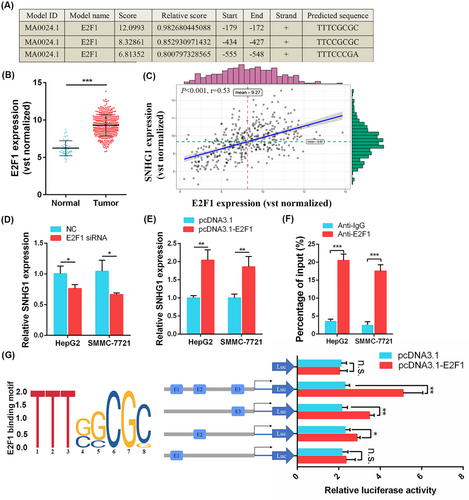
Transcription factors are critical regulators of lncRNAs. To explore transcription factors involved in the upregulation of SNHG1 in HCC, we obtained a list of 318 tumor-related transcription factors from the Cistrome Cancer website (http://cistrome.org/CistromeCancer) and screened out 16 differentially expressed transcription factors between normal and HCC tissues, of which nine were upregulated (MYBL2, NCAPG, E2F1, FOXM1, CENPA, ARID3A, EZH2, SALL4, H2AFX) and eight were downregulated (TAT, ESR1, AR, FOS, NR4A1, EGR1, EGR2) in HCC (|log2FC| > 1 and p < 0.05) (see Supporting information, Figure S2a and Table S3). Among the top three upregulated transcription factors, only E2F1 was predicted by the JASPAR database to bind to the promoter region of SNHG1. There are putative E2F1-binding sites at −555 bp to −548 bp (E1), −434 bp to −427 bp (E2), and −179 bp to −172 bp (E3) regions of TSS of SNHG1 (Figure 2A). E2F1 was dramatically overexpressed in HCC tissues (p < 0.001) (Figure 2B) and positively correlated with SNHG1 expression in HCC (r = 0.53, p < 0.001) (Figure 2C). Then, we investigated whether the overexpression of SNHG1 was attributed to E2F1 through knockdown and overexpression of E2F1. The efficiencies of knockdown and overexpression of E2F1 were confirmed by qRT-PCR (knockdown of E2F1 in HepG2: p < 0.01; knockdown of E2F1 in SMMC-7721: p < 0.01; overexpression of E2F1 in HepG2: p < 0.001; overexpression of E2F1 in SMMC-7721: p < 0.01) (see Supporting information, Figure S2b, c). We observed that knockdown of E2F1 reduced SNHG1 expression, whereas ectopic expression of E2F1 upregulated SNHG1 expression in HepG2 and SMMC-7721 cells (Figure 2D, E). The ChIP assay demonstrated E2F1 interacted with the promoter region of SNHG1 directly (p < 0.001) (Figure 2F). To examine whether E2F1 activates SNHG1 expression through interacting with the promoter region of SNHG1 and inducing SNHG1 transcription activation, we respectively cloned the human SNHG1 promoter fragments of nucleotides −600 bp to +150 bp, nucleotides −200 bp to −100 bp (only including E3), nucleotides −500 bp to −400 bp (only including E2), and nucleotides −600 bp to −500 bp (only including E1) into pGL4 vector for luciferase activity assays. SNHG1 transcriptional activity was drastically induced by overexpression of E2F1 except for the pGL4 vector carrying E1 sites only, indicating that SNHG1 transcription was mainly activated by E2F1-binding motif E2 and E3 but not E1 (NC: p = 0.758, all: p = 0.008, E3: p = 0.003, E2: p = 0.023, E1: p = 0.587) (Figure 2G). Overall, these results suggest that E2F1 activates SNHG1 transcription and promotes its expression in HCC.
3.3 SNHG1 is an oncogenic lncRNA in HCC
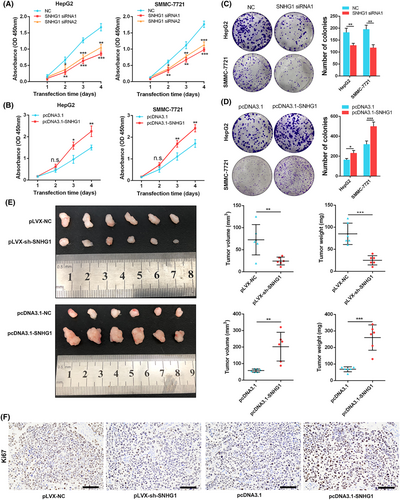
We transfected SNHG1 siRNAs (SNHG1 siRNA1 and SNHG1 siRNA2) and pcDNA3.1-SNHG1 into HepG2 and SMMC-7721 cells to respectively knockdown and upregulate SNHG1 expression. Their knockdown and overexpression efficiencies were validated by qRT-PCR (knockdown of SNHG1 in HepG2: p < 0.05; knockdown of SNHG1 in SMMC-7721: p < 0.001; overexpression of SNHG1 in HepG2: p < 0.01; overexpression of SNHG1 in SMMC-7721: p < 0.001) (see Supporting information, Figure S2d, e). Then, CCK8 and cell colony formation assays were conducted and demonstrated that knockdown of SNHG1 dramatically inhibited proliferation of HepG2 and SMMC-7721 cells, whereas upregulation of SNHG1 expression significantly facilitated the proliferation of HepG2 and SMMC-7721 cells (p < 0.05) (Figure 3A-D). Furthermore, we evaluated the effect of SNHG1 on progression of HCC in vivo. Here, pLVX-sh-SNHG1 (pLVX-NC as control) and pcDNA3.1-SNHG1 (pcDNA3.1 as control) were transfected into HepG2 cells for knockdown and overexpression of SNHG1 respectively, confirming their corresponding efficiencies by qRT-PCR (knockdown of SNHG1 in HepG2: p < 0.01; overexpression of SNHG1 in HepG2: p < 0.001) (Figure S2f). Likewise, knockdown of SNHG1 significantly reduced tumor growth and tumor weight, whereas overexpression of SNHG1 increased tumor growth and tumor weight in xenograft mouse tumor models (p < 0.05) (Figure 3E). Correspondingly, tumor tissues collected from SNHG1 knockdown group exhibited lower Ki67-positive rates, whereas SNHG1 overexpression exhibited higher Ki67-positive rates compared to their corresponding control group (Figure 3F). Collectively, these results indicate SNHG1 promotes cell proliferation of HCC both in vitro and in vivo.
3.4 SNHG1 activates cell glycolysis to exert tumor-promoting functions in HCC
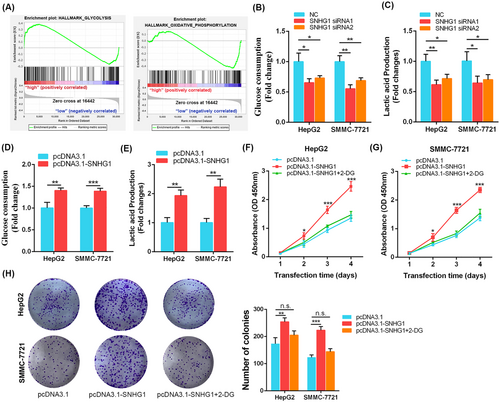
We performed the GSEA between low-SNHG1 and high-SNHG1 groups from GSE76427 and observed that glycolysis was enriched in high-SNHG1 group, whereas oxidative phosphorylation tended to be enriched in low-SNHG1 group (p < 0.05) (Figure 4A). We speculated that SNHG1 might activate glycolysis thereby promoting cell proliferation of HCC. Indeed, knockdown of SNHG1 reduced the levels of glucose uptake and lactate production (p < 0.05) (Figure 4B, C), whereas overexpression of SNHG1 increased glucose uptake and lactate production in HepG2 and SMMC-7721 cells (p < 0.01) (Figure 4D, E). Then we investigated the effect of overexpression of SNHG1 on HCC cells after 2-DG (an inhibitor of glycolysis pathway) treatment. The results revealed that 2-DG treatment weakened pro-proliferative effect of SNHG1 overexpression (p < 0.05) (Figure 4F, G). These data demonstrate that SNHG1 exerts tumor-promoting role in HCC, at least partially, by activating the glycolysis pathway.
3.5 SNHG1 promotes glycolysis of HCC cells via promoting PKM2 expression
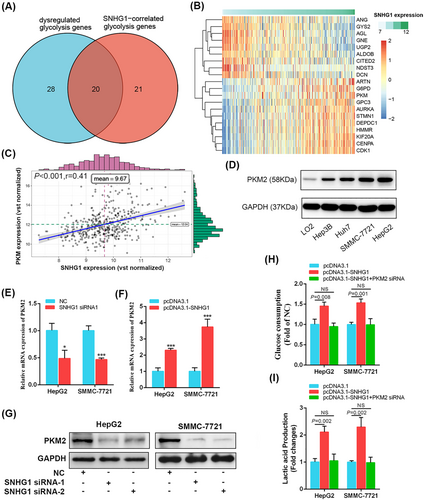
To further elucidate the potential molecular mechanisms of SNHG1 in regulating glycolysis of HCC cells, we screened out 48 differentially expressed glycolysis-related gene in HCC (|log2FC| > 1 and p < 0.05), of which 37 upregulated and 11 downregulated (see Supporting information, Figure S3a and Table S3). Then, the correlations of SNHG1 expression and glycolysis-related genes were analyzed. In total, 41 glycolysis-related genes were significantly correlated with SNHG1 expression (|r| > 0.4, p < 0.05), among which 14 were positively correlated, whereas 27 were negatively correlated (see Supporting information, Table S4). A Venn diagram showed that 20 glycolysis-related genes were consistently dysregulated in HCC and correlated with SNHG1 expression (Figure 5A). The expression patterns of these 20 glycolysis-related genes is visualized in Figure 5B. Interestingly, glycolysis-related genes upregulated in HCC were positively correlated with SNHG1 expression, whereas glycolysis-related genes downregulated in HCC were negatively correlated with SNHG1 expression (see Supporting information, Figure S3b). This phenomenon indicated the close correlation between SNHG1 and glycolysis. AURKA, CDK1, CENPA, DEPDC1, HMMR, KIF20A, and STMN1 have been reported to be members of a glycolysis-related genes prognostic index for HCC.21 However, only PKM has been validated to be responsible for the increased glycolysis levels of HCC and thereby promotes its tumorigenesis.22 Thus, we speculated that SNHG1 might increase glycolysis levels of HCC cells by upregulation of PKM. The scatter plot displayed the significant positive correlation of SNHG1 and PKM expression (r = 0.041, p < 0.001) (Figure 5C). Then, we assessed the influence of PKM expression on the prognosis of HCC patients using Kaplan–Meier analysis. The results showed HCC patients with higher PKM expression had significantly shorter OS and PFI than those with lower PKM expression (p < 0.001 for OS; p = 0.003 for PFI) (see Supporting information, Figure S3c, d). Considering that the M2 variant (PKM2) is the dominant form of PKM in HCC, we validated that PKM2 expression was drastically elevated in cell lines of HCC (HepG2, SMMC-7721, Huh7, and Hep3B) compared to LO2 cells (p < 0.001) (Figure 5D). SNHG1 knockdown inhibited PKM2 expression, whereas SNHG1 overexpression facilitated PKM2 expression in HepG2 and SMMC-7721 cells at both mRNA and protein levels (p < 0.05) (Figure 5E-G). Similarily, after validation of the efficiency of PKM2 knockdown by qRT-PCR (knockdown of PKM2 in HepG2: p < 0.01; knockdown of PKM2 in SMMC-7721: p < 0.01) (see Supporting information, Figure S2g), we observed that PKM2 knockdown significantly reversed the promoting effect of SNHG1 overexpression on glycolysis of HepG2 and SMMC-7721 cells (Figure 5H, I). These data demonstrated that PKM2 is one of SNHG1 target to regulate glycolysis in HCC.
3.6 SNHG1 stabilizes PKM2 through sequestering miR-326
Combining subcellular localization prediction and subcellular fractionation experiments, we confirmed SNHG1 was expressed both in the cytoplasm and nucleus of HepG2 and SMMC-7721 cells (Figure 6A; see also Supporting information, Figure S4a) suggesting that SNHG1 might bind to some miRNAs competitively with PKM2 and inhibit the miRNAs-induced PKM2 repression. In HCC, we identified 331 differentially expressed miRNAs (|log2FC| > 1 and p < 0.05), among which 40 were downregulated and 291 were upregulated (see Supporting information, Figure S4b and Table S5). Then, miRNAs targeting SNHG1 were identified using miRNA-lncRNA module of the ENCORI database. miRNAs targeting 3′ UTR of PKM2 were obtained from miRWalk 3.0. The list of miRNAs that were predicted to target SNHG1 and PKM2 are provided in the Supporting information (Table S6). Overlapping downregulated miRNAs, as well as miRNAs targeting SNHG1 and PKM2, and only miR-326 was identified as the eligible miRNA (Figure 6B). Expression of miR-326 was decreased in human HCC cell lines (HepG2, SMMC-7721, Huh7, and Hep3B) compared to LO2 (p < 0.05) (Figure 6C).
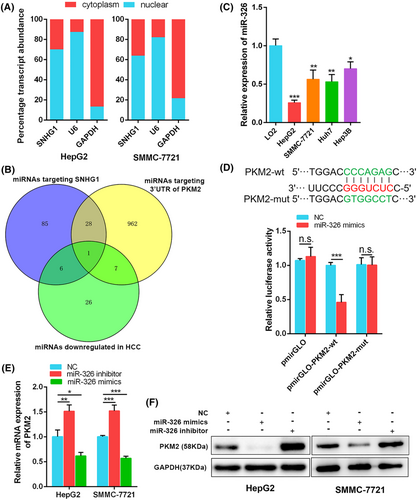
According to the predicted miR-326 binding sites in the 3′ UTR of PKM2, we constructed wild-type (Luc-PKM2-wt) and mutant-type (Luc-PKM2-mut) luciferase reporter vectors containing the 3′ UTR of PKM2. Dual-luciferase reporter assays showed that overexpression of miR-326 dramatically reduced luciferase activity of wild-type PKM2 3′ UTR reporter but not that of mutant-type in HepG2 cells, indicating the potential of miR-326 to intersect with the 3′ UTR of PKM2 mRNA (pmirGLO: p = 0.498; pmirGLO-PKM2-wt: p = 0.001; pmirGLO-PKM2-mut: p = 0.929) (Figure 6D). We validated miR-326 inhibitor dramatically decreased miR-326 expression, whereas miR-326 mimics drastically upregulated miR-326 expression (p < 0.01) (see Supporting information, Figure S2h). As anticipated, overexpression of miR-326 inhibited, whereas inhibition of miR-326 increased mRNA and protein levels of PKM2 in HepG2 and SMMC-7721 cells (p < 0.05) (Figure 6E, F). These above results demonstrate miR-326 can bind to the 3′ UTR of PKM2 and inhibit PKM2 expression in HCC cells.
To further examine whether SNHG1 modulated PKM2 expression through binding to miR-326, we constructed the wild-type (Luc-SNHG1-wt) and mutant-type (Luc-SNHG1-mut) luciferase reporter vectors containing the predicted miR-326 binding sites in the sequence of SNHG1. Dual-luciferase reporter assays showed that overexpression of miR-326 dramatically reduced luciferase activity of wild-type SNHG1 reporter but not that of mutant-type in HepG2 cells, identifying the binding potential between SNHG1 and miR-326 (pmirGLO: p = 0.111; pmirGLO-SNHG1-wt: p = 0.003; pmirGLO-SNHG1-mut: p = 0.148) (Figure 7A).
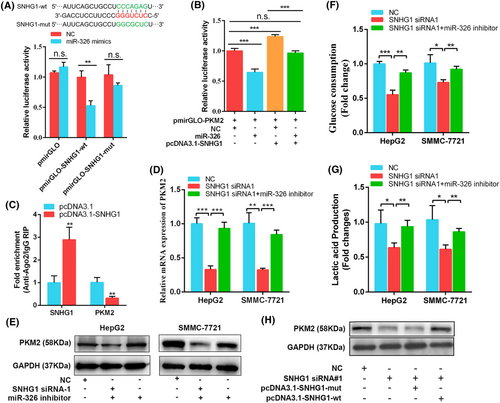
Through co-transfecting Luc-PKM2 with pcDNA3.1-SNHG1 and miR-326 mimics, we observed that SNHG1 significantly abolished miR-326-induced reduction of luciferase activity of wild-type PKM2 3′ UTR reporter (Figure 7B). Moreover, the RIP assay of AGO2 also revealed that overexpression of SNHG1 caused a significant decrease in the enrichment of PKM2 transcripts pulled down by AGO2 antibody (p < 0.01) (Figure 7C). These above results suggest SNHG1 can bind with miR-326 and blocks the interaction between miR-326 and PKM2. Moreover, transfection of miR-326 inhibitor reversed the decrease in PKM2 expression induced by knockdown of SNHG1 (Figure 7D, E). Similar changes were observed in the levels of glucose uptake and lactate production (Figure 7F, G). We next examined whether SNHG1 regulates PKM2 expression by putative miR-326 binding sites. We transfected SNHG1-mut vector with mutations at the putative miR-326 binding sites or the SNHG1-wt vector into HepG2 and SMMC-7721 cells following knockdown endogenous SNHG1, and then measured PKM2 expression. The results indicated transfection of SNHG1-wt reversed the decrease in PKM2 expression, whereas transfection of SNHG1-mut did not (Figure 7H). Taken together, these results demonstrate that SNHG1 sequesters endogenous miR-326 and releases its inhibition effect on PKM2, thereby upregulating PKM2 expression and subsequently increasing glycolysis levels of HCC cells.
4 DISCUSSION
With the development of microarray and RNA sequencing technologies, the list of lncRNAs implicated in the occurrence and development of HCC is expanding rapidly.23, 24 In the present study, we observed that lncRNA SNHG1 was dramatically upregulated in HCC tissues and positively correlated with the poor prognosis of HCC patients. Numerous studies have reported that upregulated SNHG1 is responsible for increasing the proliferation, migration and invasion, anti-apoptosis, and angiogenesis abilities of multiple tumor cells.25-27 In HCC, SNHG1 exhibits different regulatory mechanisms in the cytoplasm and nucleus to promote malignancy. For example, Li et al.28 reported SNHG1 in the cytoplasm predominately acted as a molecular sponge for miR-140-5p to upregulate CDK4, thereby facilitating cell proliferation, migration, and invasion, whereas SNHG1 in the nucleus epigenetically suppressed the expression of CDKN1A and CDKN2B through enhancing EZH2 mediated-H3K27me3 in the promoters of CDKN1A and CDKN2B, thus promoting malignancy of HCC. Previous studies mainly demonstrated the regulatory roles of SNHG1 in cancers, whereas few studies focus on assessing how SNHG1 was transcriptionally regulated. Here, we validated that SNHG1 expression was activated by E2F1 in HCC. E2F1, one member of the E2F family, has been identified as a vital transcription factor in the control of proliferation, differentiation, and apoptosis.29, 30 A recent study has documented that E2F1 mainly plays pro-proliferative effects on HCC and might be an effective therapeutic target for HCC patients.31 Therefore, we speculated that E2F1 exerted its pro-tumorigenic role in HCC through activation SNHG1 expression, at least to some extent.
Furthermore, we validated the role of SNHG1 in promoting cell proliferation and tumor growth of HCC, which was consistent with previous studies. Considering the complexity and diversity of the molecular mechanisms of lncRNAs, exploration of the undiscovered mechanisms of SNHG1 in cell proliferation has great implications for understanding the pathogenesis of HCC. We observed that SNHG1 expression was positively correlated with glycolysis and negatively correlated with oxidative phosphorylation through GSEA. Aerobic glycolysis (i.e., the Warburg effect) is a classic hallmark of cancer cells. Transformation from oxidative phosphorylation to glycolysis under aerobic conditions enables cancer cells to meet the massive biosynthetic and energetic requirements for malignant growth.32 In addition, the acidic environment created by glycolysis is essential for tumor expansion and metastasis.33, 34 Thus, it is of great significance to understand the molecular mechanisms of SNHG1 with respect to regulating glycolysis and whether the promotion effect of SNHG1 on glycolysis is attributable to cell proliferation of HCC.
In the present study, we demonstrated that knockdown of endogenous SNHG1 dramatically decreased glucose uptake and lactate production in HepG2 and SMMC-7721 cells, whereas ectopic expression of SNHG1 produced the opposite effect. Importantly, glycolytic inhibitor 2-DG weakened the promotion effect of SNHG1 on cell proliferation of HCC. Thus, it is reasonable to conclude that SNHG1 promotes cell proliferation of HCC at least in part through upregulation of glycolysis levels. Then, we highlighted that SNHG1 promoted glycolysis of HCC cells through upregulation of PKM2 expression. PKM 1/2 is a well-known speed-limited glycolytic enzyme that catalyzes the conversion of phosphoenopyruvate and ADP to pyruvate and ATP.35 PKM2, the tumor-specific isoform of pyruvate kinase, plays critical roles in aerobic glycolysis.36 several studies have demonstrated elevated expression of PKM2 is associated with treatment resistance and poor prognosis of HCC.37 Our data demonstrate that overexpression of SNHG1 in HCC could result in increased PKM2 expression, which subsequently activates the glycolysis pathway and thereby promotes tumorigenesis.
Based on previous studies, lncRNAs could regulate gene expression through multiple mechanisms, which were generally determined by the subcellular localization. To further illustrate the underlying molecular mechanisms of SNHG1 in regulating PKM2 expression, we investigated the localization of SNHG1 in HCC cells and observed that SNHG1 was present in both the cytoplasm and nucleus. Typically, cytoplasmic lncRNAs act as molecular decoys or sponges of miRNAs to eliminate the inhibitory effects of miRNAs on their downstream target genes, thereby increasing the target genes.38 Therefore, we focused on assessing the potential regulation of cytoplasmic SNHG1 on PKM2 through miRNAs. Through bioinformatics analysis, we identified miR-326 as the eligible miRNA to target the 3′ UTR of PKM2, which could be sequestered by SNHG1. Previous studies have reported SNHG1 serves as the sponge of miR-376a-3p, miR-377-3p, and miR-195-5p to promote tumor growth and metastasis in HCC.39-41 Indeed, a large body of evidence has validated that one lncRNA can contain diverse types and quantities of miRNAs binding sites and thus have multiple miRNA targets.42 We observed the different binding sites of SNHG1 with miR-326, miR-376a-3p, miR-377-3p, and miR-195-5p through the ENCORI database (see Supporting information, Figure S4c). We speculated SNHG1 can simultaneously bind to miR-326, miR-376a-3p, miR-377-3p, and miR-195-5p, weakening their ability to inhibit the expression of their respective target mRNAs. Here, we focused on the role of SNHG1 in the cell glycolysis of HCC. Thus, we provided sufficient evidence indicating that SNHG1 acted as a sponge for miR-326 and released its inhibition of PKM2, thus promoting aerobic glycolysis and the proliferation of HCC cells.
5 CONCLUSIONS
In the present study, we identified that lncRNA SNHG1 expression was significantly activated by E2F1 in HCC. Elevated SNHG1 expression increased glycolysis levels of HCC cells by upregulating PKM2, which promoted cell proliferation and HCC progression. In the mechanism, SNHG1 acted as a molecular sponge for miR-326 to release its inhibition effect on PKM2 expression, thereby increasing PKM2 expression. Collectively, our study established a novel glycolysis-dependent link between SNHG1 and the cell proliferation of HCC, which was an essential supplement to the underlying mechanisms of cell proliferation and also provides a novel lncRNA target for the treatment of HCC.
ACKNOWLEDGEMENTS
This work was supported by the National Natural Science Foundation of China (No. 31972890 to QY), the Department of Science and Technology of Jilin Province (No. 20190201216JC to QY, 20200201143JC to HH), the Norman Bethune Program of Jilin University (No. 2020B28 to HH), and the Graduate Innovation Fund of Jilin University (No. 101832020CX254 to YW).
AUTHOR CONTRIBUTIONS
YW conceived the study. YW conducted the bioinformatic analysis. YW, FY, and QP performed the experiments. YW wrote the manuscript. YW, FY, KM and HH prepared the figures and tables. QY supervised the study and critically reviewed and revised the manuscript. All authors have read and approved the final version of the manuscript submitted for publication.
CONFLICTS OF INTEREST
The authors declare that they have no conflicts of interest.
Open Research
DATA AVAILABILITY STATEMENT
All data used by the study are publicly available in the TCGA-GDC Data Portal (https://portal.gdc.cancer.gov/), GSE84402 dataset (https://www.ncbi.nlm.nih.gov/geo/query/acc.cgi?acc=GSE84402) and GSE76427 dataset (https://www.ncbi.nlm.nih.gov/geo/query/acc.cgi?acc=GSE76427).


