Diverse regulated cell death modes predict the immune microenvironment and drug sensitivity in lung adenocarcinoma
Abstract
Integrated action modes of regulated cell death (RCD) in lung adenocarcinoma (LUAD) have not been comprehensively dissected. Here, we adopted 15 RCD modes, including 1350 related genes, and established RCD signature scores. We found that LUAD patients with high RCD scores had a significantly worse prognosis in all four different cohorts (TCGA, KM-plotter, GSE31210, and GSE30219). Our nomogram established based on the RCD score and clinical characteristics performed well in both the discovery and validation sets. There was a close correlation between the RCD scores and LUAD molecular subtypes identified by unsupervised consensus clustering. Furthermore, we profiled the tumor microenvironment via deconvolution and found significant differences in immune activity, transcription factor activity and molecular pathway enrichment between the RCD-high and RCD-low groups. More importantly, we revealed that the regulation of antigen presentation is the crucial mechanism underlying RCD. In addition, higher RCD scores predict poorer sensitivity to multiple therapeutic drugs, which indicates that RCD scores may serve as a promising predictor of chemotherapy and immunotherapy outcomes. In summary, this work is the first to reveal the internal links between RCD modes, LUAD, and cancer immunity and highlights the necessity of RCD scores in personalizing treatment plans.
1 INTRODUCTION
Lung cancer represents approximately 11.4% of newly diagnosed cancers and 18.0% of cancer-related deaths worldwide (Sung et al., 2021). In terms of pathological types, non-small cell lung cancer (NSCLC) accounts for over 85% of lung cancers. Among them, lung adenocarcinoma (LUAD) is the most common (over 40%). Despite novel advancements in therapeutic strategies, including operations, radiochemotherapy, targeted therapy, and immunotherapy, the overall 5-year survival rate for NSCLC (all stages) remains approximately 26.3% (Howlader et al., 2020), less than 5% for distant metastasis. In addition, the therapeutic responses to multiple therapies in LUAD patients highly vary; accordingly, accurate identification of chemotherapy or immunotherapy responders could save time, reduce progression risk and reduce the burden of diseases in NSCLC patients. Significant tumor heterogeneity and sophisticated regulatory mechanisms account for its low response and high fatality. Thus, exploring tumor heterogeneity, uncovering molecular subtypes, and deciphering the underlying mechanisms could help to develop new drug targets and provide more diversified treatment strategies.
Uncontrolled proliferation and rapid cell death are prominent features of malignant tumors, which evolve into precise and sophisticated regulatory mechanisms to escape immune attack. Cells usually die from accidental cell death (ACD) or regulated cell death (RCD) (Tang et al., 2019). RCD, also known as programmed cell death (PCD), involves tightly regulated molecular mechanisms and signaling cascades (Cui et al., 2021). Multiple types of RCD, such as apoptosis, pyroptosis, autophagy, necroptosis, entosis, ferroptosis, parthanatos, and lysosome-dependent cell death (LCD), have been reported as the key features of tumor growth and crucial targets of therapy (Peng et al., 2022). Recently, an increasing number of RCD types have been proposed. Cuproptosis denotes copper-induced cell death by targeting lipoylated TCA cycle metabolism (Tsvetkov et al., 2022). Anoikis occurs upon integrin ligation disruption and cell detachment from the correct extracellular matrix (Gilmore, 2005). Mitochondrial transmembrane permeability-driven necrosis, triggered by the opening of the mPTP and increases in matrix levels of Ca2+ and ROS, is a kind of RCD associated with mitochondrial dysfunction (Robichaux et al., 2023). Netotic cell death, also known as NETosis, is a form of RCD induced by the release of extracellular net-like DNA‒protein structures (Brinkmann et al., 2004). Alkaliptosis is an intracellular alkalinization-derived RCD termed in 2018 (Song et al., 2018). Oxeiptosis is a kind of oxygen radical-induced RCD induced by the KEAP1-PGAM5-AIFM1 pathway independent of caspases (Holze et al., 2018). Disulfidptosis is a previously uncharacterized RCD induced by aberrant accumulation of intracellular disulfides under glucose starvation (Liu et al., 2023). The above forms of RCD were reported to be closely related to tumorigenesis, progression, invasion, and therapeutic outcomes (Gong et al., 2022; Koren & Fuchs, 2021; Wu et al., 2022) and participate in the regulation of antitumor immunity (Su et al., 2023; Wallach & Kang, 2018). However, a comprehensive explanation of the relationship between RCD and LUAD remains unclear.
In this study, we integrated 15 high-profile forms of RCD, including apoptosis, autophagy, LCD, anoikis, necroptosis, ferroptosis, pyroptosis, cuproptosis, entotic cell death (entois), mitochondrial transmembrane permeability-driven necrosis, parthanatos, netotic cell death, alkaliptosis, oxeiptosis, and recently reported disulfidptosis, to dissect their profiles and key roles in LUAD. To our knowledge, this study is the most comprehensive inclusion of RCD types. We aimed to establish novel and comprehensive RCD scores to decipher the tumor immune microenvironment and to predict the efficacy of chemotherapy and immunotherapy and the prognosis of LUAD patients. In summary, we elucidated the heterogeneity of RCD activity among LUAD patients and discovered corresponding prognostic differences as well as immune regulatory mechanisms, which would help further explorations of novel therapeutic regimens.
2 METHODS
2.1 Data acquisition
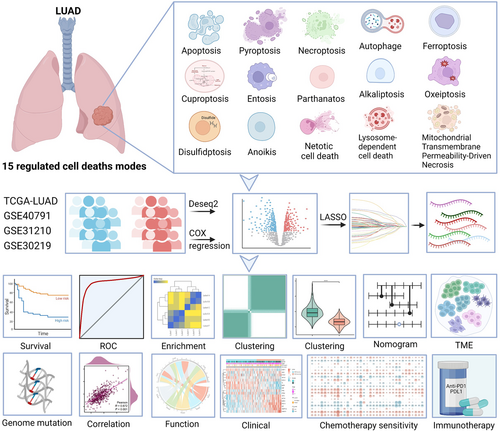
The RCD-related genes comprise the key regulatory genes of 15 cell death modes, as mentioned earlier. Gene lists were constructed from the KEGG database, MSigDB database, and manual input through literature retrieval (Tang et al., 2019; Zou et al., 2022). The workflow of this study is summarized in Figure 1. TCGA RNA-seq data and clinical phenotype data from LUAD samples were downloaded from the University of California Santa Cruz (UCSC) Xena database (https://xenabrowser.net/hub/). Gene expression data from normal lung tissues were downloaded from the Genotype-Tissue Expression (GTEx) portal database (https://www.gtexportal.org/). The “combat” R package was used to remove batch effects. The “org.Hs.eg.db” R package was applied to conduct annotations of ensemble IDs. In addition, we downloaded data from the Gene Expression Omnibus (GEO) repository (https://www.ncbi.nlm.nih.gov/geo/) using the “GEOquery” R package, and the accession IDs were GSE40791, GSE31210, and GSE30219. The probes were annotated using the “AnnoProbe” R package. We used the gene expression data from the Kaplan‒Meier Plotter database (https://kmplot.com/analysis/) for gene signature validation. We also downloaded masked somatic mutation data from UCSC Xena.
2.2 Identification and depiction of prognosis-related RCD genes
Raw transcriptome count data from 585 patients from TCGA and 578 healthy donors from GTEx were included. Subsequently, the “Deseq. 2” R package was employed to screen out DEGs between LUAD and normal lung samples according to the adj. p < 0.05 and |log2FC | > 1.5. We used XIANTAO Scholar online tools (https://www.xiantao.love/) to identify enriched biological processes and pathways based on the DEGs. The “maftools” R package (Mayakonda et al., 2018) was used to explore masked somatic mutations among TCGA LUAD patients.
2.3 Construction of the prognostic RCD gene signature
β(i) represents the risk coefficient of the gene, and Exp(i) refers to the gene expression levels. The coefficients were retained to 3 decimal places. According to the best cutoff value determined by the “surv_cutpoint” function in the “survminer” package, we divided LUAD patients into low and high RCD score groups. Then, we conducted clinical relevance analyses between the collected clinical information (age, sex, T stage, N stage, M stage, and stage) and RCD scores.
2.4 Unsupervised clustering
We applied the “ConsensusClusterPlus” R package to complete consensus clustering analysis to identify the potential subtypes of LUAD. The parameters of “ConsensusClusterPlus” were selected as follows: “maxK” was “8,” “clusterAlg” was “pam,” and “distance” was “pearson.”
2.5 Nomogram
Clinical information (age, sex, T stage, N stage, M stage, and stage) and RCD scores were integrated to build the prognostic nomogram model by using the “rms” package. The nomogram plot was drawn by the “regplot” package. The C-index and calibration curve established by the “rcorrcens” and “calibrate” functions were used to evaluate the efficacy. Receiver operator characteristic (ROC) analyses were performed by the “timeROC” package, and the AUC value was used to indicate model performance.
2.6 Tumor microenvironment
We used the “immunedeconv” R package to conduct tumor microenvironment analyses based on the RNA expression data of all genes. The parameter was selected as “abis” to complete a 17-immune-cell deconvolution. The parameter was selected as the “estimate” to predict the stromal score, immune score, tumor purity, and ESTIMATE score of LUAD patients. The parameter “xcell” was selected to perform enrichment analysis for 36 immune and stromal cells as well as to calculate the immune score, stromal score, and microenvironment score. The parameter was selected as the “timer” to evaluate the abundance of six major immune cell types.
2.7 Drug sensitivity
For the analyses of chemotherapy drug sensitivity, the “oncoPredict” package (Maeser et al., 2021) was applied. The training data of the “calcPhenotype” function were selected as “GDSC2” (Genomics of Drug Sensitivity in Cancer 2 datasets). The parameter “batchCorrect” was selected as “eb.”
For the prediction of immunotherapy efficacy, we used two methods, the Tumor Immune Dysfunction and Exclusion (TIDE) algorithm and the “easier” R package. We uploaded the expression matrix in our study to the TIDE online website (http://tide.dfci.harvard.edu/) to obtain the TIDE score and predicted immunotherapy responses of each patient. The “easier” package (Lapuente-Santana et al., 2021) was used to compute immune cell fractions and evaluate pathway and transcription factor activities to obtain immune checkpoint inhibitor (ICI) response scores.
2.8 Survival
We applied the “survival” and “survminer” R packages to perform univariate and multivariate Cox survival analyses. Survival curves were described by Kaplan‒Meier plots and compared with the log-rank test.
2.9 Statistical analysis
We used R software (v.4.2.2) to perform all analyses. Student's t test or the Wilcoxon test was used to analyze differences between the two groups. The Kruskal‒Wallis test was used to compare differences among multiple groups. p < 0.05 was considered statistically significant.
3 RESULTS
3.1 Study workflow
For the clinical cohorts in this study, we retrospectively included 585 patients from TCGA (524 LUAD and 61 normal lung), 578 healthy donors from GTEx, 307 samples from GSE30219 (Rousseaux et al., 2013) (293 tumors and 14 normal lung), 246 samples from GSE31210 (Okayama et al., 2012) (226 tumors and 20 normal lung), and 194 patients from GSE40791 (Zhang et al., 2012) (100 tumors and 94 normal lung). In addition, 15 RCD modes with 1350 related genes were integrated (Supporting Information: Table 1). Altogether, 580 apoptosis genes, 367 autophagy genes, 220 LCD genes, 121 anoikis genes, 101 necroptosis genes, 88 ferroptosis genes, 52 pyroptosis genes, 9 parthanatos genes, 22 mitochondrial transmembrane permeability-driven necrosis genes, 19 cuproptosis genes, 17 disulfidptosis genes, 7 alkaliptosis genes, 15 entois genes, 8 netotic cell death genes, and 5 oxeiptosis genes were identified. The workflow of this study is shown in Figure 1.
3.2 Multiomics patterns of RCD-related genes in LUAD patients
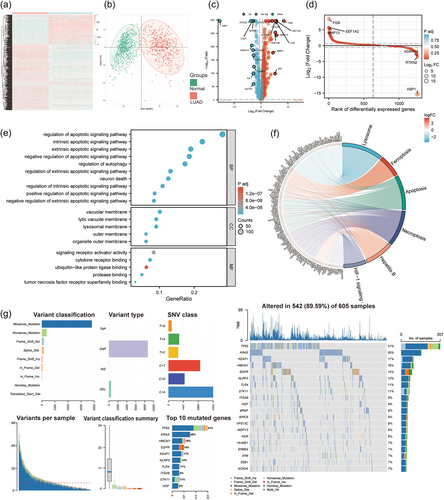
By comparing LUAD tissues in TCGA with normal lung tissues in GTEx cohorts, we identified 486 differentially expressed genes (DEGs). Among all DEGs, 318 were upregulated and 168 genes were downregulated in LUAD patients (Supporting Information: Table 2). Gene expression heatmaps showed the scaled RNA levels of DEGs (Figure 2a). A principal component analysis (PCA) plot showed the clustering effect of LUAD and normal lungs based on DEGs (Figure 2b). The volcano plot and the differential ranking chart of the DEGs are shown in Figure 2c,d. In addition, Gene Ontology (GO) and Kyoto Encyclopedia of Genes and Genomes (KEGG) enrichment analyses indicated that these DEGs are involved in apoptosis and autophagy signaling pathways (Figure 2e,f). The genome variations in RCD-related genes were also assessed in the TCGA-LUAD cohort. Our results indicated that approximately 89.59% (542/605) of LUAD patients possessed genetic mutations. The top 20 mutations were displayed; among them, TP53 had the highest mutation frequency (51%), KRAS possessed a 26% mutation frequency, KEAP1 possessed a 17% mutation frequency, HMCN1 possessed a 16% mutation frequency, EGFR possessed a 14% mutation frequency, NLRP3 possessed a 12% mutation frequency, and others ranged from 7% to 11% (Figure 2g).
3.3 Construction of a prognostic gene signature based on RCD DEGs
To construct an RCD gene signature for LUAD patients, univariate analysis was leveraged to generally screen out prognosis-related genes. In the TCGA-LUAD cohort, 124 genes were obtained that met the cutoff of p < 0.05. We identified differences between LUAD and normal lung tissues based on GSE40791 gene expression profiling by array (Supporting Information: Figure S1A). The intersection of the DEGs in the TCGA and GSE40791 cohorts included 47 genes (MMP1, FGA, MELK, CTSV, HMGA1, ERO1A, BIK, PMAIP1, CDK5R1, CD27, MIF, ANGPTL4, KRT8, KRT18, ENO1, PPIF, SFN, HSPD1, PIM2, ITGA5, CTSH, HGF, SORT1, BMP5, CTSW, DRAM1, PIK3R1, MSX1, CX3CL1, TLR4, SESN1, ITPRIP, PTGDS, DAPK2, HSPB8, CTSG, IL33, NLRC4, LRRK2, FGR, ITGA8, KL, PECAM1, DNASE2B, FOXF1, LAMP3, and ADRB2). Then, a 17-gene signature was constructed by LASSO regression machine learning (Figure 3a,b). Among the 17 genes, 10 were derived from apoptosis, 3 were derived from autophagy, 3 were from anoikis, 2 were from LCD, 1 was from mitochondrial transmembrane permeability-driven necrosis, 1 was derived from pyroptosis, and 1 was from parthanatos. We next investigated the functional correlation of these genes. GO and KEGG enrichment analyses indicated that they are involved in apoptosis and autophagy signaling pathways and are related to lysosome function (Supporting Information: Figure S1B). We applied the Wilcoxon test to compare the RNA levels of each gene between LUAD and normal lung samples and performed Kaplan–Meier analysis to identify their specific influence on survival, indicating that all the model genes were significantly different between the two groups (p < 0.05) and exerted a significant influence on OS (p < 0.05) (Supporting Information: Figure S2).
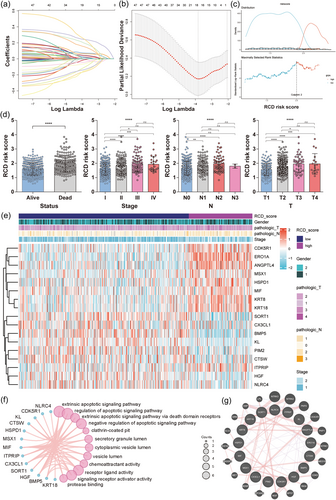
Our 17-gene model exported and calculated the RCD score of each patient by the following formula. RCD scores = (0.236 × ERO1A exp.) + (0.0216 × ANGPTL4 exp.) + (0.071 × KRT8 exp.) + (0.0616 × KRT18 exp.) + (−0.0196 × BMP5 exp.) + (0.179 × CDK5R1 exp.) + (0.039 × HSPD1 exp.) + (−0.003 × HGF exp.) + (−0.149 × SORT1 exp.) + (−0.082 × KL exp.) + (0.013 × MIF exp.) + (0.135 × MSX1 exp.) + (−0.136 × NLRC4 exp.) + (−0.121 × PIM2 exp.) + (−0.035 × CX3CL1 exp.) + (0.211 × ITPRIP exp.) + (−0.051 × CTSW exp.). Based on the best cutoff value identified by the surv_cutpoint function (Figure 3c), we divided LUAD patients from TCGA into high- and low-RCD groups, which were selected as a training data set. The RCD scores of patients were significantly correlated with clinical characteristics, including survival outcome (alive or dead), pathologic T stage (T1–T4), pathologic N stage (N0–N3), and tumor clinical stage (I–IV) (Figure 3d,e). The top 12 biological processes, molecular functions and cellular components of the 17 genes are shown in a circle plot (Figure 3f). The protein‒protein interaction network results based on 17 model genes and their top 20 related genes are shown in Figure 3g.
3.4 Internal and external validation of the RCD gene signature
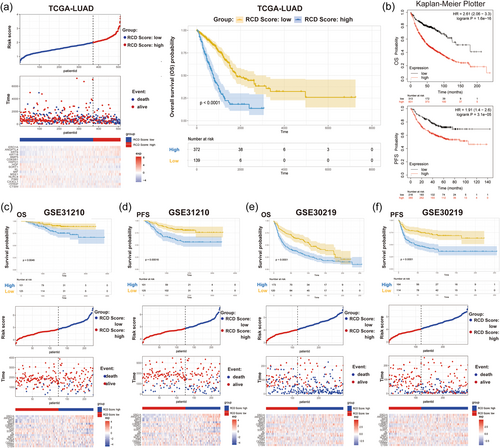
To confirm the prognostic value of the RCD gene model, we next compared the survival of LUAD patients with high and low RCD scores in multiple clinical cohorts. Our results indicated that LUAD patients with high RCD scores had a shorter OS than those with low RCD scores (Figure 4a). Subsequently, we used KM-plotter data, GSE31210, and GSE30219, as external validation cohorts. According to the 17-gene signature, 1144 KM plotter patients were divided into high and low groups, and survival outcomes were compared. The results showed that patients with low RCD scores had better OS and PFS (Figure 4b). Furthermore, according to the 17-gene LASSO signature prediction model, the RCD scores of 226 LUAD patients in the GSE31210 cohort and 293 LUAD patients in the GSE30219 cohort were calculated, and patients were divided into high and low groups. High RCD scores resulted in poor survival times, including OS and PFS (Figure 4c–f).
3.5 Consensus clustering of 47 differentially expressed RCD genes
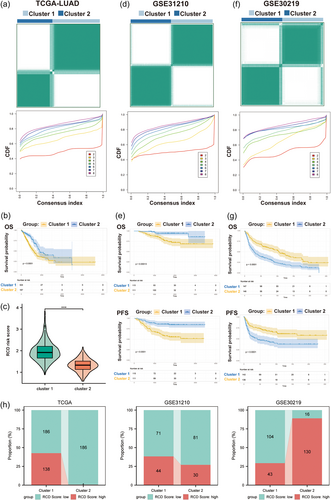
To explore the underlying subtypes of LUAD, 47 RCD-related genes were included to employ consensus clustering analyses. We revealed that when LUAD patients were divided into two clusters (k = 2), the differences between clusters were most obvious, indicating that all TCGA LUAD patients could be well classified into two subgroups (Figure 5a). The OS outcomes of patients between the two clusters showed an obvious difference, in which cluster 2 was related to a more favorable prognosis, whereas cluster 1 was associated with a poorer prognosis (p < 0.0001, Figure 5b). Consistently, the RCD scores of patients in cluster 1 were significantly higher than those in cluster 2 (p < 0.001, Figure 5c). Similar results were found in GSE31210 (Figure 5d,e). In the GSE30219 cohort, LUAD patients in cluster 1 had a better prognosis (both OS and PFS) than those in cluster 2 (Figure 5f,g). Moreover, the columnar alluvial diagrams of the TCGA and GSE31210 cohorts indicated that the majority of patients in cluster 2 had a low RCD score, whereas GSE30219 had the opposite result (Figure 5h). The cluster with better prognosis had more patients with low RCD scores, suggesting that molecular clusters were significantly associated with RCD scores.
3.6 Establishment and validation of the nomogram based on the RCD risk score
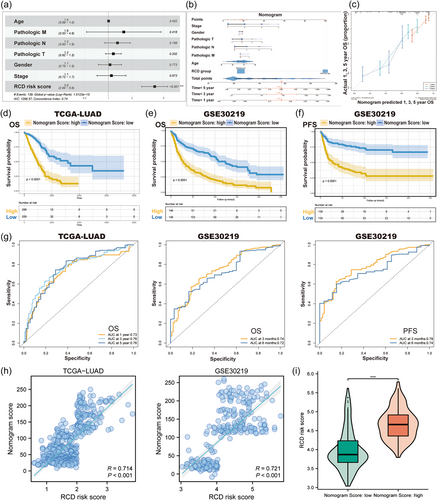
Multivariate Cox regression analyses based on RCD scores and clinical features were performed to determine whether the RCD score could be an independent prognostic biomarker. Our results in the TCGA cohort indicated that the RCD score was an independent predictor for OS (HR = 3.90, 95% CI: 2.64–5.60, p < 0.001, Figure 6a). Then, we used the above variables to create a nomogram survival model for TCGA LUAD patients to estimate the 1-, 3-, and 5-year OS rates (Figure 6b). The C-index value of the nomogram model was 0.75. Calibration curves are shown in Figure 6c. Moreover, we conducted Kaplan–Meier analyses in the TCGA-LUAD cohort to compare survival differences between groups with different nomogram scores (Figure 6d). Furthermore, we validated the prognostic value of the nomogram score in the GSE30219 cohort and observed that LUAD patients with higher nomogram scores had shorter OS (p < 0.0001, Figure 6e) and PFS (p < 0.0001, Figure 6f). Additionally, we calculated the area under the ROC curve (AUC) values to assess nomogram performance in the TCGA and GSE30219 cohorts and demonstrated excellent performance of the nomogram model in predicting the survival of LUAD patients (Figure 6g). Finally, we explored the relationship between nomogram scores and RCD scores and revealed that they were positively correlated (Figure 6h) and that the RCD scores of patients with high nomogram scores were significantly higher than those of patients with low nomogram scores (Figure 6i).
3.7 Decipherment of the tumor immune microenvironment based on the RCD signature
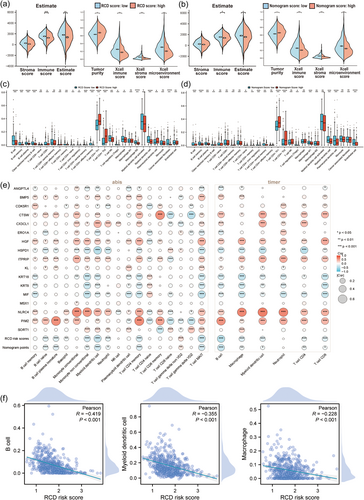
Furthermore, we performed tumor microenvironment analyses to identify potential differences in tumor-immune features between two different RCD groups as well as the two nomogram groups. First, we identified whether there were differences in immune scores, tumor purity, stroma scores, and microenvironment scores. Violin plots of the ESTIMATE and XCELL microenvironment scores indicated that tumors with low RCD and nomogram scores might possess stronger immune activities (Figure 7a,b). Then, we used various deconvolution algorithms to acquire the enrichment scores of multiple immune cells. Bar plots showed that the abundance of multiple immune cells was significantly different between the high- and low-RCD groups (Figure 7c), as well as between the high- and low-nomogram groups (Figure 7d). The correlation heatmap indicated that both RCD scores and nomogram scores were negatively correlated with the enrichment of most immune cells (Figure 7e). Strikingly, three antigen-presenting cells (APCs), including dendritic cells, B cells, and macrophages, were all significantly higher in the RCD-low group, with a significant negative correlation with RCD scores (Figure 7f), suggesting that the 17-gene signature may affect antigen presentation function to influence prognosis.
3.8 Prediction of chemotherapy and immunotherapy sensitivity based on the RCD signature
To further elucidate the relationship between the RCD signature and drug sensitivity, we predicted each drug's half maximal inhibitory concentration (IC50) value in LUAD samples by the oncoPredict R package according to the gene expression or drug response data of the GDSC2 data set. The landscape of the correlation between drug sensitivities and RCD scores as well as nomogram scores is shown in Figure 8a. The results identified drugs with significant differences in therapeutic responses between the high and low RCD groups. We found that the IC50 values of eight drugs, including doramapimod, axitinib, GSK269962A, JQ1, ribociclib, AZD6482, SB216763, and TAF1 5496, were significantly higher in the RCD high group than in the RCD low group (Figure 8b, Supporting Information: Figure S3A), suggesting that LUAD patients with high RCD scores were more resistant to these chemotherapeutic drugs.
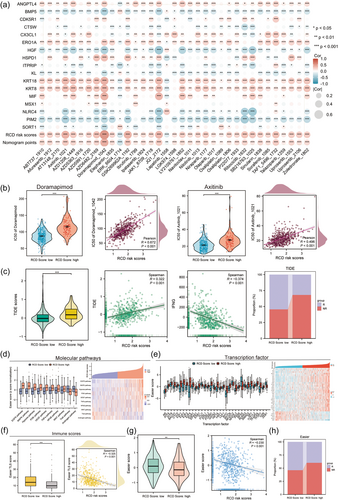
To explore ICI immunotherapy sensitivity, we performed TIDE and Easier immunotherapy response assessments in each LUAD patient. In TIDE explorations, we revealed that the TIDE scores were higher in the RCD low group, with a significant negative correlation (Figure 8c, Supporting Information: Figure S3B). In Easier evaluations, we integrated molecular pathway activity (Figure 8d), transcription factor activity (Figure 8e), and immune cell fractions (Figure 8f, Supporting Information: Figure S3C) to obtain ICI response scores. We revealed significant differences in the immune response between the RCD score high and low groups (Figure 8d–g). Easier and TIDE immunotherapy prediction results indicated that LUAD patients with low RCD scores were more likely to respond to immunotherapy, while LUAD patients with high RCD scores may not benefit from immunotherapy (Figure 8c,h), suggesting that high RCD activities are significantly correlated with low immunotherapy sensitivity.
4 DISCUSSION
To the best of our knowledge, this study is the first to comprehensively analyze 15 diverse RCD forms to construct an RCD gene signature in LUAD patients and further validate its excellent performance in three external LUAD cohorts (KM-plotter, GSE31210, and GSE30219). Furthermore, we deciphered the underlying relevance of RCD scores and the tumor microenvironment, as well as immune regulatory machines. Finally, we proposed that the RCD score has the potential to be an indicator of chemotherapy sensitivity and a promising biomarker of immunotherapy for LUAD patients.
RCD processes involve sophisticated regulation and various cell suicide pathways, playing a critical role in cancer emergence, development, and immune homeostasis (Peng et al., 2022; Qi et al., 2022). Although induction of RCD has been demonstrated to be positive and beneficial for cancer therapy, RCD is still considered a double-edged sword, as it can also be exploited to drive oncogenesis and progression (Koren & Fuchs, 2021). By screening 17 RCD-related hub genes (ANGPTL4, BMP5, CDK5R1, CTSW, CX3CL1, ERO1A, HGF, HSPD1, ITPRIP, KL, KRT18, KRT8, MIF, MSX1, NLRC4, PIM2, SORT1), we created a novel signature based on 17-gene RCD scores and validated its prognosis prediction performance in LUAD patients. Among the 17 hub genes, HGF, MIF, and SORT1 are involved in multiple RCD modes. HGF, hepatocyte growth factor, plays crucial roles in all three RCD pathways of apoptosis, autophagy-related cell death, and anoikis. HGF acts as an effector of mesenchymal-epithelial transforming factor (MET). Activated MET/HGF signaling can functionally crosstalk with the ERK/MAPK pathway, PI3K/AKT pathway, and VEGFR pathways to promote multiple oncogenic biological processes, including cellular proliferation, migration, angiogenesis, and drug resistance (Kim & Kim, 2017; Raghav et al., 2012). However, potential controversy regarding the prognostic action of HGF in lung cancer still exists (Moosavi et al., 2019; Pan et al., 2022). In our research, we found that the expression of HGF was lower in LUAD patients, and relatively lower expression was significantly associated with a worse survival outcome. HGF acts more as a favorable factor for LUAD patients. The controversial actions and in-depth mechanisms underlying HGF still need to be explored through in vitro and in vivo experiments. Macrophage migration inhibitory factor (MIF) is not only involved in apoptosis but is also a parthanatos-related gene (Yang et al., 2020). MIF can interact with intracellular Jab1/CSN5, CD74, CD44, CXCR2, CXCR4, and/or CXCR7, resulting in downstream molecular activation, which significantly promotes immune escape and immune tolerance in various malignancies (Noe & Mitchell, 2020). In addition, MIF can also enhance tumor progression and angiogenesis (Klemke et al., 2021; Penticuff et al., 2019). This was also confirmed in our study. We found that MIF expression was much higher in LUAD samples than in normal tissues and was an unfavorable prognostic indicator. Sortilin 1 (SORT1) plays an important role in protein internalization, sorting, and trafficking and is overexpressed in various cancers, including ovarian cancer, breast cancer, pancreatic cancer, colorectal cancer, and lung cancer. In lung cancer, SORT1 can inhibit EGFR signaling by promoting its internalization, and SORT1 expression is negatively correlated with cancer pathological grades as well as survival (Al-Akhrass et al., 2017). Our results indicate that SORT1 is a protective factor for LUAD prognosis.
In the cancer-immune cycle, tumor growth and antitumor immune activity are two related and opposite biological processes, indicating that the RCD profiling of each patient is closely correlated with tumor immunity. In our study, the RCD scores we established increased with elevated clinical stage, T stage, N stage and survival status, and the RCD scores were strongly negatively correlated with survival in LUAD patients. Higher RCD scores suggest stronger tumor progression and invasion; in return, antitumor immunity remains more exhausted. Consistently, our results indicate that patients with high RCD scores had lower immune microenvironment enrichment scores and weaker immune responses to immunotherapy, which may be due to inadequate antigen presentation. Immunotherapy, represented by ICIs, is transforming the treatment modes of solid tumors, especially for lung cancer. However, only a small percentage of patients respond well to ICIs, and over 50% of patients show ICI resistance to various mechanisms, among which inadequate antigen presentation is one of the most important (Wang et al., 2019). Our study reveals that the abundance of three major APCs, DCs, macrophages and B cells, is negatively correlated with the RCD score in LUAD patients. Theoretically, RCD is correlated with the motivation of antigen release and immune stimulation, which is consistent with the above results.
Although the 17-gene RCD signature showed excellent performance in four different LUAD cohorts (TCGA, KM-plotter, GSE31210, and GSE30219), there are still some defects that limit its application. First, clinical cohorts in this study come from multiple online databases, including patients recruited retrospectively from different countries, which could lead to bias in our analyses. Second, the RCD gene signature we constructed in this study has not been verified in prospective clinical randomized controlled trials. Third, the expression profiles and internal mechanisms of the 17 RCD genes used to construct our gene signature in LUAD patients have not been explored in vitro or in vivo, which is vitally essential for biomarker translational research. Therefore, in future studies, more high-quality multicenter clinical trials and in-depth mechanism mining are needed.
5 CONCLUSIONS
In conclusion, the RCD-related gene signature established and validated in this study is not only a promising prognostic indicator for LUAD patients but also a practical predictor of chemotherapy and immunotherapy, which could provide more crucial information overlooked in the past to aid clinical decision-making.
AUTHOR CONTRIBUTIONS
Binwu Ying and Juan Zhou designed the study. Liting You and Zhaodan Xin collected and organized the patient's data. Liting You, Feifei Na, and Xiaohan Zhou performed data analyses. Liting You write the manuscript. Juan Zhou and Binwu Ying critically reviewed the manuscript and all authors did the final check.
ACKNOWLEDGMENTS
We express our thanks to BioRender for constructing Figure 1 in this paper. This work was supported by the National Natural Science Foundation Regional Innovation and Development (grant No. U20A20394), the Project of Science and Technology Department of Sichuan Province (grant No. 2020YJ0106), and the Project of Sichuan Province Key Laboratory Open Funding (grant No. SZKF202210).
CONFLICT OF INTEREST STATEMENT
The authors declare no conflict of interest.
ETHICS STATEMENT
This study was conducted under the guidance of the Declaration of Helsinki. All the data in this study were from open databases.


