Chemerin located in bone marrow promotes osteogenic differentiation and bone formation via Akt/Gsk3β/β-catenin axis in mice
Jun Li and Ting Zhang contributed equally to this study.
Abstract
Chemerin, a secreted protein mainly produced by adipocytes and hepatocytes, plays a variety of roles in endocrine or paracrine signaling. As reported in human epidemiology, chemerin was correlated with osteoporosis. And the previous in vitro study found that chemerin knockdown promoted osteogenesis and inhibited adipogenesis. However, the function of chemerin in bone metabolism and the underlying mechanism remains unclear. In this study, we uncovered the in vivo function of chemerin in bone homeostasis. We discovered that in obese mice, chemerin was increased in serum, while decreased in the bone marrow; and the chemerin expression in bone tissue was positively correlated with osteogenic genes. To further investigate the function of chemerin in bone metabolism, we generated chemerin deficiency and overexpression mice. We found bone mass and osteogenesis were decreased in chemerin deficiency mice, while were increased in chemerin overexpression mice. Furthermore, we observed that the chemerin expression increased during osteogenic differentiation of MSCs. Besides, we verified that chemerin promoted osteogenic differentiation in C3H10T1/2 cells and BMSCs through Akt/Gsk3β/β-catenin axis. Treatment with Akt inhibitor (MK2206) abolished the promoting effect of chemerin on osteogenic differentiation and active β-catenin. Together, our results suggest chemerin in bone marrow, not in serum, promotes osteogenic differentiation and bone formation via Akt/Gsk3β/β-catenin axis. Chemerin may serve as a therapeutic strategy for osteoporosis.
1 INTRODUCTION
With the increase of the obese population, obesity-related bone diseases are increased largely (Tencerova et al., 2019; Walsh & Vilaca, 2017), which causes great health problems and an economic burden. Understanding how obesity affects bone metabolism is important for the treatment of metabolic osteopathy. The maintenance of bone homeostasis depends on the balance between bone-formation osteoblasts and bone-resorption osteoclasts, and destruction of this balance would increase bone diseases (Siddiqui & Partridge, 2016). Obesity, characterized by abnormal adipocyte proliferation and altered adipokines secretion, affects bone homeostasis by adipokines (e.g., leptin, visfatin; Neumann et al., 2016). Leptin enhanced bone growth and maturation by increasing osteoblast number and activity through the peripheral pathways (Turner et al., 2013). Visfatin impaired bone remodeling via both inducing the pro-inflammatory factors and dysregulating the MMP/TIMP balance during MSCs differentiation (Tsiklauri et al., 2018).
Chemerin, encoded by the gene Rarres2, is a secreted protein mainly produced by adipocytes and hepatocytes, performs a variety of functions in the endocrine or paracrine way, including chemoattractant, proinflammation, proangiogenesis, and calcium mobilization (Bozaoglu et al., 2007; Goralski et al., 2007; Helfer & Wu, 2018; Kaur et al., 2010; Luangsay et al., 2009), which is elevated in serum in obesity (Sell et al., 2010). Recently, several epidemiological studies reported a higher circulating chemerin in osteoporosis patients (Kadric et al., 2018; Terzoudis et al., 2016). Muruganandan et al (Muruganandan et al., 2010) found that knocking down chemerin or its receptor CMKLR1 inhibits adipogenesis and promotes osteoblastogenesis of bone marrow mesenchymal stem cells (BMSCs). However, chemerin receptor CMKLR1 and GPR1 knockout mice showed a decreased bone mass and osteogenic differentiation, indicating that chemerin signaling plays a positive role in regulating bone formation in vivo.
In this study, we aim to investigate the effect of chemerin on bone metabolism in mice. We discovered that in obese mice, the serum chemerin was increased, but the chemerin expression in bone was decreased; and the chemerin expression in whole long bone is positively correlated with osteogenic genes. We generated chemerin knockout (Rarres2 −/−) and Ap2-drive Rarres2 overexpression transgenic (TG) mice to investigate the functions of chemerin in bone metabolism. We found that bone mass and osteogenesis was decreased in Rarres2 −/− mice, whereas increased in TG mice. Besides, we verified chemerin promoted osteogenic differentiation via Akt/Gsk3β/β-catenin axis in vivo and in vitro. Our findings suggest chemerin might serve as a promising therapeutic target for osteoporosis.
2 MATERIALS AND METHODS
2.1 Animal models
Eight-week-old male wild-type C57BL/6 mice, purchased from the Animal Center of Chongqing Medical University, were fed with a normal-chow or high-fat diet (60% Kcal in fat) for 12 weeks. Rarres2 −/− mice were kindly provided by Dr. Rui He (Department of Immunology, Biotherapy Research Center, Fudan University) (Lin et al., 2017). Ap2-drive transgenic mice with Rarres2 overexpression were generated by ShangHai Southern Model Biotechnology Development Company (Shanghai, China). Twenty-week-old male transgenic mice and littermate (LM) were used and fed with a normal-chow diet. Animals were kept in a standard facility: 22°C, 12-h light/dark cycle, food, and water available ad libitum. All experiments were performed following the National Institute of Health guidelines on the care and use of animals.
2.2 Microcomputed tomography
For microcomputed tomography (μCT) analysis, the left femurs were scanned with a resolution of 9 µm (1076 μCT System; SkyScan). Images were acquired at 29 kV, 179 μA, and a 0.5 mm aluminum filter with a 900 ms integration time, and density measurements were calibrated to the manufacturer's hydroxyapatite phantom. Trabecular bone was measured at 200 layers below the growth plate and cortical bone at 50 layers of the diaphysis, including volumetric bone mineral density (vBMD), bone volume per total volume (BV/TV), trabecular number (Tb. N), trabecular thickness (Tb. Th), and cortical thickness (Ct. Th; Bouxsein et al., 2010).
2.3 Static histomorphometry
Left femurs were fixed with 4% paraformaldehyde for 24 h, decalcified in 14% ethylenediaminetetraacetic acid for 4 weeks, and embedded in paraffin. Five-micrometer longitudinal sections of the femurs were acquired and performed H&E and tartrate-resistant acid phosphatase (TRAP) staining. H&E staining was used for measuring trabeculae area/tissue area (Tb. Ar/T. Ar), bone marrow adipocytes (BMAs), and osteoblasts. TRAP staining was used for osteoclasts analysis. All static histomorphometry analysis was performed in the cancellous bone of an 800 μm region of the distal femur, starting 200 μm below the growth plate using Image-Pro Plus 6.0 (Media Cybernetics).
2.4 Dynamic histomorphometry
Calcein (30 mg/kg) was intraperitoneally injected into 20-week-old male mice on day 14 and 2 before euthanasia. The left tibiae were embedded in methylmethacrylate and sectioned at 10 μm longitudinally. Mineral apposition rate (MAR, μm/day) and bone surface-based bone formation rate (BFR/BS, μm3/μm2/day) were analyzed according to the guidelines of the ASBMR nomenclature committee (Dempster et al., 2013).
2.5 Immunofluorescence
For immunofluorescence staining, sections were deparaffinized and rehydrated in xylene and ethanol before antigen retrieval with sodium citrate buffer for 20 min at 100°C. Slides were permeabilized for 10 min in 0.2% Triton-X 100 in PBS and blocked for 1 h with goat serum. The primary antibody was made up in 2.5% goat serum in PBS and incubated overnight at 4°C. The secondary antibody was made in PBS and incubated for 1 h at room temperature.
2.6 Quantitative real-time PCR
Total RNA was extracted using Trizol reagent (Cat.15596026; Thermo Fisher Scientific) and reverse-transcribed into cDNA using the RevertAid First Strand cDNA Synthesis Kit (Cat.K1622; Thermo Fisher Scientific) according to the manufacturer's instructions. The mRNA levels of the investigated genes were measured using SYBR Green Master Mix (Cat.A25746; Thermo Fisher Scientific), normalized to Gapdh, and analyzed by 2− ∆∆ct. The primer sequences used are shown in Table S1.
2.7 Western blot analysis
Equal amounts of proteins were subjected to sodium dodecyl sulfate-polyacrylamide gel electrophoresis, then transferred onto polyvinylidene fluoride membrane and immunoblotted with specific primary antibodies as described previously (Guo et al., 2019; Li et al., 2018). Primary antibodies are listed in Table S2.
2.8 BMSCs culture and induction
For primary BMSCs acquisition, both femurs and tibiae were flushed out of bone marrow with F12/DMEM. The medium containing the crude bone marrow was centrifuged and resuspended in F12/DMEM. Then cells were plated into dishes and cultured in a humidified 5% CO2 incubator at 37°C. After 24 h, the medium containing nonadherent hematopoietic cells were removed and replaced by a fresh medium. Third passage cells were used for experiments.
To induce lineage commitment, BMSCs were seeded on 12 wells plate at 1 × 10⁵/well and cultured with BMP4 (10 ng/mL) for 3 days (day 0). To induce osteogenic differentiation, BMSCs (day 0) were cultured in F12/DMEM with 10% FBS, 10 nmol/L dexamethasone, 0.2 mmol/L l-ascorbic acid and 10 mmol/L β-glycerophosphate for 14 days.
2.9 C3H10T1/2 cells culture and induction
To verify the result in BMSCs, C3H10T1/2 cells, a typical mesenchymal stem cell line, was used to perform osteogenic differentiation. C3H10T1/2 cells were cultured in DMEM containing 10% calf serum. To induce lineage commitment, C3H10T1/2 cells were seeded at 30% confluence and incubated with BMP4 (10 ng/mL) until 2-day postconfluence (day 0). To induce osteogenic differentiation, C3H10T1/2 cells (day 0) were cultured in DMEM with 10% FBS, 10 nmol/L dexamethasones, 0.2 mmol/L l-ascorbic acid, and 10 mmol/L β-glycerophosphate for 14 days. To investigate the function of chemerin on C3H10T1/2 cells osteogenesis, chemerin (100 ng/ml) with or without MK2206 (0.1 μM) was administrated throughout induction. To study the function of chemerin on osteogenic genes and Akt/Gsk3β/β-catenin axis, cells were treated with chemerin (100 ng/ml) with or without MK2206 (0.1 μM) for 3 days.
2.10 Alizarin red S staining
BMSCs and C3H10T1/2 cells were induced as described above. On day 14, the cells were washed with PBS and fixed with 4% paraformaldehyde for 1 h, then washed with deionized water. After that, fixed cells were incubated with Alizarin red S (ARS) solution (1% in 0.1 mol/L Tris–HCl, pH 9.0) for 1 h, then washed with water. The stained calcium nodules were captured by light microscopy. The positive area of ARS staining was quantified using Image Pro Plus 6.0 software.
2.11 Glucose and insulin tolerance test
For glucose tolerance test (GTT), mice were injected intraperitoneally with d-glucose (2 mg/g body weight) after overnight fasting, and blood glucose was monitored at indicated time points (0, 30, 60, 90, and 120 min). For the insulin tolerance test (ITT), mice were injected intraperitoneally with insulin (0.75 mU/g body weight) after 4 h fasting, and blood glucose was monitored at indicated time points (0, 15, 30, 45, and 60 min).
2.12 Quantification of serum chemerin
The serum chemerin was assessed by ELISA kit from R&D System (Cat. DY2325; R&D Systems) and was performed according to the instruction.
2.13 Statistical analysis
All data were presented as means ± SEM and analyzed in GraphPad Prism 7 (GraphPad). Comparisons between two groups were analyzed using the unpaired two-tailed Student's t test. Pearson correlation coefficient analysis was used to evaluate the correlation between the relative expression of genes. p < .05 indicates statistical significance. All experiments were repeated at least three times.
3 RESULTS
3.1 Chemerin was decreased in obese mice bone
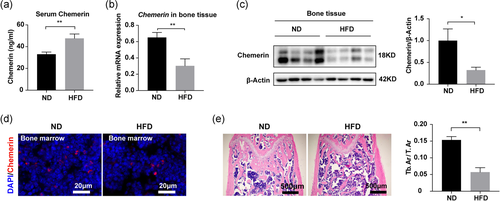
To address the role of chemerin in bone metabolism, we detected the expression of chemerin in the normal-chow diet (ND) and high-fat diet (HFD) male mice. We found in HFD mice, serum chemerin was increased (Figure 1a), while in bone tissue, chemerin expression was decreased (Figure 1b-c). Immunofluorescence confirmed the decrease of chemerin in HFD mice bone marrow (Figure 1d). H&E staining showed fewer trabecular bone in HFD mice (Figure 1e). The mRNA expression of chemerin in bone tissue was positively correlated with osteogenic genes (Table S3). The body weight and bone marrow adipocytes (BMAs) were significantly increased in HFD mice (Figure S1). These data suggested that chemerin expression in bone tissue correlated with bone metabolism.
3.2 Bone mass and osteogenesis decreased in Rarres2 −/− mice
To evaluate the function of chemerin in bone metabolism in vivo, we used Rarres2 −/− mice. The knockout of chemerin in Rarres2 −/− mice was confirmed by qRT-PCR, Western blot analysis, ELISA, and immunofluorescence approaches (Figure S2a–e). µCT showed that Rarres2 −/− mice had fewer trabecular bone than LM mice (Figure 2a), including vBMD, BV/TV, Tb. Th, Tb. N (Figure 2b). There was no difference in cortical vBMD between LM and Rarres2 −/− mice, while cortical thickness (Ct. Th) was significantly decreased in Rarres2 −/− mice (Figure S2f). There was also no difference in body weight, subcutaneous adipose tissue (SAT) weight, and visceral adipose tissue (VAT) weight between LM and Rarres2 −/− mice (Table S4). These data suggested that chemerin deficiency led to decreased bone mass.
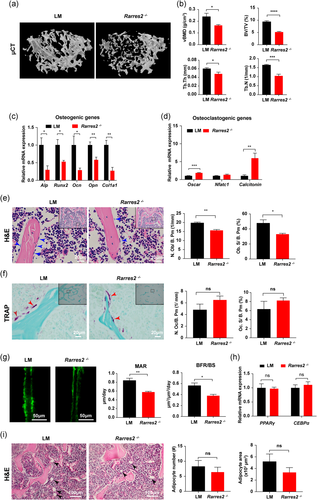
The osteogenic genes were decreased (Figure 2c), while osteoclastogenic genes were increased in Rarres2 −/− mice bone (Figure 2d). Correspondingly, the osteoblast number reduced in Rarres2 −/− mice by measuring the osteoblast number and surface per bone perimeter in the distal femur (Figure 2e). However, osteoclast number and surface per bone surface did not show the difference in LM and Rarres2 −/− mice (Figure 2f). Furtherly, the decreased mineral apposition rate (MAR) and bone formation rate per bone surface (BFR/BS) confirmed the reduced osteoblast number and activity in Rarres2 −/− mice (Figure 2g). Since chemerin is mainly produced by adipocytes, we evaluated the adipogenic genes and BMAs and found no difference between LM and Rarres2 − /− mice bone (Figure 2h, i). These results suggested that chemerin deficiency impairs osteogenesis.
3.3 Bone mass and osteogenesis increased in Rarres2 TG mice
To further discover the function of chemerin in bone metabolism, Ap2-drive Rarres2 transgenic mice were constructed to determine whether chemerin overexpression could increase bone mass. The reason why chemerin overexpression in an Ap2-drive way is that BMAs are direct cell source for chemerin expression in bone marrow. Chemerin overexpression was verified (Figure S3a-e). µCT showed TG mice had a higher trabecular bone than LM mice (Figure 3a), including vBMD, BV/TV, Tb. Th, and Tb. N (Figure 3b). Cortical vBMD was not changed between LM and TG mice, while the cortical thickness was increased in TG mice (Figure S3f). The body weight, SAT and VAT have no difference between LM and TG mice (Table S4). These results indicated that chemerin overexpression increases bone mass.
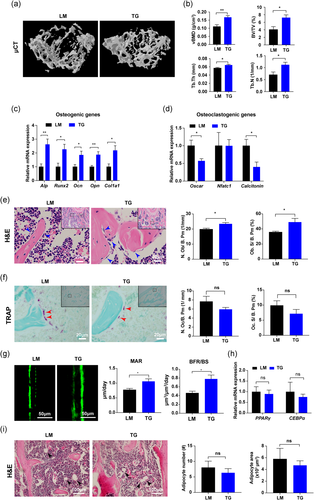
In TG mice, the osteogenic genes were significantly upregulated (Figure 3c), whereas osteoclastogenic genes were decreased (Figure 3d). Osteoblast number and surface were increased in TG mice (Figure 3e), while there was no difference in osteoclast number and surface between LM and TG mice (Figure 3f). Higher MAR and BFR/BS were observed in TG mice (Figure 3g). No difference was observed in adipogenic genes and BMAs between LM and TG mice bone (Figure 3h, i). The data from TG mice further confirmed that chemerin overexpression promotes osteogenesis in vivo.
3.4 Chemerin promoted osteogenic differentiation of MSCs
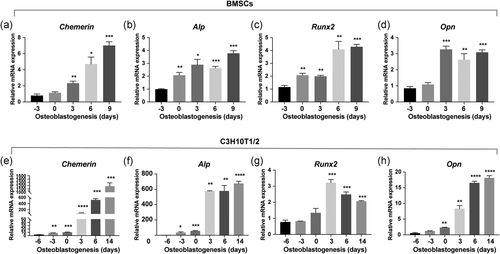
To elucidate whether chemerin plays a role in osteogenic differentiation of MSCs, we profiled the chemerin expression patterns in MSCs during osteogenic differentiation. We found chemerin was significantly upregulated with the increase of osteogenic genes during osteogenic differentiation of BMSCs (Figure 4a–d). In another mesenchymal stem cell line C3H10T1/2 cells, we observed the same expression trend of chemerin during osteogenic differentiation (Figure 4e–h).
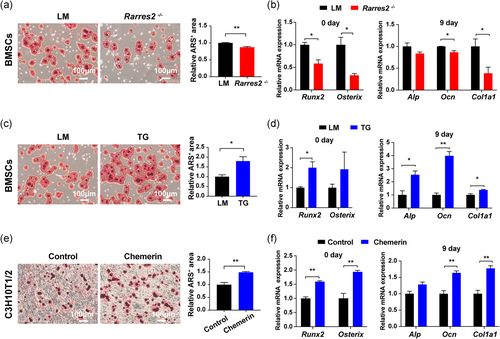
To further verify the function of chemerin in osteogenic differentiation, we used primary BMSCs from Rarres2 −/− and TG mice. Fourteen days after osteogenic induction, the mineralized nodules were significantly decreased (Figure 5a) and the expression of early osteogenic transcription factors Runx2 and Osterix on day 0, later osteogenic genes Alp, Ocn, Col1a1 on day 9 were reduced in Rarres2 −/− BMSCs (Figure 5b). While the corresponding ARS staining and osteogenic genes were increased in TG BMSCs (Figure 5c, d). In C3H10T1/2 cells, the treatment of recombinant chemerin increased mineral deposition (Figure 5e) and osteogenic genes (Figure 5f). These results indicated that chemerin promotes osteogenic differentiation of MSCs.
3.5 Chemerin promoted osteogenic differentiation through Akt/Gsk3β/β-catenin pathway
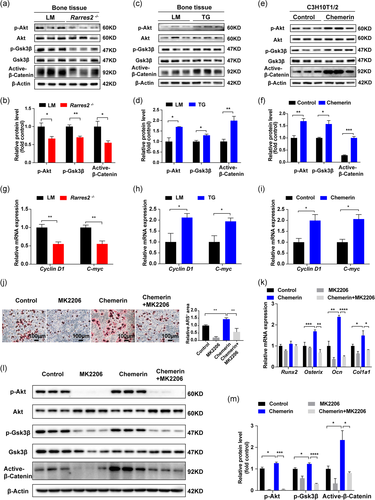
To explore the mechanism of chemerin promoting osteogenic differentiation, we detected the downstream molecules of chemerin signaling (Figure S4a, b; Inci et al., 2016; Jiang et al., 2018). We found Akt signaling decreased in Rarres2 −/− mice bone (Figure 6a, b) and increased in TG mice bone (Figure 6c, d). β-catenin, a critical factor in osteogenic differentiation, could be degraded by Gsk3β/Axin/APC complex (J. Zhao et al., 2017). p-Akt inhibits Gsk3β activation through phosphorylation at ser9. Thus, two signaling pathways, β-catenin and Akt, are linked by Gsk3β. Indeed, we found that active-β-catenin was decreased in Rarres2 −/− mice (Figure 6a, b) and increased in TG mice (Figure 6c, d). Further experiments showed, Gsk3β phosphorylation at ser9 decreased in Rarres2 −/− mice (Figure 6a, b) and increased in TG mice (Figure 6c, d). To further verify the promotion effect of chemerin on Akt/Gsk3β/β-catenin axis, recombinant chemerin was used in C3H10T1/2 cells, and the result showed that recombinant chemerin promoted Akt/Gsk3β/β-catenin axis (Figure 6e, f). The target genes of β-catenin (Cyclin D1 and C-myc) were decreased in Rarres2 −/− mice bone, while were increased in TG mice and chemerin pretreated C3H10T1/2 cells (Figure 6g–i). Meanwhile, the administration of chemerin increased calcium deposition and osteogenic genes in C3H10T1/2 cells, which can be offset by MK2206 (Akt inhibitor; Figure 6j, k). And the promoting effect of chemerin on Akt/Gsk3β/β-catenin axis can also be blocked by MK2206 (Figure 6l, m). These results verified that chemerin promoted osteogenic differentiation via Akt/Gsk3β/β-catenin axis.
4 DISCUSSION
Bone homeostasis is affected by various factors, such as hormones, mechanical loading, and energy balance (Rudman et al., 2019; Zhang et al., 2018; L. J. Zhao et al., 2008). Most attentions have been focused on the association between energy balance and bone metabolism (Kanazawa, 2017). Studies have shown that serum chemerin increased in the state of energy excess, such as obesity and nonalcoholic fatty liver disease (Buechler et al., 2019; Helfer & Wu, 2018; Sell et al., 2010), and was correlated with BMD (Engin-Ustun et al., 2016). In this study, we found that both mRNA and protein levels of chemerin were decreased in obese mice bone, which had a lower bone mass. And the expression of chemerin in bone tissue positively correlated with osteogenic genes, which suggested that the level of serum chemerin was not consistent with that in bone, and the observational studies in clinics described the correlation between serum chemerin and BMD could not conclude causal connections. According to the inconsistent of chemerin in serum and bone, we speculate that chemerin, mainly from the bone marrow, is involved in bone metabolism. And the previous study reported that adipokines (e.g., adiponectin and leptin) decreased chemerin expression (Conde et al., 2011). Therefore, we suspect the discrepancy between increased adipocytes and decreased chemerin in obese mice bone might be related to the adipokine network and microenvironment in the bone marrow of obesity. The detailed mechanism of why chemerin decreased in obesity bone needs further exploration. The previous studies suggested that BMAs directly communicate with osteoblasts and modify bone homeostasis by paracrine (Cornish et al., 2018; Scheller et al., 2016). In the current study, we hypothesized that chemerin located in bone marrow, rather than in serum, mainly affects bone metabolism in a paracrine manner.
In the present study, both the loss- and gain-of-function evidence supported that chemerin promoted bone formation, and this effect attributed to the promotion of osteogenic differentiation of MSCs. The phenotypes observed in Rarres2 −/− and TG mice were consistent with the previous in vivo findings in CMKLR1−/− and GPR1−/− mice (J. Li et al., 2017; H. Zhao et al., 2019). Although CMKLR1 and GPR1 are just the receptors of chemerin, these consistent results in ligand (chemerin) and receptors (CMKLR1 and GPR1) deficiency mice could confirm each other. However, Muruganandan et al. (2010) reported that chemerin promoted adipogenesis and inhibited osteoblastogenesis in MSCs. Their experiments showed that chemerin increased with adipogenesis of MSCs, while CMKLR1 and CCRL2 decreased, which is consistent with our adipogenesis model (Figure S5). However, they did not detect the expression of chemerin during osteogenic differentiation of MSCs. In the current study, we found that chemerin increased consistently during osteogenic differentiation in BMSCs and C3H10T1/2 cells, which indicated chemerin works over the whole course of osteogenic differentiation. Furthermore, our functional studies supported chemerin promotes osteogenic differentiation. Considering the complex microenvironment in bone marrow, the effects of chemerin on osteoblastogenesis may interact with other factors; and it could be the reason why our result is inconsistent with the previous in vitro study. Though chemerin is closely related to adipogenesis in vitro (Goralski et al., 2007), we did not find the change of adipose tissue in Rarres2 −/− and TG mice under normal-chow diet as well as our previous work (Huang et al., 2020). It might because the previous study by Goralski et al. (2007) did in vitro, and the effect of chemerin on adipogenesis is a protective response to energy excess.
Since we observed that chemerin expression increased during osteogenic differentiation, whether Ap2+ cells overexpression chemerin regulate chemerin expression in osteoblasts in a paracrine manner is a very interesting topic to be explored. And the further generation of TG mice with chemerin overexpression in osteoblasts might further represent the role of chemerin in the bone.
The regulation of osteoblasts and osteoclasts often coupled with each other. Since macrophages and osteoclasts are both differentiated from monocytes and chemerin can recruit macrophages through CMKLR1 (Mariani & Roncucci, 2015), chemerin might affect osteoclasts. Herein, we found osteoclastogenic genes increased significantly and osteoclast numbers showed an increased trend in Rarres2 −/− mice, while TG mice showed opposite results. This trend of osteoclast inhibition by chemerin was similar to the previous result that osteoclast differentiation increased in CMKLR1−/− mice (H. Zhao et al., 2019). This may be related to the chemotaxis and polarization of mononuclear macrophages by chemerin, but the promoting effect was not so strong. Further work should be done to confirm this finding and explore the inner mechanism.
Chemerin activates Erk, P38 MAPK, Akt pathway reported previously (Goralski et al., 2007; Kaur et al., 2010; Ma et al., 2018). However, we did not find differences in Erk and P38 in Rarres2 −/− and TG mice bone. We assume that even though chemerin activating Erk, p38, Akt pathway, the effects might be tissue and cell-specific. β-catenin, the core molecule for Wnt signaling, could be degraded by Gsk3β/Axin/APC complex (Wu & Pan, 2010). The phosphorylation of Gsk3β could inactivate the complex, thus stabilize β-catenin. Here, we found that chemerin increased Akt phosphorylation in bone, which in turn increased the phosphorylation of Gsk3β and stabilized β-catenin. Though Akt is crucial for insulin sensitivity, there is no difference in GTT and ITT in Rarres2 −/− and TG mice under a normal-chow diet (Figure S6). We suspected other pathways played a compensatory role or there could be some antagonistic mechanism to keep it.
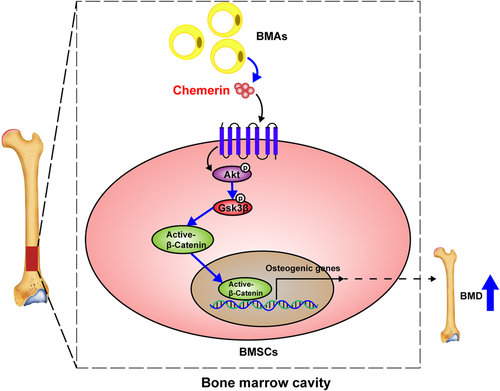
In summary, we found that chemerin promotes osteogenic differentiation and bone formation in vivo and in vitro via activating Akt/Gsk3β/β-catenin axis (Figure 7), and this promoting effect attributes to the chemerin in bone marrow locally, not in the serum. Our findings provide new insight into the effects of chemerin on bone metabolism, and chemerin might be a new potential target for the prevention and treatment of osteoporosis.
ACKNOWLEDGMENTS
This study was supported by the National Key R&D Program of China (2018YFA0800400 to X.L.), National Natural Science Foundation of China, China (81770861, 31571401 and 82070899 to X.L.), Chongqing Science and Technology Foundation, China (cstc2018jcyjAX0232 to X.L.), the Science and Technology Research Program of Chongqing Municipal Education Commission (KJZD-K201800402 to X.L.).
AUTHOR CONTRIBUTIONS
J.L. and X.L. designed the study and experiments. JL and TZ performed most of the experiments and wrote the manuscript. C.H., M.X., W.X., Q.P., and X.X. provided the contribution and assistance to the animal feeding, material acquisition, and reagent preparation. B.W. and X.L. analyzed data and revised the manuscript. X.L. takes the responsibility for the integrity of this study.
CONFLICT OF INTERESTS
The authors declare that there are no conflict of interests.
Open Research
DATA AVAILABILITY STATEMENT
The data that support the findings of this study are available from the corresponding author upon reasonable request.


