p120-catenin suppresses proliferation and tumor growth of oral squamous cell carcinoma via inhibiting nuclear phospholipase C-γ1 signaling
Abstract
p120-catenin (p120) serves as a stabilizer of the calcium-dependent cadherin-catenin complex and loss of p120 expression has been observed in several types of human cancers. The p120-dependent E-cadherin-β-catenin complex has been shown to mediate calcium-induced keratinocyte differentiation via inducing activation of plasma membrane phospholipase C-γ1 (PLC-γ1). On the other hand, PLC-γ1 has been shown to interact with phosphatidylinositol 3-kinase enhancer in the nucleus and plays a critical role in epidermal growth factor-induced proliferation of oral squamous cell carcinoma (OSCC) cells. To determine whether p120 suppresses OSCC proliferation and tumor growth via inhibiting PLC-γ1, we examined effects of p120 knockdown or p120 and PLC-γ1 double knockdown on proliferation of cultured OSCC cells and tumor growth in xenograft OSCC in mice. The results showed that knockdown of p120 reduced levels of PLC-γ1 in the plasma membrane and increased levels of PLC-γ1 and its signaling in the nucleus in OSCC cells and OSCC cell proliferation as well as xenograft OSCC tumor growth. However, double knockdown of p120 and PLC-γ1 or knockdown of PLC-γ1 alone did not have any effect. Immunohistochemical analysis of OSCC tissue from patients showed a lower expression level of p120 and a higher expression level of PLC-γ1 compared with that of adjacent noncancerous tissue. These data indicate that p120 suppresses OSCC cell proliferation and tumor growth by inhibiting signaling mediated by nuclear PLC-γ1.
Abbreviations
-
- BrdU
-
- bromodeoxyuridine
-
- EGF
-
- epidermal growth factor
-
- EGFR
-
- epidermal growth factor receptor
-
- IP3
-
- inositol triphosphate
-
- OSCC
-
- oral squamous cell carcinoma
-
- p120
-
- p120-catenin
-
- PI3K
-
- phosphatidylinositol 3-kinase
-
- PIKE
-
- phosphatidylinositol 3-kinase enhancer
-
- PIP3
-
- phosphatidylinositol trisphosphate
-
- PIP2
-
- phosphatidylinositol bisphosphate
-
- PKC-ζ
-
- protein kinase C-ζ
-
- PLC-γ1
-
- phospholipase C-γ1
1 INTRODUCTION
Oral cancer is the eighth most common cancer worldwide and accounts for nearly 3–5% of all cancer cases in the world (Torre et al., 2015). Squamous cell carcinoma (SCC) originating in the mucosa accounts for more than 90% of oral cancers (Samuel & Marshall, 2003). In spite of the improvement of medical treatments for oral squamous cell carcinoma (OSCC) in recent years, the 5-year survival rate is still low, about 60%, because of the high rates of metastasis and recurrence (Amit et al., 2013). Therefore, understanding the mechanism of OSCC development and designing novel therapeutic strategies are desperately needed.
p120-catenin (p120) functions as a stabilizer of the E-cadherin/catenin complex and plays an important role in cell-cell adhesion as well as intracellular signaling (Davis, Ireton, & Reynolds, 2003; Fukumoto, Shintani, Reynolds, Johnson, & Wheelock, 2008; Ireton et al., 2002; Xiao et al., 2003; Xie & Bikle, 2007; Xie et al., 2017; Xie, Tang, Man, Shrestha, & Bikle, 2018). It has been shown that decreased plasma membrane expression of p120 correlates with the occurrence, development, and prognosis of various types of cancers, such as cancers of the prostate, esophagus, bladder, and breast (Chen et al., 2015; Kallakury, Sheehan, & Ross, 2001; Silva Neto et al., 2008; Talvinen et al., 2010; Wijnhoven, Pignatelli, Dinjens, & Tilanus, 2005). Knockdown of p120 in various tumor cell lines induces cell proliferation and invasion (Liu et al., 2009; Macpherson et al., 2007; Yanagisawa & Anastasiadis, 2006). Conditional knockout of p120 leads to hyperplasia or neoplasias in the epidermis, oral cavity, esophagus, and forestomach with an inflammatory microenvironment (Perez-Moreno et al., 2006; Perez-Moreno, Song, Pasolli, Williams, & Fuchs, 2008; Stairs et al., 2011) and with decreased differentiation and increased proliferation (Stairs et al., 2011). Conditional knockout of p120 blocks dietary calcium-suppressed oral carcinogenesis resulting from increased oral epithelial proliferation and decreased dietary calcium-induced oral epithelial differentiation (Xie et al., 2017). These observations suggest that p120 plays a critical role in suppressing the occurrence and development of tumors in squamous epithelium. However, the underlying mechanism is unclear.
Epidermal growth factor receptor (EGFR) is overexpressed in more than 95% of patients with OSCC (Grandis & Tweardy, 1993; Ishitoya et al., 1989). Ligand-dependent activation of EGFR stimulates multiple downstream signaling pathways, including phospholipase C-γ1 (PLC-γ1; Wells, 1999). Our previous studies have shown that the phosphorylated PLC-γ1 enters the nucleus to bind to phosphoinositide 3-kinase enhancer (PIKE) that enhances the activity of nuclear class Ia phosphoinositide 3-kinase (PI3K), which in turn, triggers signal cascades leading to OSCC cell proliferation in response to epidermal growth factor (EGF; Xie et al., 2010). On the other hand, the p120-dependent E-cadherin-catenin complex and subsequent activation of PI3K and PLC-γ1 in the plasma membrane are shown to be required for calcium-induced keratinocyte differentiation (Xie & Bikle, 2007). In this case, it is phosphatidylinositol trisphosphate (PIP3) in the membrane that leads to PLC-γ1 activation rather than EGFR (Xie, Singleton, Bourguignon, & Bikle, 2005), and the activated but non phosphorylated PLC-γ1 remains in the membrane where it plays an important role in calcium signaling. Based on these observations, we hypothesized that p120 suppresses proliferation and stimulates differentiation of OSCC cells via its maintenance of the E-cadherin-catenin complex in the membrane, directing PLC-γ1 activation by PIP3 rather than EGFR, thus inhibiting signaling mediated by nuclear PLC-γ1. To test this hypothesis, we used a knockdown approach to reduce expression levels of p120, PLC-γ1 or both p120 and PLC-γ1 in an OSCC cell line (Tca-8113) in vitro and in a xenograft mouse model, to examine the relationship between p120 and PLC-γ1 signaling pathways.
2 MATERIALS AND METHODS
2.1 Immunohistochemistry
Human OSCC specimens were collected from 91 patients undergoing primary resection of OSCC at the Second Xiangya Hospital of Central South University in China. All of the patients were diagnosed with OSCC. The experiments with human specimens were approved by our institutional ethics committee. The paraffin-embedded tissue was cut to 5 μm sections. The sections were stained with the antibody against p120 or PLC-γ1 (Santa Cruz Biotechnology, Santa Cruz, CA) using a biotinylated UltraSensitiveTM SP kit (Maixin Biotechnology Fuzhou, China) and then counterstained with hematoxylin.
2.2 Cell lines and culture
Human tongue SCC cell lines Tca-8113 and SCC4 were obtained from American Type Culture Collection and identified via STR-based method by Shanghai Bogoo Biotechnology Co., Ltd in 2013. Free of mycoplasma infection in cells was confirmed by the MycoTest Kit (Shanghai Seo Biotechnology Co., Ltd). Cells were passaged for 10 to 30 times for experiments as described in the methods. The culture medium used in the experiment includes Roswell Park Memorial Institute 1640 medium (Gibco, New York, NY), containing 10% fetal bovine serum, 100 units/ml penicillin and 100 μg/ml streptomycin.
2.3 RNA isolation and quantitative real-time polymerase chain reaction
Total RNA was isolated from normal human tongue keratinocytes, Tca-8113 cells and SCC4 cells using TRIzol reagent (Invitrogen, Carlsbad, CA), and 1 μg of RNA was reversely transcribed to complementary DNA (cDNA) using iScript (TaKaRa Bio Inc., Ostu, Japan) according to the manufactures’ instructions. The cDNA was amplified by real-time polymerase chain reaction (PCR) using a SYBR Green RT-PCR Kit (TaKaRa) and specific primers. Mitochondrial Ribosomal Protein L19 was used as the internal control.
2.4 Oligonucleotides, plasmid, and cell transfection
Oligonucleotides were chemically synthesized by Shanghai Sangon Biotechnology (Shanghai, China) according to sequences of p120 small interfering RNA (siRNA) 5′-CUCCCAAUGUUGCCAACAAUA-3′ (sense), 5′-UAUUGUUGGCAACAUUGGGAG-3′ (antisense); PLC-γ1 siRNA 5′-GAGCAGUGCCUUUGAAGAA-3′ (sense), 5′-UUCUUCAAAGGCACUGCUC-3′ (antisense). The control siRNA (with unknown target gene for commercial reasons) and GL2 siRNA (targeting luciferase gene) were used as the negative controls. To construct expression vectors containing short hairpin RNA (shRNA), p120 shRNA, or PLC-γ1 shRNA were chemically synthesized, annealed, and inserted into the linearized hU6/GFP/puromycin and H1/RFP/hygromycin shRNA Expression Vector (GeneChem, Shanghai, China).
To reduce the level of p120 or PLC-γ1, cultured Tca-8113 cells at 40% confluency were transfected with siRNA for p120 or PLC-γ1, both p120 and PLC-γ1, or a negative control at a concentration of 100 nM using HiperFect tranfection reagent (Qiagen, Leipzig, Germany) according to the manufacturer's protocol. To generate Tca-8113 cells stably expressing p120 shRNA, cells were transfected with 8 μg of p120 shRNA plasmid or control shRNA plasmid using 16 μl HiperFect transfection reagent, and cultured for 24 hr without antibiotic selection, followed by selection with 10 μg/ml of puromycin. These cells were named with p120 shRNA cells and control shRNA cells, respectively. To obtain Tca-8113 cells stably expressing both p120 shRNA and PLC-γ1 shRNA, cells expressing p120 shRNA were further transfected with PLC-γ1 shRNA plasmid or control shRNA plasmid using the above protocol. Cells were cultured in medium containing 500 μg/ml hygromycin B to select the antibiotic-resistant cells. These cells were named with p120 shRNA + PLC-γ1 shRNA cells and p120 shRNA + control shRNA cells.
2.5 Cell lysate preparation and western blot analysis
Total cell lysates were isolated by radioimmunoprecipitaion assay lysis buffer (50 mM HEPES, pH 7.4, 150 mM NaCl, 1 mM EDTA, 1% Triton X-100, 0.1% sodium dodecyl sulfate) containing 1% phenylmethylsulfonyl fluoride and Complete Protease Inhibitor Cocktail tablets (Roche, Indianapolis, IN). Plasma membrane and nuclear lysates were extracted using the Qproteome Cell Compartment Kit (Qiagen, Leipzig, Germany). Protein concentrations were determined by a bicinchoninic acid protein assay kit (Beijing Dingguo Changsheng Biotechnology, Beijing, China). Equal amounts of protein were used for western blot analysis with appropriate antibodies against p120, PLC-γ1, E-cadherin, β-catenin, integrin α2 (plasma membrane marker), PI3K p85, or nucleolin (Santa Cruz), PIKE or protein kinase C-ζ (PKC-ζ; Millipore, Billerica, MA), phosphorylated nucleolin (p-nucleolin, Abcam, Cambridge, MA), histone H3 (nuclear marker, Bioss, Beijing, China), glyceraldehyde 3-phosphate dehydrogenase (Southern Biotechnology Associates, Birmingham, AL), or β-actin (Abgent, San Diego, CA). Quantifications of proteins within the bands of interest were performed using Image-pro plus software 6.0 (Media Cybernetics). Each experiment was repeated 3 times.
2.6 Fluoresence immunostaining
Cell culture slides were fixed with 4% paraformaldehyde for 20 min at room temperature. After blocking with 5% bovine serum albumin for 1 hr at room temperature and rinsing with phosphte-buffered saline, cells were incubated with PLC-γ1 antibody or PIKE antibody (Covance customized) at 4°C overnight followed by a 30 min incubation with rhodamine-labeled goat antirabbit immunoglobulin G (IgG; KPL, Milford, MA) and fluorescein-5-isothiocyanate-labeled goat antimouse IgG (Santa Cruz) at room temperature. Cells were counterstained with 4′,6-diamidino-2-phenylindole and the cover slips were mounted with drops of glycerin. Images were acquired with an inverted confocal microscope.
2.7 Cell proliferation assays
The transfected cells were seeded at a density of 1 × 10⁴ cells/well in 96-well flat-bottom and cultured for 48 hr, then treated with EGF or vehicle at a concentration of 100 ng/ml for 24 hr. The proliferation assay was performed 6 hr following the addition of 5-bromo-2′-deoxy-uridine (BrdU) reagent (10 ng/ml) using BrdU Cell Proliferation Assay Kit (Millipore, Boston, MA). The absorbance values measured at 450 nm wavelength represented the rate of proliferating cells.
2.8 Immunocytochemistry
Tca-8113 cells were seeded in six-well plates (1 × 10⁵ cells/well) and transfected with siRNAs, and then treated with EGF or vehicle as described above. Four hours after addition of 10 ng/ml of BrdU, cells were fixed in 4% paraformaldehyde for 30 min at room temperature and incubated with a BrdU antibody (Origene, Rockville, MD) overnight at 4℃. Horseradish peroxidase-conjugated secondary antibody was then used. Results were visualized with diaminobenzidine, and the cells were counterstained with hematoxylin. Results are expressed as the proportion of positively nucleus stained cells over the total number of cells examined. These experiments were repeated three times with comparable results.
2.9 Xenograft tumor models in nude mice
The animal protocol was approved by the Animal Ethics Committee of Central South University. Female Balb/C nude mice (4–5 week-old) purchased from the animal center of Shanghai Biological Science Institution (Shanghai, China) were raised in the SPF-class facility. A total number of 1 × 10⁶ cells were injected subcutaneously into each flank of nude mice. There were five mice in each group. p120 shRNA cells or control shRNA cells were injected into each flank of the mouse in Group 1. Tca-8113 cells were injected into each flank of the mouse in Group 2. p120 shRNA + PLC-γ1 shRNA cells and p120 shRNA + control shRNA were injected in each flank of the mouse in Group 3. When the tumors became palpable, the PLC-γ1 siRNA or control siRNA and EntransterTM-in vivo reagent (EngreenBiosysten Co, Ltd., Beijing, China) were injected into the tumor at each flank of the mouse in Group 2 twice a week according to the manufacturer's instructions. Tumor volumes ([length × width2 × π]/6) were examined twice a week for 3 consecutive weeks. Mice were given an intraperitoneal injection of BrdU at a dosage of 10 mg/kg 4 hr before euthanization. Tumor tissues were collected for immunohistochemical assays as described above to determine expression levels of p120, PLC-γ1, PIKE, PI3K-p85, PKC-ζ, nucleolin, p-nucleolin, keratin 1, filaggrin, loricrin (Biolegend Dedham, MA), involucrin (Abcam, Cambridge, MA), Ki67 (Millipore, Billerica, MA), and BrdU. Slides were viewed and photographed under a light microscope (Olympus DP72, Tokyo, Japan) at ×400 magnification, and analyzed using Image-Pro Plus software version 6.0 (Media Cybernetics, Rockville, MD) as described previously (Ingels et al., 2017).
2.10 Statistical analysis
All statistical analyses were performed with SPSS 16.0 (SPSS, Inc, Chicago, IL). Results were expressed as mean ± standard deviation. The Mann–Whitney U test was used to compare differences between two groups. Comparisons of tumor volumes in the animal studies were tested for statistical difference by the paired t test. Statistical significance was defined as p < .05.
3 RESULTS
3.1 OSCC tissue displayed a lower expression level of p120 and a higher expression level of PLC-γ1 than that of adjacent noncancerous tissue
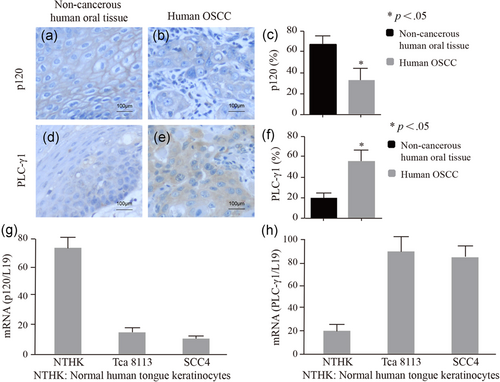
We have previously demonstrated that p120 and PLC-γ1 in the plasma membrane are required for calcium-induced keratinocyte differentiation and PLC-γ1 in the nucleus is required for EGF-induced proliferation in SCC cells. To determine the expression and cellular localization of p120 and PLC-γ1 in human OSCC tissue, we performed immunohistochemical analysis of human OSCC tissue using an antibody against p120 or PLC-γ1. The results showed a reduced level of plasma membrane staining of p120 in OSCC tissue compared with that in the adjacent noncancerous tongue epithelium. In contrast, OSCC tissue displayed an enhanced level of cytoplasmic staining of PLC-γ1 than that of adjacent noncancerous tissue (Figure 1a–f). To determine the expression levels of p120 and PLC-γ1 in cell lines and primary cells used in the experiment, real-time PCR was performed with cDNA reversely transcribed from mRNA isolated from normal human tongue keratinocytes, Tca-8113 or SCC4 cells. The results showed that the expression of p120 in Tca-8113 and SCC4 cells was significantly lower than that in normal human tongue keratinocytes and the expression of PLC-γ1 in Tca-8113 and SCC4 cells was significantly higher than that in normal human tongue keratinocytes (Figure 1g,h).
3.2 Knockdown of p120 in SCC cells potentiated EGF-induced nuclear PLC-γ1 signaling and proliferation
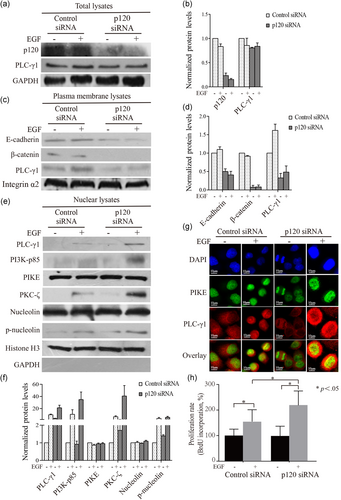
Our previous studies have shown that activation of p120-dependent signaling induces plasma membrane localization of PLC-γ1. In contrast, activation of EGFR induces nuclear localization of PLC-γ1. Based on these observations, we hypothesized that both the p120-dependent pathway and the EGFR-dependent pathway would compete for PLC-γ1 activation, thus affecting SCC proliferation. To test this hypothesis, Tca-8113 cells were treated with p120 siRNA or control siRNA for 3 days and then with EGF at a concentration of 100 ng/ml or vehicle. Cells were harvested for isolation of cellular fractions or examined by confocal microscopy.The results showed that p120 was reduced by over 70% by p120 siRNA. Knockdown of p120 had little effect on the total level of PLC-γ1 (Figure 2a,b). However, knockdown of p120 resulted in a decrease in the levels of E-cadherin, β-catenin, and PLC-γ1 in the plasma membrane (Figure 2c,d), indicating that p120 is required for the plasma membrane localization of the E-cadherin-catenin complex and PLC-γ1 in Tca-8113 cells. Furthermore, knockdown of p120 in Tca-8113 cells potentiated EGF-induced increase in the levels of PLC-γ1, PI3K, PKC-ζ and p-nucleolin in the nuclear lysates (Figure 2e,f), indicating that p120 reduces PLC-γ1-dependent signaling in the nucleus. The results also showed that knockdown of p120 in Tca-8113 cells enhanced EGF-induced colocalization (yellow) of PLC-γ1 and PIKE in the nucleus (overlay images, Figure 2g). To confirm results obtained with the Tca-8113 cell line, we used another OSCC cell line SCC4 in the experiment. The results showed that knockdown of p120 enhanced EGF-induced increase in the levels of PLC-γ1 and the PLC-γ1-PIKE complex in the nuclear lysate (data not shown). To examine whether p120 regulates SCC cell proliferation, BrdU incorporation assay was performed. The results showed that EGF-induced Tca-8113 cell proliferation and that this induction was potentiated when p120 was reduced (Figure 2h). These results suggest that p120 suppresses EGF-induced nuclear signaling and OSCC cell proliferation.
3.3 Knockdown of PLC-γ1 in OSCC cells blocked p120-suppressed EGFR signaling leading to cell proliferation
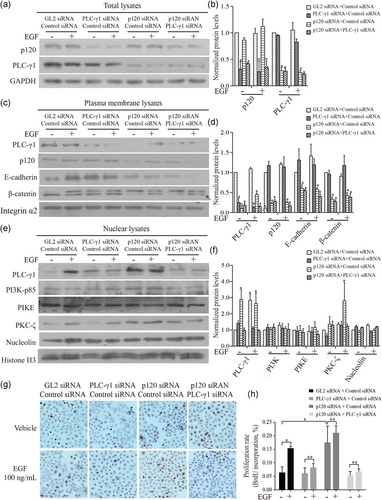
To determine whether PLC-γ1 plays a role in p120-suppressed Tca-8113 cell proliferation in vitro, Tca-8113 cells were treated with one of the siRNA combinations (PLC-γ1 siRNA + control siRNA, p120 siRNA + control siRNA, p120 siRNA + PLC-γ1 siRNA, or GL2 siRNA + control siRNA) for 3 days. To be in accordance with the design of double knockdown of two genes, we had our control group treated with two different negative control siRNAs (GL2 siRNA + control siRNA). Cells were harvested 7 min after adding EGF for isolation of total cell lysates or cellular fraction lysates. The results showed that siRNA for p120 or PLC-γ1 reduced the expression of p120 or PLC-γ1 over 70% in Tca-8113 cells, respectively (Figure 3a,b). Knockdown of p120 in Tca-8113 cells resulted in a decrease in the level of PLC-γ1 in the plasma membrane and potentiation of EGF-induced increases in PLC-γ1 and PKC-ζ in the nuclei (Figure 3c,d). However, the potentiation of EGF-induced nuclear PKC-ζ accumulation by p120 knockdown was blocked by knockdown of PLC-γ1 (Figure 3e,f). These data suggest that PLC-γ1 is required for p120-suppressed EGFR signaling. The proliferation of these Tca-8113 cells was then determined by BrdU incorporation 24 hr after EGF treatment (Figure 3g,h). The results showed that knockdown of PLC-γ1 blocked EGF-induced Tca-8113 cell proliferation and proliferation induced by p120 knockdown. These results were confirmed with SCC4 cells (data not shown). These results suggest that p120 suppresses OSCC cell proliferation via inhibiting PLC-γ1 translocation to the nucleus.
3.4 Knockdown of p120 stimulated nuclear PLC-γ1 signaling leading to increased cell proliferation and tumor growth and decreased cell differentiation in vivo
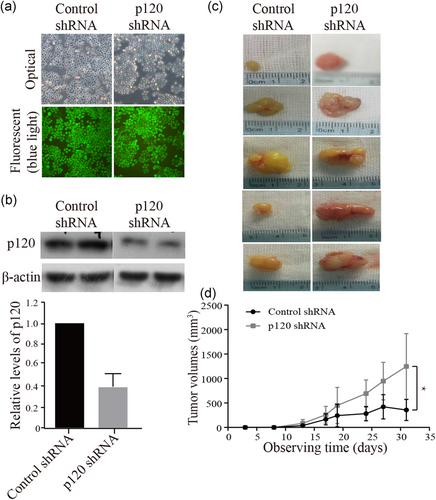
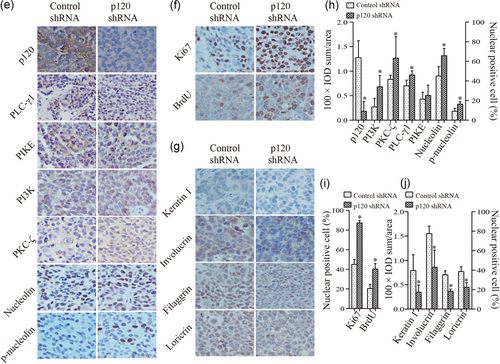
To examine the effect of p120 on tumor growth, tumor cell proliferation and differentiation in vivo, p120 shRNA or control shRNA was stably expressed in Tca-8113 cells. These cell lines were puromycin-resistant and emitted green fluorescence under blue light (Figure 4a). The results showed that the level of p120 was significantly decreased in cells expressing p120 shRNA (Figure 4b). Then, we injected p120 shRNA cells or control shRNA cells into each flank of the nude mouse (Group 1) and examined the tumor growth rates. During the subsequent 3-weeks, p120 knockdown tumors displayed higher growth rates and substantially larger size compared with that of control shRNA tumors, indicating that p120 suppresses tumor growth (Figure 4c,d). These results were confirmed with SCC4 cells (data not shown). We then examined levels of proliferation and differentiation markers and signaling molecules of nuclear PLC-γ1 in the tumor tissue by immunohistochemistry (Figure 4e–j). The results showed that the level of p120 was significantly lower in p120 knockdown tumors than that in control tumors. The levels of nuclear PLC-γ1, nucleolin and phosphorylated nucleolin, and the levels of PI3K and PKC-ζ were significantly higher in p120 knockdown tumors than that in control tumors, although PIKE showed no significant difference between two groups. These data were consistent with those in the in vitro studies. Furthermore, the levels of proliferation markers (Ki67 and BrdU) in p120 knockdown tumors were higher, and the levels of differentiation markers including keratin 1, involucrin, filaggrin, and loricrin in p120 knockdown tumors were lower than that in control tumors. These results were confirmed with SCC4 cells (data not shown). These data indicate that p120 suppresses nuclear PLC-γ1 signaling and OSCC proliferation and tumor growth and stimulates OSCC differentiation.
3.5 Knockdown of PLC-γ1 blocked p120 knockdown-induced promotion of tumor cell proliferation and growth and suppression of tumor cell differentiation in xenograft tumor models
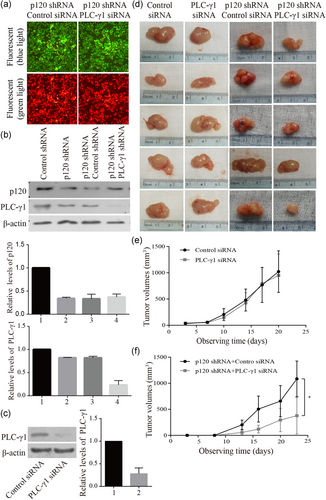
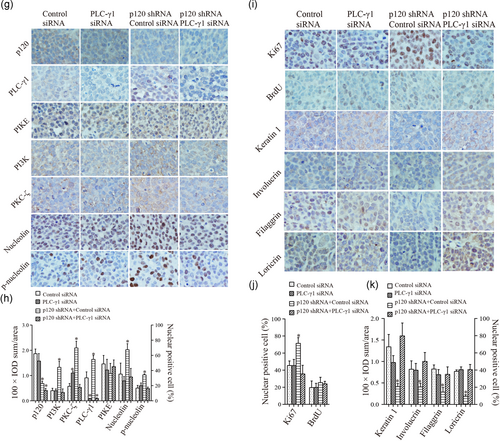
To determine whether PLC-γ1 mediates the inhibitory effect of p120 on OSCC cell proliferation and tumor growth and the stimulatory effect of p120 on Tca-8113 cell differentiation in vivo, we prepared stable cell lines of p120 shRNA + PLC-γ1 shRNA cells and p120 shRNA + control shRNA cells (Figure 5a). The results of the western blot analysis showed that p120 or PLC-γ1 expression levels were significantly reduced in p120 shRNA + control shRNA cells or in p120 shRNA + PLC-γ1 shRNA cells (Figure 5b). The knockdown efficiency of PLC-γ1 siRNA in Tca-8113 cells was shown in Figure 5c. The established p120 shRNA + control shRNA cells or p120 shRNA + PLC-γ1 shRNA cells were subcutaneously injected into each flank of the nude mouse (Group 3) to evaluate whether PLC-γ1 plays a role in p120 suppression of OSCC in vivo. Moreover, we prepared another group of nude mice bearing Tca-8113 cell xenograft tumors in the bilateral flanks of the nude mouse (Group 2) that received intra-tumor injections of PLC-γ1 siRNA or control siRNA to determine the effect of PLC-γ1 knockdown alone on OSCC tumor growth. The results showed that knockdown of PLC-γ1 abrogated the p120 knockdown-induced tumor growth, but knockdown of PLC-γ1 alone had little effect on tumor growth (Figure 5d–f). These results were confirmed with SCC4 cells (data not shown). To determine whether PLC-γ1 is required for p120-suppressed proliferation, the expression of PLC-γ1, cell proliferation and differentiation were examined in tumors in which the levels of PLC-γ1 and p120 were reduced. The results (Figure 5g–k) showed that the p120 and PLC-γ1 knockdown tumors displayed decreased nuclear levels of PLC-γ1, nucleolin, and p-nucleolin, overall levels of PI3K and PKC-ζ, reduced levels of proliferation markers (Ki67) and higher levels of differentiation markers (keratin 1, involucrin, filaggrin, and loricrin) than that in p120 only knockdown tumors. In contrast, knockdown of PLC-γ1 alone did not have any effect on tumor cell proliferation and differentiation in the tissue. These data were confirmed with SCC4 cells (data not shown). These data suggest that PLC-γ1 mediates both the inhibitory effects of p120 on OSCC cell proliferation and tumor growth and stimulatory effects on OSCC cell differentiation.
4 DISCUSSION
In the present study, we examined whether PLC-γ1 is required for p120 suppression of OSCC proliferation and tumor growth and stimulation of OSCC differentiation. Our results showed that knockdown of p120 potentiated EGF-induced increase of PLC-γ1 and PLC-γ1 mediated signaling in the nucleus, enhanced tumor growth and cell proliferation, and suppressed tumor cell differentiation in vitro and in vivo. Knockdown of PLC-γ1 abolished effects of p120 knockdown. These data support our hypothesis that PLC-γ1 plays a critical role in p120 suppression of OSCC growth and proliferation and stimulation of OSCC differentiation.
An association between loss of p120 and poor prognosis of various types of cancer, including esophageal SCC has been demonstrated previously (Chen et al., 2015). The relationships between high expression levels of PLC-γ1 and poor survival outcomes in patients with advanced OSCC or with breast cancer have also been demonstrated (Lattanzio et al., 2013; Zhu et al., 2014). Thus, loss of p120 and high expression levels of PLC-γ1 could be potential prognostic biomarkers for patients with malignant tumors, but the exact relationship of p120 and PLC-γ1 is yet to disclose. Consistent with studies with esophageal SCC and non-small cell lung carcinoma (Lehman, Yang, Welsh, & Stairs, 2015; Ucvet et al., 2011), our study showed a reduction of p120 expression and an increase in PLC-γ1 expression in carcinoma tissues from patients with OSCC, compared with those in the adjacent noncancerous tissue. In our previous studies, increased expression of PLC-γ1 and PIKE and decreased expression of E-cadherin and p120 have been demonstrated to be associated with the aggressiveness of OSCC (Jiang et al., 2015), supporting the hypothesis that the mechanism by which p120 suppresses OSCC proliferation involves PLC-γ1.
Many studies have demonstrated that p120 plays a vital role in suppressing cell proliferation (Davis & Reynolds, 2006; Perez-Moreno et al., 2006). However, the underlying mechanism is unclear. The results from our present studies showed that knockdown of p120 potentiated EGF-induced OSCC cell proliferation, and this potentiation was blocked by PLC-γ1 knockdown in cultured OSCC cells and xenograft OSCC tumors. These results indicate that p120 suppresses OSCC cell proliferation and tumor growth via PLC-γ1. We have previously demonstrated that PLC-γ1 mediates extracellular calcium-induced keratinocyte differentiation. We proposed a model that in keratinocytes cultured in high extracellular calcium, p120-dependent E-cadherin-catenin complex recruits phosphatidylinositol 4-phosphate 5-kinase, and PI3K to the plasma membrane to promote formation of phosphatidylinositol bisphosphate (PIP2) and then PIP3 which recruits to and activates PLC-γ1 at the plasma membrane. PLC-γ1 at the plasma membrane then hydrolyzes PIP2 to inositol triphosphate (IP3) and diacylglycerol. IP3 promotes intracellular calcium mobilization which triggers keratinocyte differentiation (Xie & Bikle, 1999, 2007; Xie, Chang, Pennypacker, Liao, & Bikle, 2009). On the other hand, PLC-γ1 in the nucleus mediates EGF-induced proliferation of keratinocytes (Peng et al., 2012). Following the phosphorylation and activation of PLC-γ1 by EGF, PLC-γ1 translocates to the nucleus to bind to PIKE which enhances the activity of nuclear PI3K leading to cell proliferation (Xie et al., 2012). PLC-γ1 binds to PIKE probably via the SH3 domain but not the lipase domain according to our previous studies (Xie, Chen, Pennypacker, Zhou, & Peng, 2010; Xie et al., 2010). According to these observations, PLC-γ1 appears to promote proliferation or differentiation, depending on its cellular location. PLC-γ1 in the nucleus promotes cell proliferation. In contrast, PLC-γ1 in the plasma membrane promotes cell differentiation. The present study showed that knockdown of p120 potentiated EGF-induced accumulation of PLC-γ1, PI3K-p85, PKC-ζ, and phosphorylated nucleolin as well as formation of the PLC-γ1-PIKE complex in the nucleus of OSCC cells. We also found an accumulation of PLC-γ1, nucleolin and phosphorylated nucleolin in the nucleus of tissue from xenograft tumors in which p120 was reduced. However, knockdown of PLC-γ1 abolished a number of these changes induced by knockdown of p120 in cultured OSCC cells and xenograft tumors, suggesting that PLC-γ1 is essential for p120 regulated events in OSCC.
In keratinocytes, calcium-dependent p120 is critical for the formation of the E-cadherin-catenin complex as part of its means of promoting differentiation of these cells. Similarly we have shown that dietary calcium promotes differentiation of oral epithelium, concomitant with an increase of p120 and a decrease in PLC-γ1 expression (Jiang et al., 2015). These effects were abolished by knockout of p120, indicating that p120 is required for dietary calcium-induced differentiation of oral keratinocytes (Xie et al., 2017). In the present study, we used a mouse xenograft model injected with OSCC cells and found that tumors deficient in p120 displayed increased proliferation, which was prevented by knockdown of PLC-γ1, suggesting that p120 and PLC-γ1 have opposite effects on OSCC proliferation.
Our results showed that knockdown of PLC-γ1 did not affect the proliferation and differentiation of xenograft tumors. These results are inconsistent with previous studies indicating that PLC-γ1 is required for OSCC cell proliferation (Oh et al., 2003; Shrestha et al., 2016; Xie & Bikle, 1999; Xie et al., 2010). The reason for these discrepancies is unclear but might be due to other factors compensating for the effect of PLC-γ1 knockdown.
In the present studies, the results failed to show an increase in the nuclear PI3K and PKC-ζ expression in tumor cells with p120 knockdown until treated with EGF. This suggests that the phosphorylation of PLC-γ1 by EGFR and its subsequent translocation into the nucleus is required for the expression of these nuclear signaling events as also implied by the dependency of p120 knockdown on proliferation and PLC-γ1.
Previous studies have shown that conditional knockout of p120 in the squamous epithelium resulted in increased proliferation and tumor growth in the tissue (Perez-Moreno et al., 2006; Perez-Moreno et al., 2008), indicating that p120 plays a pivotal role in OSCC growth and proliferation. The mechanism by which p120 suppresses OSCC proliferation appears to require PLC-γ1 according to our present studies, although we cannot exclude the possibility that other signaling pathways, such as nuclear factor-kB signaling (Perez-Moreno et al., 2006; Perez-Moreno et al., 2008) also play a role. Because of the interaction of p120 with E-cadherin-catenin complex in the plasma membrane, and the role of this complex in shuttling PLC-γ1 to the membrane where it promotes differentiation, we favor the possibility that the p120 suppression of tumor growth and proliferation is dependent on maintenance of the E-cadherin-catenin complex. Further investigations are needed to determine the relationship between nuclear PLC-γ1 signaling and the role E-cadherin-catenin complex plays in p120 suppression of OSCC growth and proliferation.
ACKNOWLEDGMENTS
This work was supported by the grants 81072219, 81272973, 81471055, and 81672646 from the National Natural Science Foundation of China and grants 1R03DE018001, 1R21DE019529-01A2, and R01AR050023 from NIH.
CONFLICT OF INTERESTS
The authors declare that there are no conflict of interests.
Open Research
DATA AVAILABILITY STATEMENT
The data that support the findings of this study are available from the corresponding author upon reasonable request.


