KIF15 promotes the evolution of gastric cancer cells through inhibition of reactive oxygen species-mediated apoptosis
Jinqiu Tao, Guangli Sun, Qing Li, and Xiaofei Zhi contributed equally to this study.
Abstract
Kinesin family member 15 (KIF15) is a member of the kinesin superfamily of proteins, which promotes cell mitosis, participates in the transport of intracellular materials, and helps structural assembly and cell signaling pathways transduction. However, its biological role and molecular mechanisms of action in the development of gastric cancer (GC) remain unclear. In the present study, an integrated analysis of The Cancer Genome Atlas (TCGA), Gene Expression Omnibus database, and Kaplan–Meier plotter database was performed to predict the expression and prognostic value of KIF15 in GC patients. Detection of KIF15 expression in GC cells and tissues was performed by a quantitative polymerase chain reaction. In vitro cell proliferation, viability, colony formation ability and flow cytometry assays, and in vivo tumorigenicity assay, were performed to evaluate the effects of KIF15 knockdown on GC cell phenotype. It was demonstrated that the expression of KIF15 messenger RNA in GC tissues was significantly higher compared with that in adjacent tissues, and was closely associated with larger tumor size and poor patient prognosis. In addition, functional studies demonstrated that, due to the increase in reactive oxygen species (ROS) generation, the interference with the expression of KIF15 not only decreased cell proliferation but also increased cell apoptosis and induced cell cycle arrest. ROS-mediated activation of c-Jun N-terminal kinase/c-Jun signaling reduced cell proliferation by regulating the GC cell cycle and increasing apoptosis. Taken together, the results of the present study indicate that KIF15 is an oncoprotein contributing to GC progression, and is expected to help identify novel biomarkers and treatment targets in GC.
1 INTRODUCTION
Gastric cancer (GC) is one of the most common malignant tumors worldwide, with 1,033,701 new cases diagnosed annually and a 5-year survival rate of only 20% (Bray et al., 2018). Although there has been a great improvement in cancer diagnosis and comprehensive treatment techniques, tumor progression and metastasis are the main causes of the high mortality rate among GC patients (Gao et al., 2009; Gupta & Massague, 2006). Although a series of oncogenes and tumor suppressors have been identified in recent years, the underlying molecular mechanisms have not yet been fully elucidated.
In recent years, with the improved understanding of the mechanisms underlying tumor cell division and proliferation, the role of the skeletal dynamic protein system in tumor pathogenesis of and drug resistance has been attracting increasing attention, particularly the kinesin superfamily (KIFs), which is dependent on microtubules in tumor cells (Vale & Milligan, 2000; Wood, Cornwell, & Jackson, 2001). The KIF protein activity is mostly ATP-dependent and can provide the driving force for the movement of the microtubule-dependent plus-end (Florian & Mayer, 2011; J. Wang, Guo, Xie, & Jiang, 2017). KIF15 is a member of the kinesin superfamily of proteins, which promotes cell mitosis, participates in the transport of intracellular materials, and helps structural assembly and cell signaling pathway transduction (Miki, Okada, & Hirokawa, 2005; Zhong, Tan, & Yang, 2016). Moreover, previous studies have demonstrated that KIF15 also plays an important role in mitosis, cell cycle arrest, and cell growth and differentiation (Qiu et al., 2017; Vale & Milligan, 2000; Zhong et al., 2016). An increasing number of studies report that KIF15 is closely associated with malignant tumors, including breast, pancreatic, and lung cancer (Scanlan et al., 2001; J. Wang et al., 2017; Yokota et al., 2012). These findings indicate that KIF15 may play a role in tumor development as a transcription regulator of different genes. However, the molecular biology mechanisms behind the function of KIF15 in GC remain unclear.
Reactive oxygen species (ROS) are a by-product of normal oxygen metabolism and play an important role in signal transduction and cellular homeostasis (Kamata et al., 2005; Z. Zhang et al., 2016). A moderately elevated ROS level can promote the growth and proliferation of tumor cells by regulating ROS-related signaling pathways, such as the growth factor pathway. However, excessive ROS production can cause oxidative stress, DNA damage, lipid, and protein oxidation, and result in cell cycle arrest and cell apoptosis (Engel & Evens, 2006; Hampton & Orrenius, 1997; Kumar, Koul, Khandrika, Meacham, & Koul, 2008; Ozben, 2007; Trachootham, Alexandre, & Huang, 2009; Wu et al., 2013). Cell cycle arrest at the G0/G1 phase is associated with cell injury, partly due to the accumulation of ROS (Jiang, Wang, & Hu, 2017; S. Wang, Hu, Yan, Cheng, & Liu, 2018).
The aim of the present study was to assess the role and molecular mechanism underlying the effect of KIF15 on the phenotype of GC cells, and determine the role of ROS accumulation and the c-Jun N-terminal kinase (JNK)/c-Jun axis in this process. The results will hopefully reveal new biomarkers and treatment targets in GC.
2 MATERIALS AND METHODS
2.1 Bioinformatics analysis
Gene expression data of GC patients were obtained from The Cancer Genome Atlas (TCGA; https://cancergenome.nih.gov/), Gene Expression Omnibus (GEO; https://www.ncbi.nlm.nih.gov/geo/), and Kaplan–Meier plotter (http://kmplot.com/analysis/) databases. The Kaplan–Meier plotter database revealed that GSE62254 exhibited markedly different characteristics (longer survival, shifted expression) compared with the other datasets; therefore, it was suggested to exclude this dataset when collectively evaluating all samples (Szasz et al., 2016). Genes with an expression fold change of ≥1.8 and a p < .05 were selected.
2.2 Clinical samples
Among patients who underwent GC resection at the Affiliated Hospital of Nantong University, 60 pairs of primary GC and adjacent tissues were collected. The patients had no underlying diseases, and GC was not treated before surgery. To use these tissue specimens for medical research, written informed consent was obtained from the patients, and the study protocol was approved by the Ethics Committee of the Affiliated Hospital of Nantong University. In all cases, two experienced pathologists performed diagnosis and staging, based on the eighth edition of the American Joint Committee on Cancer staging system (Sun et al., 2018).
2.3 Reagents and antibodies
Anti-CDK4 (12790, RRID:AB_2631166), anti-CDK6 (3136, RRID:AB_2229289), anti-cyclin D1 (2978, RRID:AB_2259616), anti-Bcl-2 (15071, RRID:AB_2744528), anti-Bax (5023, RRID:AB_10557411), anti-caspase-3 (9662, RRID:AB_331439), anti-p-JNK (4668, RRID:AB_823588), anti-JNK (9252, RRID:AB_2250373), anti-β-actin (3700, RRID:AB_2242334), anti-mouse immunoglobulin G horseradish peroxidase (IgG HRP; 7076, RRID:AB_330924), and anti-rabbit IgG HRP (7074, RRID:AB_2099233) antibodies were purchased from Cell Signaling Technology Inc.; anti-cyclin E (sc-247, RRID:AB_627357), anti-c-Jun (sc-74543, RRID:AB_1121646), and anti-p-c-Jun (sc-822, RRID:AB_627262) antibodies were purchased from Santa Cruz Biotechnology Inc.; and anti-KIF15 (SAB2104083, HPA035517, RRID:AB_10669303, AB_10671935) antibody was obtained from Sigma-Aldrich; Merck KGaA. The reagents used included N-acetyl-L-cysteine (NAC), obtained from Sigma-Aldrich; Merck KGaA; and TRIzol, obtained from Invitrogen; Thermo Fisher Scientific Inc. Roswell Park Memorial Institute-1640 (RPMI-1640) and fetal bovine serum were purchased from Gibco; Thermo Fisher Scientific Inc.; and SP600125 was obtained from Beyotime.
2.4 Cell lines and cell culture
The human GC cell lines and GES-1 were purchased from the Chinese National Human Genome Center at Shanghai. The culture medium for cells was RPMI-1640 containing 10% fetal bovine serum. All media were supplemented with 100 U/ml penicillin and 100 μg/ml streptomycin (Invitrogen; Thermo Fisher Scientific Inc.). Cells were incubated in a humidified chamber with 5% CO2 at 37°C.
2.5 RNA extraction and quantitative reverse transcription polymerase chain reaction
According to the manufacturer's instructions, total RNA was extracted from tissues and cells using TRIzol reagent and was reverse-transcribed into cDNA by PrimeScript RT Kit (Takara). Messenger RNA (mRNA) expression was detected by quantitative reverse transcription-polymerase chain reaction (RT-qPCR) assay using SYBR Premix Ex Taq (Takara) according to the manufacturer's instructions. All the primers used in RT-qPCR were as follows: KIF15, forward: 5′-AAAACTGAGTTACGCAGCGTG-3′ and reverse: 5′-AGTTGCGAATACAGATTCCTGAG-3′. β-Actin, forward: 5′-AGAGCCTCGCCTTTGCCGATCC-3′ and reverse: 5′-CTGGGCCTCGTCGCCCACATA-3′. All procedures were performed in triplicate.
2.6 Short hairpin RNA and lentiviral transfection
Small interfering RNAs against KIF15 were chemically synthesized (GenePharma Co.). The sequence of siKIF15 was GACUGUACUUAAGGGAGCAUAUCAAdTdT (sense) and UUGAUAUGCUCCCUUAAGUACCGUCdTdT (antisense); the sequence of the negative control (NC) siNC was as follows: UUCUCCGAACGUGUCACGUTT (sense) and ACGUCACACGUUCGGAGAATT (antisense). The oligonucleotides encoding short hairpin RNAs (shRNAs) were designed and synthesized by GenePharma and inserted into Vector p-SUPER (OligoEngine). The sequence of shKIF15 was as follows: GATCCCCGACTGTACTTAAGGGAGCATATCAATTCAAGAGATTGATATGCTCCCTTAAGTACAGTCTTTTTGGAAA (sense) and AGCTTTTCCAAAAAGACTGTACTTAAGGGAGCATATCAATCTCTTGAATTGATATGCTCCCTTAAGTACAGTCGGG (antisense). The sequence of shNC was as follows: GATCCCCTTCTCCGAACGTGTCACGTTTCAAGAGAACGTGACACGTTCGGAGAATTTTTGGAAA (sense) and AGCTTTTGGAAAAATTCTCCGAACGTGTCACGTTCTCTTGAAACGTGACACGTTCGGAGAAGGG (antisense). The construct was verified by sequencing. All shRNAs were infected by Lipofectamine 2000 (Invitrogen; Thermo Fisher Scientific Inc.) as per the manufacturer's instructions.
2.7 Cell proliferation, vitality assay, and colony formation assay
A total of 2,000 cells per well were inoculated into a 96-well plate, and the optical density of each hole was measured at 450 nm per day using Cell Counting Kit-8 (CCK-8; Dojindo Molecular Technologies Inc.). To detect the activity of the cells, the target cells were cultured for 48 hr, followed by inoculation of 5,000 cells per well in a 96-well plate and incubation for 12 hr. The purpose of the short incubation time before absorbance measurement was to avoid KIF15 regulation of proliferation. After transfection with shNC and shKIF15 for 48 hr, the cells were inoculated into a six-well plate and cultured for 2 weeks. The colonies were fixed with 75% ethanol and stained with crystal violet solution.
2.8 Detection of cell cycle and apoptosis by flow cytometry and of ROS by DCFH-DA staining
The cell cycle was analyzed by flow cytometry (FCM). First, the cells were cultured in a serum-free medium for 24 hr to induce cell cycle synchronization. FCM was used to analyze the cell cycle. DNA content was determined following 70% ethanol fixation, suspension in phosphate-buffered saline (PBS), RNase A (10 mg/ml) pretreatment for 30 min, and then propidium iodide (10 μg/ml) staining for 5 min (Tao et al., 2015). For the analysis of apoptosis, the cells were stained with a PE Annexin V Apoptosis Detection Kit I (559763, BD Pharmingen) according to the manufacturer's instructions, and detected by Fluorescence activated cell sorter (He et al., 2018). After treatment, the cells were washed three times with serum-free medium and incubated for 20 min with DCFH-DA (S0033, Beyotime Institute of Biotechnology) at 37°C. A green fluorescent filter was used for confocal microscopy analysis (Li et al., 2016).
2.9 Mitochondrial membrane potential assessment
Following transfection with shNC and shKIF15, the cells were inoculated into six-well plates and cultured overnight. The cells were then stained with JC-1 from the Mitochondrial Membrane Potential Detection Kit (C2006, Beyotime Institute of Biotechnology) according to the manufacturer's protocol. Finally, the ratio of the red/green fluorescence was analyzed using confocal microscopy.
2.10 Mouse xenograft model of GC
Approximately 4 × 10⁶ GC cells were injected into the skin of 4-week-old male nude mice. The subcutaneous tumors were measured and weighed after 4 weeks. The size of the tumors was measured every 4 days by a caliper and the tumor volume was determined using the following formula: Tumor volume = (width2 × length)/2.
2.11 Immunohistochemical staining
All specimens used for immunohistochemical (IHC) staining was fixed in 4% formalin and embedded in paraffin. The paraffin blocks were then cut into 4-μm sections that were placed on glass slides and incubated with the anti-KIF15 antibody at 4°C overnight. Subsequently, the slides were rinsed three times with PBS and incubated with HRP polymer conjugated secondary antibody for 1 hr at 37°C. The slides were then stained with a 3,3′-diaminobenzidine solution for 3 min, counterstained with hematoxylin, and examined in a blinded manner. Images from three random fields were acquired for each sample using a microscope.
2.12 Western blot analysis
Target cells were washed three times with precooled PBS and the protein was collected after the whole protein cracking solution was added on ice for 10 min. Sodium dodecyl sulfate–polyacrylamide gel electrophoresis was performed after the protein extraction was quantified. After electrophoresis, the protein was transferred to polyvinylidene fluoride membranes. Then, 5% TBST buffer was added at room temperature for 1 hr, followed by incubation with primary antibodies at 4°C overnight, and with secondary antibodies at room temperature for 1 hr. Following incubation with secondary antibodies, the membranes were washed with TBST for 15 min, repeated three times. The protein bands were detected using an enhanced chemiluminescence detection system following the manufacturer's instructions.
2.13 Statistical analysis
The statistical software SPSS 19.0 (SPSS Inc.) was used for processing. All experiments were repeated at least three times. All data are shown as mean ± standard deviation. Student's t test was used to compare the two groups and Pearson's χ2 test was used for categorical data. A p < .05 was considered to indicate statistically significant differences.
3 RESULTS
3.1 KIF15 expression level is correlated with GC progression and associated with poor clinical outcome
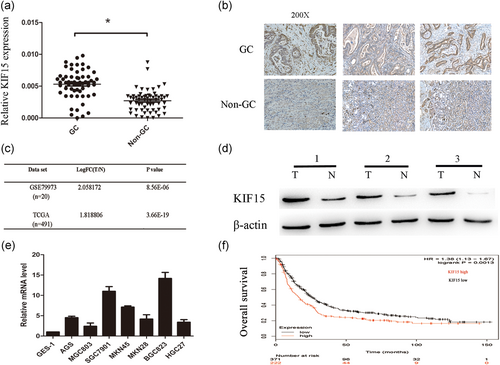
The expression level of KIF15 in 60 paired tumor tissues and corresponding adjacent tissues was analyzed by qPCR. The results revealed that the mRNA expression of KIF15 in tumor tissues was significantly increased compared with that in matched adjacent tissues (Figure 1a). To further verify the high expression of KIF15 in GC, IHC staining was employed and the results obtained were consistent (Figure 1b). Furthermore, KIF15 expression we analyzed using the microarray datasets previously published in TCGA and NCBI GEO (GSE79973). In these datasets, the expression of KIF15 in tumor tissue was significantly higher compared with that in normal tissue (Figure 1c). The KIF15 protein expression of six randomly matched GC samples is shown in Figure 1d. KIF15 mRNA expression was increased in all GC-derived cell lines compared with GES-1 (Figure 1e). In addition, data from the Kaplan–Meier plotter database revealed that patients with high KIF15 expression had shorter survival compared with those with low KIF15 expression (Figure 1f; Szasz et al., 2016). The clinicopathological characteristics of the 60 patients with GC are summarized in Table 1. The high expression of KIF15 was found to be closely associated with the size of the tumor and poor patient prognosis.
| Facto | KIF15 expression | p Value | |
|---|---|---|---|
| High group | Low group | ||
| Age (year) | |||
| <60 | 10 | 11 | |
| ≥60 | 27 | 12 | .101 |
| Gender | |||
| Male | 22 | 10 | |
| Female | 15 | 13 | .228 |
| Tumor size (cm) | |||
| <3 | 11 | 14 | |
| ≥3 | 26 | 9 | .017* |
| Histological type | |||
| Well moderately | 13 | 10 | |
| Poorly signet | 24 | 13 | .518 |
| T grade | |||
| T1 + T2 | 12 | 14 | |
| T3 + T4 | 25 | 9 | .031* |
| Lymph node metastasis | |||
| n0 | 15 | 12 | |
| n1-n3 | 22 | 11 | .379 |
| Stage | |||
| I, II | 7 | 13 | |
| III, IV | 30 | 10 | .003** |
- Abbreviations: GC, gastric cancer; KIF15, kinesin family member 15.
- * p < .05, **p < .01 statistically significant difference.
3.2 Knockdown of KIF15 inhibits proliferation and viability of GC cell lines in vitro
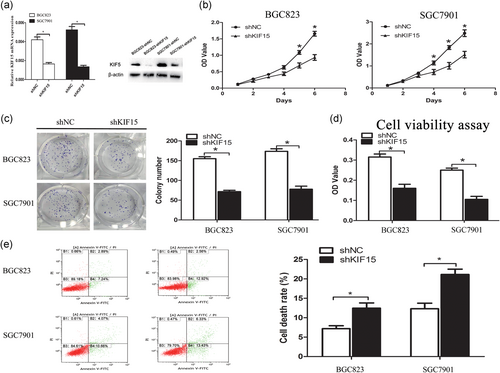
To assess the biological function of KIF15 in vitro in GC, the GC cell lines BGC823 and SGC7901 were stably transfected with shKIF15 and shNC to construct cell lines with stable KIF15 downregulation: BGC823-shKIF15, SGC7901-shKIF15, SGC7901-shNC, and BGC823-shNC.The expression of KIF15 was downregulated by shKIF15 transfection, verified by reverse transcription PCR and western blotting (Figure 2a). In addition, cell proliferation assay (Figure 2b) and plate colony formation assay (Figure 2c) proved that the proliferation ability of the cells was inhibited following KIF15 knockdown. The same results as above were obtained from the CCK-8 cell viability assay (Figure 2d). Furthermore, the apoptosis and necrosis rates increased significantly following KIF15 knockdown (Figure 2e). These data suggest that therapeutic KIF15 deficiency may improve the prognosis of GC patients.
3.3 KIF15 knockdown inhibits tumorigenicity in vivo
The tumorigenic potential of GC cells was evaluated in animals. Xenograft tumors were formed by injecting cells with or without KIF15 knockdown into the subcutaneous tissue of nude mice. BGC823 and SGC7901 cells with KIF15 interference were subcutaneously injected and the tumor size was measured every 4 days. After 3 weeks, the mice were killed, and the tumors were isolated and weighed. Over the same period, compared with BGC823-shNC and SGC7901-shNC mice, the mean size and weight of tumors formed from injected BGC823-shKIF15 and SGC7901-shKIF15 cells were significantly lower (Figure 3a,b). In addition, western blotting of mouse xenografts confirmed that c-caspase-3 protein expression was significantly enhanced in the transfected group compared with the control group; compared with the control group, the expression of the Bcl-2 protein was suppressed (Figure 3c). Terminal deoxynucleotidyl transferase dUTP nick end labeling analysis of mouse xenografts showed that the proportion of cell apoptosis was much higher in the transfected group compared with the control group (Figure 3d). All these data indicate that KIF15 plays a key role in GC tumorigenesis.

3.4 ROS accumulation induced by KIF15 inhibition is associated with in G0/G1 cell cycle arrest and apoptosis
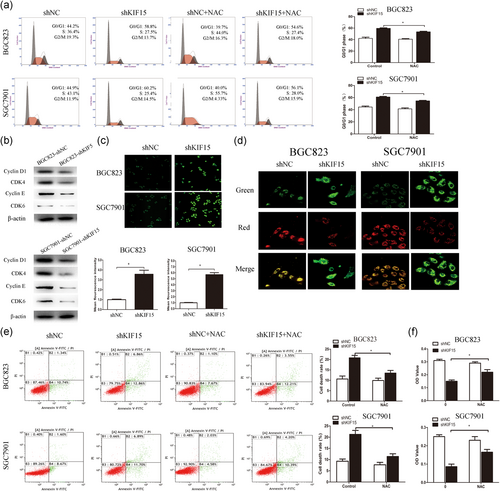
To investigate whether the effect of KIF15 knockdown on cell proliferation is associated with cell cycle arrest, the cell cycle was analyzed by FCM. It was observed that the downregulation of KIF15 expression led to G0/G1 cell cycle arrest (Figure 4a). These results suggest that the absence of KIF15 induced cell cycle arrest at the G0/G1 phase in GC cells, and the following data again confirmed these results. The expression of cyclin D1, cyclin E, CDK4, and CDK6 decreased significantly in the cells with KIF15 knockdown (Figure 4b), whereas silencing of KIF15 resulted in a significant increase in the ROS level (Figure 4c). JC-1 staining was used to detect the mitochondrial membrane potential. The ratio of green/red fluorescence increased significantly in the KIF15 knockdown cells. The results demonstrated a decrease of the mitochondrial membrane potential and mitochondrial damage (Figure 4d). In summary, inhibiting the expression of KIF15 may induce a decrease in the mitochondrial membrane potential and lead to ROS accumulation. To observe whether the decrease of cell proliferation and cell activity observed after downregulation of the expression of KIF15 were mediated by ROS, target cells were treated by NAC and analyzed by FCM. The results revealed that NAC prevented G0/G1 phase arrest and cell apoptosis (Figures 4a and 4e). The results of the cell viability assay were consistent with those of the FCM assay mentioned above (Figure 4f).
3.5 The ROS/JNK/c-Jun signaling axis is ectopically activated by ROS accumulation after KIF15 knockdown in GC cells
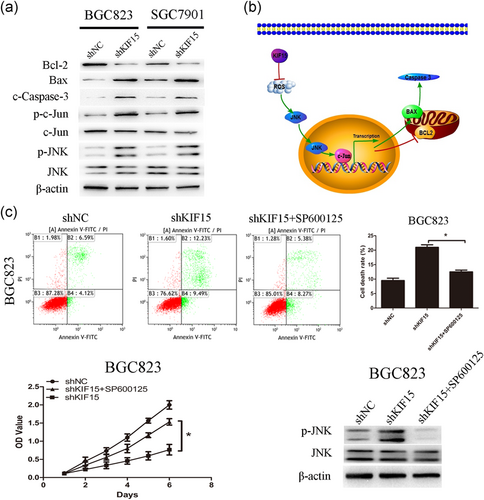
The results demonstrated that the expression of p-JNK and p-c-Jun increased significantly in KIF15-deficient cells. In addition, the downstream target genes associated with c-Jun also exhibited corresponding changes, such as Bcl-2 decrease, and Bax and caspase-3 increase. Of note, the total JNK and c-Jun expression levels were found to be almost unchanged (Figure 5a). To observe whether the effect on JNK signaling pathway activated by KIF15, target cells were treated by SP600125 and analyzed by cell proliferation assay, FCM assay and western blot (Figure 5c). The results revealed that SP600125 inhibited KIF15 induced JNK activation. These data indicated that knockdown of KIF15 may drive apoptosis through ROS/JNK/c-Jun signaling in GC.
4 DISCUSSION
The development of GC is closely associated with abnormal mitosis and proliferation of tumor cells (Correa, 2004; Shi, Qu, & Hou, 2014). Cell proliferation and apoptosis are among the physiological activities of the body. The regulation of cycle proteins and cell signaling is crucial for maintaining homeostasis (van der Meijden et al., 2002). Therefore, it is urgent to fully elucidate the mechanisms driving tumor cell division, proliferation and apoptosis, and to identify potential gene targets.
The KIF protein family plays an important role in various physiological cell functions, such as regulating the development of the nervous system, and promoting the memory and learning functions of the brain. Recently, emerging evidence has demonstrated that abnormal expression of drive proteins is closely associated with tumor development (Vale, 2003; Vale & Milligan, 2000; Wood et al., 2001; Zhong et al., 2016). KIF15 is a member of the KIF protein family, which promotes cell mitosis, participates in the transport of intracellular materials, and helps with structural assembly and cell signaling pathway transduction (Miki et al., 2005; Zhong et al., 2016). It has previously been reported that KIF15 is closely associated with the development of multiple tumors, such as breast and pancreatic cancer (J. Wang et al., 2017; Zou et al., 2014).
In the present study, it was confirmed that the expression of KIF15 was significantly higher in GC tissues compared with that in matched normal tissues, and the expression of KIF15 was closely associated with tumor progression and poor patient prognosis. The absence of KIF15 expression in vitro and in vivo significantly inhibited the proliferation and colony-forming ability of GC cells, induced apoptosis, and caused cell cycle arrest at the G0/G1 phase. These observations indicate that KIF15 likely acts as a tumor promoter.
ROS are the essential intermediate products of aerobic metabolism, and include superoxide anions, hydrogen peroxide and hydroxyl radicals (Cheong, Lee, Liu, Yeung, & Lee, 2009; Schrader & Fahimi, 2006). It was recently reported that the interaction between KIF proteins and ROS plays an important role in the regulation of cell apoptosis (Angelina et al., 2017). It has also been reported that cell cycle arrest at the G0/G1 phase is associated with cell injury, partly due to the accumulation of ROS (Jiang et al., 2017; S. Wang et al., 2018). It was also observed that ROS accumulation induced by KIF15 downregulation plays a key role in cell damage. Previous studies demonstrated that mitochondrial damage induces ROS accumulation (Kim et al., 2013; West et al., 2011). The damage caused by ROS accumulation is closely linked to G0/G1 cell cycle arrest (Pavithra, Mehta, & Verma, 2018). Poorly functioning mitochondria are the main source of ROS (Facundo, de Paula, & Kowaltowski, 2005; Li et al., 2016; West et al., 2011). Therefore, it may be inferred that KIF15 silencing may lead to mitochondrial damage and the accumulation of ROS, which can inhibit cell proliferation and promote apoptosis. This concept was tested using confocal microscopy. As expected, silencing of KIF15 resulted in a significant increase in the ROS level. Previous studies have reported that ROS initiated a rapid apoptotic process by activating the JNK/c-Jun pathway in colorectal cancer (D. Zhang et al., 2019). Although a moderately elevated ROS level can promote the growth and proliferation of tumor cells by regulating ROS-related signaling pathways, such as the growth factor pathway, excessive ROS production can cause oxidative stress, DNA damage, lipid and protein oxidation, there by leading to cell apoptosis and death (Engel & Evens, 2006; Kumar et al., 2008; Trachootham et al., 2009). As the second messenger, ROS participate in a number of signaling pathways and regulate gene expression (Ziech, Franco, Pappa, & Panayiotidis, 2011). ROS-mediated JNK signaling is an important part of the JNK signaling pathway, which plays a key role in the response to stress, such as inflammation and apoptosis (Mo, Shetti, & Wei, 2019; Wajant, Pfizenmaier, & Scheurich, 2003). c-Jun is an important member of the mitogen-activated protein kinase family, which is the main factor acting downstream of JNK (Ji, Gereau, Malcangio, & Strichartz, 2009). c-Jun was phosphorylated after the activation of JNK, which further promoted the expression of apoptosis-related proteins. Furthermore, the JNK/c-Jun signaling pathway plays a key role in regulating cell proliferation, differentiation, invasion, apoptosis, and tumor angiogenesis (Shaulian, 2010). The activated c-Jun can be combined with the promoter region of multiple target genes involved in cell cycle progression, cell apoptosis, and metabolism (Raman, Chen, & Cobb, 2007; Renault, Teijido, Antonsson, Dejean, & Manon, 2013; Zhou, Yang, & Xing, 2011). JNK can increase autophagy and apoptosis by activating the downstream signaling factor c-Jun and transcribing target genes caspase-3 and Bcl-2 (Oh et al., 2019; Wei, Pattingre, Sinha, Bassik, & Levine, 2008; D. Zhang et al., 2019). Mitochondria are the center of energy metabolism, and the most direct result of apoptosis is loss of normal mitochondrial function. The c-Jun transcription factor plays a key role in regulating apoptosis by decreasing the transcription of the antiapoptosis gene Bcl-2 (D. Zhang et al., 2019). Thus, it was hypothesized that knockdown of KIF15 could activate the JNK/c-Jun signaling pathway via accumulation of ROS in GC. Western blotting was used to detect the expression levels of JNK, p-JNK, c-Jun, p-c-Jun, and c-Jun-dependent genes, such as Bcl-2, Bax, and caspase-3. As expected, the expression of p-JNK, p-c-Jun, Bax, and caspase-3 was negatively correlated, whereas that of Bcl-2 was positively correlated, with the expression of KIF15.
In conclusion, KIF15 was found to be highly upregulated in GC tissues compared with paracancerous tissues, and was closely associated with larger tumor size and poor patient prognosis. In addition, functional studies demonstrated that interference with the expression of KIF15 not only decreases cell proliferation, but also increases cell apoptosis and causes cell cycle arrest, due to the accumulation of ROS. These cell phenotypes are mediated by ROS over production through the activation of the JNK/c-Jun signaling pathway (Figure 5b). On the basis of these results, KIF15 appears to bean oncoprotein that contributes to GC progression, and is expected to help identify new biomarkers and treatment targets in GC.
ACKNOWLEDGMENTS
This study was supported by the Key Project supported by Medical Science and Technology Development Foundation of Nanjing Department of Health (YKK16108, YKK15061, and YKK16078) and National Natural Science Foundation of China (81201909, 81572338, and 81672380).
CONFLICT OF INTERESTS
The authors declare that there are no conflict of interests.
AUTHOR CONTRIBUTIONS
W. Z., W. G., G. X., and J. T. conceived and designed the experiments. G. S. and Q. L. carried out experiments. X. Z. collected gastric cancer tissues. H. C., A. Z., Z. L., H. Z., and J. H. participated in statistical analysis and interpretation of data. J. T. wrote this manuscript. All authors read and approved the final manuscript.
Open Research
DATA AVAILABILITY STATEMENT
All the dataset and materials generated and/or analyzed during the current study are available.


