Purple sweet potato color attenuated NLRP3 inflammasome by inducing autophagy to delay endothelial senescence
Abstract
Autophagy is a vital negative factor regulating cellular senescence. Purple sweet potato color (PSPC), one type of flavonoid, has been demonstrated to suppress endothelial senescence and restore endothelial function in diabetic mice by inhibiting the nucleotide-binding oligomerization domain, leucine rich repeat and pyrin domain containing protein 3 (NLRP3) inflammasome. However, the roles of autophagy in the inflammatory response during endothelial senescence are unknown. Here, we found that PSPC augmented autophagy to restrict high-glucose-induced premature endothelial senescence. In addition, PSPC administration impaired endothelium aging in diabetic mice by increasing autophagy. Inhibition of autophagy accelerated endothelial senescence, while enhancement of autophagy delayed senescence. Moreover, deactivation of the NLRP3 inflammasome triggered by PSPC was autophagy-dependent. Autophagy receptor microtubule-associated protein 1 light chain 3 and p62 interacted with the inflammasome component NLRP3, suggesting that autophagosomes target the NLRP3 inflammasome and deliver it to the lysosome for degradation. Altogether, PSPC amplified cellular autophagy, subsequently attenuated NLRP3 inflammasome activity and finally delayed endothelial senescence to ameliorate cardiovascular complication. These results suggest a potential therapeutic target in senescence-related cardiovascular diseases.
1 INTRODUCTION
Endothelial senescence, a crucial contributor to the pathogenesis of age-related vascular diseases, has been observed in cardiovascular diseases such as atherosclerosis (Wang & Bennett, 2012), diabetes mellitus (Yokoi et al., 2006), heart failure (Gevaert et al., 2017), and hypertension (Durik et al., 2012). Numerous pathophysiological conditions including oxidative stress (Haendeler et al., 2004), inflammation (Liu, Wu, Ren, & Gu, 2011), hyperglycemia (Arunachalam, Samuel, Marei, Ding, & Triggle, 2014), and DNA damage initiate endothelial senescence. Although endothelial dysfunction/senescence in diabetes has been extensively investigated, the underlying mechanisms remain elusive.
It is well-established that senescent cells display an accumulation of hazardous components, which can be cleared by autophagy, a cleansing and reparative process to encompass and deliver cargoes to lysosomes for degradation (Rubinsztein, Mariño, & Kroemer, 2011). Autophagy starts from autophagosome formation, which requires class III phosphoinositide 3-kinase (PI3K) Vps34 to act with beclin-1 (Atg6), Atg14, and Vps15 (Rubinsztein et al., 2011). After the elongation of membranes, autophagosomes fuse with lysosomes to expose the biological “waste” to the lysosomal hydrolases. Numerous studies have revealed that decreased autophagy is closely associated with accelerated vascular endothelial senescence (Lee et al., 2015; Wohlgemuth, Calvani, & Marzetti, 2014), whereas stimulation of autophagy might have potent antiaging effects (Madeo, Tavernarakis, & Kroemer, 2010). However, opposite viewpoints have shown that premature aging results in increased autophagy (Marino et al., 2008; Oberley, Swanlund, Zhang, & Kregel, 2008) and that autophagy is required for the establishment of senescence (Young et al., 2009). These results suggest a complicated interplay between autophagy and senescence. Herein, we examined whether autophagy is involved in diabetes-induced premature endothelial senescence.
Senescent endothelial cells secrete types of cytokines that typify the proinflammatory/prothrombotic phenotype of the endothelium in atherosclerosis (Erusalimsky, 2009). The inflammatory responses and production of inflammatory cytokines are initiated by the inflammasome, a multiprotein complex that contains the nucleotide-binding oligomerization domain-like receptors (NLRs) family (Schroder & Tschopp, 2010; Zitvogel, Kepp, Galluzzi, & Kroemer, 2012), and nucleotide-binding oligomerization domain, leucine rich repeat and pyrin domain containing protein 3 (NLRP3) is a major contributor to inflammatory responses (Salminen, Kaarniranta, & Kauppinen, 2012). Once activated, NLRP3 interacts with the adaptor protein apoptosis-associated speck-like protein containing a CARD (ASC) and recruits procaspase-1 to assemble the NLRP3 inflammasome. Next, the proteolytic maturation of caspase-1 cleaves the inactive precursors of interleukin-1β (IL-1β) and IL-18 into mature bioactive cytokines. Numerous studies have shown that loss of autophagy or impaired autophagy leads to the hypersecretion of IL-1β and IL-18 (Saitoh et al., 2008), indicating the antagonism between autophagy and the NLRP3 inflammasome. However, divergent results have demonstrated that induced autophagy augments inflammasome-dependent IL-1β secretion (Dupont et al., 2011). In atherosclerosis, excessively stimulated autophagic activity leads to endothelial cell death to maintain the inflammatory status of the plaque (Martinet & De Meyer, 2009). These discrepancies emphasize the intertwined correlation of autophagy and the inflammasome. Moreover, with respect to endothelial senescence, the interaction between autophagy and the NLRP3 inflammasome during this process has not been clearly demonstrated, and further investigation is needed to elucidate the underlying mechanisms.
Our previous data reported that purple sweet potato color (PSPC), one flavonoid isolated from purple sweet potato, inhibited endothelial senescence by deactivating the NLRP3 inflammasome to ameliorate endothelial function in diabetes (Sun et al., 2015). In the present study, we further investigated whether autophagy is critical for mediating the antisenescent effect in endothelial cells. We also tested the correlation between autophagy and the NLRP3 inflammasome in the process of senescence and the potential mechanisms.
2 MATERIALS AND METHODS
2.1 Cell culture and drug treatment
Human umbilical vein endothelial cells (HUVECs) were purchased from ScienCell Research Laboratories (ScienCell, Carlsbad, CA) and cultured in M199 medium with 10% fetal bovine serum (Thermo Fisher Scientific, Rockford, IL). In the following experiments, we adopted cells within a population doubling level 10, which were deemed nonsenescent cells as previously reported (Rogers, Zhang, Azhar, Luo, & Wei, 2013; Sun et al., 2010). Vascular endothelial cells obtained from mice transfected with green fluorescent protein (GFP) labeled microtubule-associated protein 1 light chain 3β (LC3) were isolated as previously reported (Marelli-Berg, Peek, Lidington, Stauss, & Lechler, 2000). Isolated cells were identified using 1,1′-dioctadecyl-3,3,3′,3′-tetramethyl-indocarbocyanine perchlorate-labeled acetylated LDL (Dil-Ac-LDL) uptake, and the positive rate was approximately 90%. These cells were named GFP-LC3 ECs in the following research.
Cells were divided into four groups: (a) cells incubated in culture medium with 5.5 mM d-glucose (normal group), (b) cells treated with 30 mM d-glucose to promote premature senescence (d-glucose group; Hayashi et al., 2014), (c) cells administered with 30 mM d-glucose and 50 μg/ml PSPC to disrupt the process of senescence according to our previous research (PSPC + d-glucose group; Sun et al., 2015), and (d) cells treated with 50 μg/ml PSPC in normal medium (PSPC group). PSPC extracted by microwave baking and acidified electrolyzed water was purchased from Tsingtao Pengyuan Natural Pigment Research Institute (Qingdao, China). All treatments were maintained for 72 hr.
To investigate the role of autophagy during endothelial senescence, HUVECs were exposed to 3-methyladenine (3-MA; 5 mM; autophagy inhibitor) for 2 hr or bafilomycin A1 (25 nM; inhibitor of autophagic flux; Sigma-Aldrich, St. Louis, MO) for 6 hr, respectively, before glucose or/and PSPC administration. Rapamycin at a concentration of 10 nM was applied to enhance autophagy. Cells challenged with an equal dose of dimethyl sulfoxide were regarded as the vehicle control. After pretreatment, all the cells were divided into four groups and treated as described above.
2.2 Detection of LC3 punctiform aggregation
HUVECs were incubated with LC3 primary antibody (Cat #2775; RRID:AB_915950; Cell Signaling Technology, Danvers, MA) overnight at 4°C and then incubated with the appropriate secondary antibody. Cells were mounted with ProLong Gold Anti-fade Reagent with DAPI (Life technology, Eugene, OR). Endothelial cells (ECs) isolated from GFP-LC3 mice were fixed and mounted with 4′,6-diamidino-2-phenylindole (DAPI). The ImageJ software (https://imagej.nih.gov/ij/) was utilized to quantify cells with LC3 dotted-distribution and determine the number of LC3 puncta.
2.3 Mouse model of diabetes
A diabetic mouse model was established as previously described (Sun et al., 2015). Briefly, 8-week-old male Institute of Cancer Research mice, which can be induced with type II diabetes mellitus by a high-fat diet (HFD; Li et al., 2012; Shan et al., 2014), were purchased from the Branch of National Breeder Center of Rodents (Beijing, China) and housed under conditions of constant temperature (23 ± 1°C) and humidity (60%), and a 12 hr light/dark schedule. After acclimatization, mice were randomly divided into the control group, HFD group, HFD + PSPC group, and PSPC group. Mice were fed with either normal diet containing 11.4% fat (control group) or HFD of 60% fat (HFD group). Half of the mice in the control group were allocated to PSPC in sterilized water at a dose of 700 mg/kg by oral gavage (PSPC group) every other day. Similarly, a population of HFD-treated mice was administered with PSPC (HFD + PSPC group). All the mice in these four groups were treated for 20 weeks. To confirm the establishment of type 2 diabetes mellitus, blood glucose values were detected using an Ascensia Elite glucose meter (Bayer Corporation, Mishawaka, IN), and a glucose tolerance test as well as an insulin tolerance test was performed as previously described (Shan et al., 2016).
All procedures were performed according to the policies established in the Guide to the Care and Use of Experimental Animals provided by the National Research Council. The protocol was approved by the Committee on the Ethics of Animal Experiments of the University of Jiangsu Normal University.
2.4 Tissue preparation
Mice were deeply anesthetized and killed. The hearts and aortas were rapidly removed after perfusion with ice-cold phosphate-buffered saline (PBS). The adventitia was thoroughly stripped.
The aortic roots were fixed in 4% paraformaldehyde and then immersed in O.C.T. Compound (Sakura Finetek, Torrance, CA). Serial cross-sections with a 7-μm-thickness were collected for immunofluorescence staining.
Both heart and artery samples were homogenized in lysis buffer (KeyGen Biotech, Nanjing, China) containing phenylmethylsulfonyl fluoride (PMSF) and protease inhibitor. The cold tissues were homogenized two times for 30 s intervals using MM400 (Retsch GmbH, Haan, Germany) and centrifuged at 12,000g for 10 min at 4°C. The supernatants were collected for western blot analysis. The concentration of samples was determined using a BCA protein assay kit (Thermo Fisher Scientific).
2.5 Western blot analysis
HUVECs with different treatments were lysed in lysis buffer (pH 8.0 Tris-HCl 20 mM, NaCl 137 mM, 1% NP40, 10% glycerol, and Na3VO4 1 mM). Protein extracts (20 μg of cells or 50 μg of tissue sample) were separated using 8% (mammalian target of rapamycin [mTOR] and NLRP3) or 15% (LC3, beclin-1, p62, etc.) sodium dodecyl sulfate polyacrylamide gel electrophoresis (SDS-PAGE) and transferred onto a polyvinylidene difluoride membrane (Millipore, Billerica, MA) by electrophoretic transfer (Bio-Rad Laboratories, Inc., Hercules, CA). The membranes were incubated with rabbit anti-LC3 antibody, rabbit anti-p62 antibody (Cat #5114; RRID:AB_10624872; Cell Signaling Technology), mouse anti-beclin-1 antibody (Cat #4122; RRID:AB_11178656; Cell Signaling Technology), rabbit anti-mTOR antibody (Cat #2972; RRID:AB_330978; Cell Signaling Technology), rabbit anti-p-mTOR (Ser2448) antibody (Cat #2971S; Cell Signaling Technology), rabbit anti-p-mTOR (Ser2481) antibody (Cat #2974S; RRID:AB_2231885; Cell Signaling Technology), mouse anti-NLRP3 (Cat #NBP1–97601; RRID:AB_11189153; Novus Biologicals, Littleton, CO), rabbit anti-caspase 1 (p10 + p45/42; Cat #ab179515; Abcam, Cambridge, MA), rabbit anti-IL 1β (35 + 17kD; Cat #16806-1-AP; Proteintech Group, Rosemont, IL), mouse anti-β-actin antibody (Cat #sc-47778 HRP; RRID:AB_2714189; Santa Cruz Biotechnology, Dallas, TX), and rabbit anti-p21 antibody (Cat #sc-469; RRID:AB_632121; Santa Cruz Biotechnology) at 4°C overnight. After incubation with horseradish peroxidase-conjugated secondary antibody, proteins were detected with enhanced chemiluminescence reagents (Bio-Rad Laboratories) using Amersham Imager 600 (GE Healthcare, Fairfield, CT). Quantification of the detected bands was analyzed using the ImageJ software. The data were normalized using β actin as an internal control and were standardized with the vehicle control as 1.0.
2.6 Analysis of cell cycle
Cell cycle was analyzed using a flow cytometer (ACEA Biosciences, San Diego, CA) according to the manufacturer's instructions. HUVECs were seeded onto a six-well plate at a density of 1.5 × 10⁵ cells/well. Cells treated for 3 days as described above were collected using centrifugation, washed with PBS, and then fixed with 70% ethanol at 4°C overnight. Subsequently, we washed and centrifuged the cells, and then resuspended pellets in PBS containing RNase (50 μg/ml) and propidium iodide (50 μg/ml). After incubation for 30 min, the mixture was detected using flow cytometer at the excitation wavelength of 488 nm.
2.7 Senescence-associated β-galactosidase (SA-β-gal) staining
As a widely used marker for senescence, SA-β-gal staining was performed as previously described (Sun et al., 2015). Cells were fixed using formaldehyde and then rinsed in staining solution at pH 6.0. The staining solution consisted of 5 mM of K4[Fe(CN)6]3H2O, 5 mM of K3[Fe(CN)6], 150 mM of sodium chloride, 2 mM of magnesium chloride, and 1 mg/ml of X-gal. After overnight incubation at 37°C, the cells were washed in PBS and viewed using phase contrast microscopy. Cells stained blue were senescent cells. More than 2,000 cells were quantified in each sample. The equation for determining the proportion of senescence was as follows: (number of blue cells/number of total cells) × 100%.
2.8 RNA interference (RNAi)
HUVECs were transfected with specific human NLRP3 small interfering RNA (siRNA) oligonucleotides at a dose of 20 nM (Santa Cruz Biotechnology) for 6 hr using the RNAi Fect™ Transfection Reagent (Qiagen, Duesseldorf, Germany) in serum-free medium. Next, normal culture medium with serum was added to cells, and the silent efficiency was maintained for 3 days as previously observed (Sun et al., 2015). Control cells were treated with scrambled siRNA (Santa Cruz Biotechnology). To test the effect of high glucose or PSPC on endothelial senescence after NLRP3 silencing, glucose and/or PSPC was administered to cells during the RNAi process.
2.9 Double immunofluorescence staining
Analysis of colocalization between NLRP3 and LC3 or p62 in HUVECs was performed using double immunofluorescence staining. Briefly, cells in different groups were fixed and incubated with primary antibody rabbit anti-LC3 antibody or rabbit anti-p62 antibody, and then with the monoclonal antimouse NLRP3 antibody at 4°C overnight. Appropriate fluorescein isothiocyanate-conjugated or tetramethylrhodamine (TRITC)-conjugated secondary antibody was applied for 30 min at 37°C. After mounting with DAPI, the cells were monitored using a fluorescence microscope.
2.10 Coimmunoprecipitation
HUVECs were lysed in radioimmunoprecipitation assay lysis buffer. Equal amounts of total proteins (450 μg) were divided into three equal aliquots. The first aliquot was supplemented with 15 μg/ml purified nonimmune IgG (IgG group; Santa Cruz Biotechnology); the second one was mixed with a 1:100 dilution of monoclonal anti-NLRP3 antibody overnight at 4°C (NLRP3 group). The antibody-antigen complexes were then incubated with fresh protein A-Sepharose beads (Thermo Fisher Scientific) for 4 hr with gentle rotation. The third aliquot served as whole cell input without any operation.
The proteins-bead complexes were centrifuged and washed three times in lysis buffer. Lysis buffer was added to the beads to release proteins by boiling. Proteins from the input group, immunoglobulin G (IgG) group, and NLRP3 group were subjected to SDS-PAGE and immunoblotted with rabbit anti-p62 antibody or normal rabbit IgG antibody.
2.11 Immunofluorescence staining for histologic section
After fixation in 4% paraformaldehyde, antigen in the tissues was unmasked in boiling sodium citrate (pH 6.0) for 10 min. Nonspecific binding sites were blocked with 5% normal goat serum. Next, the sections were incubated respectively with rat anti-CD31 (Cat #sc-18916; RRID:AB_627028; Santa Cruz Biotechnology), rabbit anti-LC3 or rabbit anti-p62, as well as sheep anti-NLRP3 (Cat #AF6789; Novus Biologicals) at 4°C overnight. After washing in PBS, a mixture of appropriate goat antirabbit IgG (Alexa Fluor® 488) (Thermo Fisher Scientific), goat anti-rat IgG (TRITC), or donkey anti-goat IgG (Alexa Fluor® 647; Abcam) was added. Subsequently, DAPI was applied, and the stained sections were captured using a laser scanning confocal microscope (Leica, Wetzlar, Germany).
2.12 Statistics
All experiments were duplicated and repeated at least three times. Data were expressed as the mean ± standard error of the mean. The Student t test was used to make a comparison between the two groups. Differences were considered significant at p < 0.05.
3 RESULTS
3.1 PSPC promoted autophagy in senescent endothelial cells
Punctiform distribution of LC3β is widely used to monitor autophagy induction. We have demonstrated in a previous study that high glucose induced the premature senescence of endothelial cells, while 50 μg/ml PSPC could delay cellular aging. To understand whether autophagy was involved in cell senescence, we examined LC3 aggregation in cells using immunofluorescence staining. The aggregation of LC3 indicates the formation of autophagosomes or autolysosomes (Klionsky et al., 2008). As shown in Figure 1a,c a few of the normal cultured cells were positive with LC3 puncta. However, 30 mM d-glucose treatment decreased both the percentage of LC3-puncta-positive cells and the number of dots in the positive cells. In contrast, the number of reduced dots was reversed by PSPC, suggesting that PSPC might inhibit endothelial senescence by increasing autophagy. To further verify the enhanced autophagy by PSPC, we isolated the endothelium from the arterial arch and vascular vessel of transgenic mice with GFP-labeled LC3, a well-known model for monitoring autophagy, and tested the aggregation of LC3. The results in Figure 1b show that PSPC augmented the number of LC3 dots, which was impaired by d-glucose, and this was consistent with the results in HUVECs.
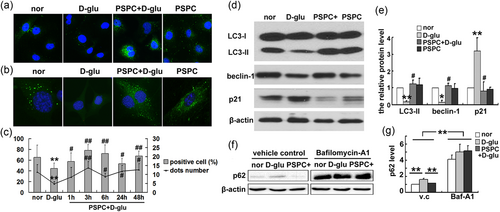
PSPC augmented autophagic activity when inhibiting endothelial senescence. (a) Fluorescence staining showed the distribution of LC3 (stained as green) in different groups. (b) Detection of LC3 puncta in endothelial cells isolated from GFP-LC3 mice. (c) The proportion of LC3-punctum-positive cells and the quantification of dots in positive cells. (d, e) Alteration of p21 and autophagy-related proteins. (f, g) Changes in p62 in d-glu or PSPC + d-glu group after pretreatment with bafilomycin A1 (*p < 0.05; **p < 0.01 vs. normal group; #p < 0.05; ##p < 0.01 vs. d-glucose treatment; n = 4). GFP: green fluorescent protein; LC3: microtubule-associated protein 1 light chain 3β; PSPC: purple sweet potato color [Color figure can be viewed at wileyonlinelibrary.com]
It is widely accepted that increased LC3 and decreased SQSTM1/p62 levels are associated with autophagy flux (Kliosnky, 2016). The levels of LC3 and p62 were detected using western blot analysis to investigate the roles of PSPC in autophagic flux. Compared with normal endothelial cells, premature senescent cells (d-glu group) exhibited lower levels of LC3 and beclin-1 (Figure 1d) but more p62 expression (Figure 1f). All alterations were reversed by PSPC (PSPC + d-glu group). In addition, changes in the p21 level, which was increased by high glucose but decreased by PSPC, confirmed the inhibitory efficiency of PSPC on cellular senescence (Figure 1d).
To further investigate the roles of autophagy in the endothelium related to cardiovascular diseases, immunofluorescence staining was performed to detect LC3 and p62 levels in endothelium using diabetic mice, in which endothelial senescence has been reported (Sun et al., 2015). Diabetic symptoms in mice were confirmed by the glucose and insulin tolerance test (Shan et al., 2016). The endothelium was specifically labeled by CD31. As shown in Figure 2a,b the expression of LC3 in the arterial endothelium was decreased after the mice were fed with a HFD (HFD group) as indicated by the arrow, compared with normal diet mice (CTR group). However, PSPC restored LC3 levels in the endothelium (indicated by an arrowhead). In addition, HFD promoted the accumulation of p62 but p62 levels were decreased by PSPC (Figure 2c,d). Furthermore, similar variation tendencies of LC3, p62, and beclin-1 were observed in homogenates of the heart and artery by western blot analysis (Figure 2e,f). Taken together, these results confirmed that PSPC enhanced autophagy to perturb endothelium senescence.
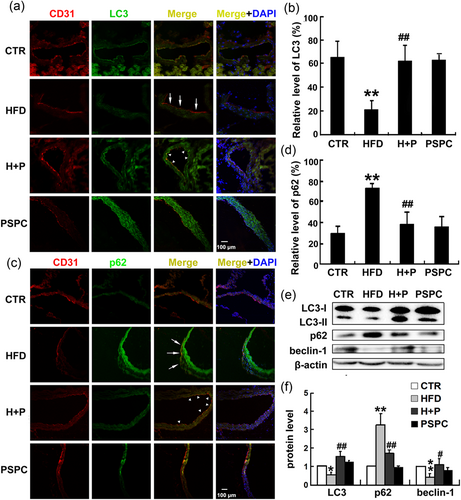
PSPC promoted autophagy in the endothelium in senescence-related cardiovascular disease. (a, c) Immunofluorescence staining of aortas showed the distributions of LC3 and p62 in endothelium in mice fed with a HFD and/or PSPC. The endothelium was labeled with CD31 and stained as red, LC3 or p62 was labeled in green, and the blue color indicated the cell nucleus (DAPI). CTR, mice fed with a normal diet; HFD, mice fed with a HFD; H + P, mice treated with a HFD and PSPC; PSPC, mice administered with PSPC. Scale bar = 50 μm. (b, d) Quantification of LC3 or p62 in the endothelium. (e) Bands of LC3, p62, and beclin-1 in heart and artery homogenate. (f) Quantification of the indicated proteins (*p < 0.05, **p < 0.01 vs. CTR group; #p < 0.05; ##p < 0.01 vs. HFD group; n = 6). CTR: control; DAPI: 4′,6-diamidino-2-phenylindole; HFD: high-fat diet; LC3: microtubule-associated protein 1 light chain 3; PSPC: purple sweet potato color [Color figure can be viewed at wileyonlinelibrary.com]
As an autophagy receptor, p62 is degraded during autophagy. In this study, two potential explanations accounted for the high levels of p62 in the d-glucose group: impaired autophagy or blockage of degradation. To elucidate the mechanism, we pretreated HUVECs with bafilomycin A1, which is often used to measure autophagic flux (Yamamoto et al., 1998), to disturb fusion between lysosomes and autophagosomes. Western blot analysis showed that p62 was increased in normal culture medium after pretreatment with bafilomycin A1. There was also a dramatic accumulation of p62 in d-glucose or PSPC + d-glucose treatment after bafilomycin A1 preincubation (Figure 1f). These results excluded the possibility of blockade of p62-degradation by d-glucose and suggested that PSPC suppressed endothelial senescence by promoting cellular autophagy.
3.2 Autophagy was responsible for PSPC-mediated endothelial senescence
Is autophagy a vital factor during cell senescence? To answer this question, we detected the phosphorylation of both ser2448 and ser2481 of mTOR in HUVECs. The level of phosphorylated mTOR (p-mTOR; ser2448) was elevated by high-glucose administration. However, high glucose failed to increase the phosphorylation of mTOR (ser2448) in the presence of PSPC. No significant difference in p-mTOR (ser2481) was observed after glucose or PSPC treatment (Figure 3a,b). In addition, eukaryotic initiation factor 4E-binding protein (4EBP1), a substrate of the mTOR complex 1 (mTORC1), was phosphorylated by glucose, while the phosphorylation of 4EBP1 was dramatically inhibited after PSPC administration (Figure 3a). In addition, increased p62 levels in d-glucose but decreased levels in the PSPC group confirmed the role of autophagy in this process. Taken together, these data revealed that PSPC directly deactivated the mTOR signaling pathway.
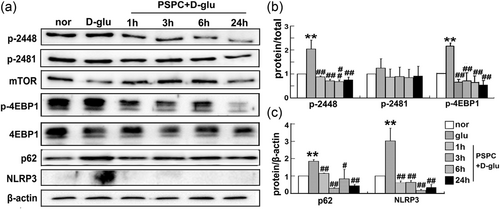
PSPC deactivated mTOR and the NLRP3 inflammasome. (a) Levels of mTOR (phosphorylation at ser2448 and 2481), 4EBP1, p62, and NLRR3 were analyzed using western blot analysis. (b, c) Protein quantification (**p < 0.01 vs. normal group; #p < 0.05; ##p < 0.01 vs. d-glucose group; n = 3). 4EBP1: eukaryotic initiation factor 4E-binding protein; LC3: microtubule-associated protein 1 light chain 3β; mTOR: mammalian target of rapamycin; NLRP3: nucleotide-binding oligomerization domain, leucine rich repeat and pyrin domain containing protein 3; PSPC: purple sweet potato color
Subsequently, we interfered with endothelial autophagy to further understand the antagonism between autophagy and senescence. Rapamycin, which targets to the mTORC1 signaling pathway and is a well-known pharmacological promoter of autophagy, or 3-MA (autophagy inhibitor) was administered to HUVECs before glucose or PSPC treatment. The induced or inhibited efficiency was confirmed by changes in LC3-II, beclin-1, and p62 in Figure 5a. Next, SA β-gal staining was performed to determine the effect of autophagy dysfunction on endothelial senescence. The proportion of senescent cells in the high-glucose group was decreased once pretreated with rapamycin. In contrast, there was accelerated senescence in glucose-treated cells after 3-MA administration, and even PSPC could not prevent senescent progression (Figure 4c).
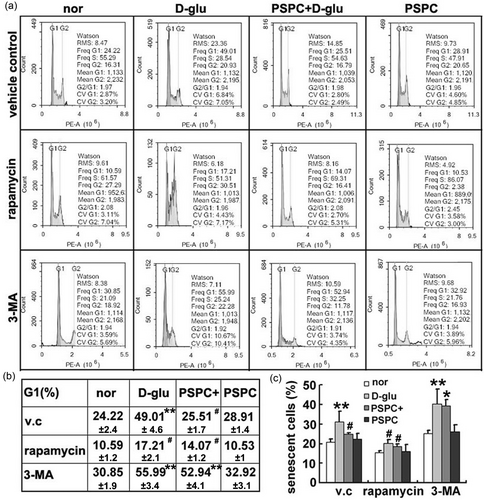
PSPC delayed endothelial senescence in an autophagy-dependent manner. (a) Flow cytometry revealed the distribution of cell cycle after intervention to autophagic activity. (b) The proportion of G1 phase. (c) The percentage of senescent cells was quantified by SA β-gal staining (*p < 0.05; **p < 0.01, vs. normal group in vehicle control; #p < 0.01, vs. d-glucose administration in vehicle control; n = 4). PSPC: purple sweet potato color; SA β-ga: senescence-associated β-galactosidase; v.c: vehicle control
Furthermore, we examined the distribution of cell cycle by flow cytometric analysis. In the vehicle control group, high-glucose-exposed HUVECs were arrested at the G1 phase of the cell cycle and this arrest was recovered by the addition of PSPC (Figure 4a,b). Increased autophagy by rapamycin hindered glucose-induced G1 phase arrest and synergistically facilitated the inhibitory effect of PSPC on cell cycle arrest. However, HUVECs with impaired autophagic ability (3-MA group) exhibited a dramatic acceleration of senescence (higher proportion of G1/G0 cells) after d-glucose or/and PSPC treatment. Altogether, attenuated autophagy deteriorated endothelial senescence but reinforced autophagy alleviated senescence, indicating a crucial role of autophagy in PSPC-mediated endothelial senescence.
3.3 Inflammatory inhibition mediated by PSPC was autophagy-dependent
In our previous study, PSPC inhibited endothelial senescence by blocking the NLRP3 inflammasome (Sun et al., 2015). It has been reported that the NLRP3 inflammasome can be degraded by autophagy (Shi et al., 2012). Therefore, we questioned whether the anti-inflammatory effect of PSPC on endothelial senescence was mediated by increased autophagy. We unbalanced cellular autophagy using an enhancer or inhibitor to test the effect on glucose/PSPC-mediated senescence. We found that in the vehicle control group, glucose promoted the activation of the NLRP3 inflammasome, whereas administering PSPC in senescent cells (induced by high glucose) significantly reduced the activation of caspase-1 and release of IL-1β (Figure 5). These results were consistent with previous studies (Sun et al., 2015). However, once endothelial autophagy was enhanced by rapamycin, high glucose failed to activate the NLRP3 inflammasome, including a failure of increased NLRP3 expression, damaged segmentation of procaspase-1 (p45/42) into caspase-1 (p10), and less secretion of IL-1β from progenitors (pro-IL-1β; Figure 5). In contrast, the reduction in NLRP3 triggered by PSPC was completely reversed when the cells were pretreated with the autophagy inhibitor 3-MA (Figure 5). Moreover, few precursor proteins of p10 and IL-1β (p45/42 and pro-IL-1β) but increased p10 and IL-1β were observed following a challenge with 3-MA. Taken together, these results suggested an antagonistic correlation between autophagy and the NLRP3 inflammasome.
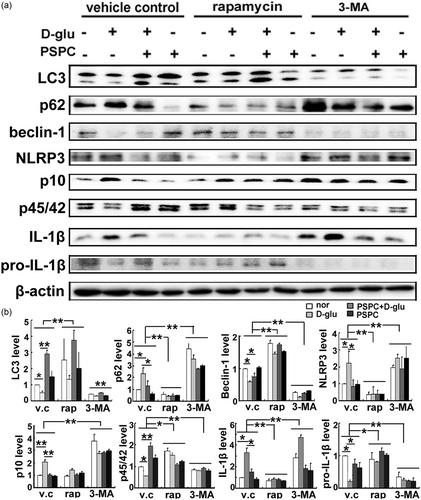
PSPC inhibited the NLRP3 inflammasome by enhancing autophagy. (a) Bands of autophagy-related proteins and NLRP3 inflammasome after enhanced or impaired autophagy. (b) Protein quantification (*p < 0.01; **p < 0.05; n = 4). IL-1β: interleukin-1β; LC3: microtubule-associated protein 1 light chain 3; 3-MA: 3-methyladenine; NLRP3: nucleotide-binding oligomerization domain, leucine rich repeat and pyrin domain containing protein 3; PSPC: purple sweet potato color
Several studies have demonstrated that activation of the NLRP3 inflammasome initiates autophagosome formation and induces autophagy (Hayrabedyan et al., 2016). Based on this finding, we examined whether NLRP3 activation by high glucose in this study may function as a feedback mechanism to affect autophagy. As shown in Figure 6, compared with the control siRNA group, no obvious alterations in LC3 transformation and beclin-1 accumulation were observed after NLRP3 interference. These results indicated that endothelial autophagy regulated by glucose or PSPC was an upstream signal of the NLRP3 inflammasome.
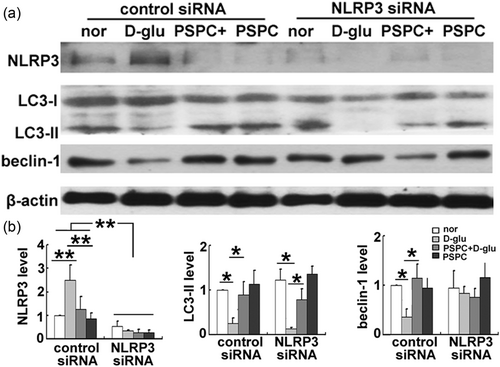
Disruption of the NLRP3 inflammasome did not affect endothelial autophagy. (a) Expression of LC3 and beclin-1 in endothelial cells after NLRP3 silencing. (b) Protein quantification (*p < 0.01; **p < 0.05; n = 3). LC3: microtubule-associated protein 1 light chain 3; NLRP3: nucleotide-binding oligomerization domain, leucine rich repeat and pyrin domain containing protein 3; PSPC: purple sweet potato color; siRNA: small interfering RNA
3.4 NLRP3 inflammasome colocalized with the autophagy receptor
To further elucidate the mechanism underlying NLRP3 inflammasome deactivation by autophagy, double immunofluorescence staining was performed to analyze the localization of NLRP3 and autophagy receptor. Colocalization of NLRP3 and LC3 was observed in endothelial cells (indicated by an arrow in Figure 7a). This phenomenon disappeared in cells treated with glucose or PSPC due to scarce LC3 conversion in the d-glucose group or low levels of NLRP3 in d-glucose combined PSPC treatment. All these results suggested that the NLRP3 inflammasome might overlap with the autophagosome.
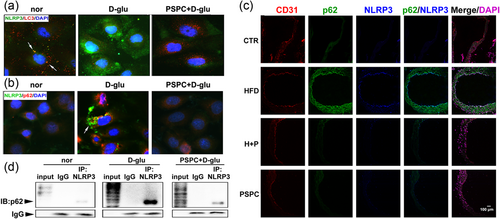
Autophagy increased by PSPC targeted the NLRP3 inflammasome. (a) The localization of LC3 (red) and NLRP3 (green) in endothelial cells. (b) p62 (red) was colocalized with NLRP3 (green). The magnification was ×400. (c) NLRP3 colocalized with p62 in the endothelium of vascular vessels. The five lanes represented CD31 (red), p62 (green), NLRP3 (blue), merge of p62 and NLRP3, merge of CD31, p62, NLRP3 and DAPI (purple), respectively. Scale bar = 50 μm. (d) Coimmunoprecipitation confirmed the interaction between p62 and NLRP3. DAPI: 4′,6-diamidino-2-phenylindole; IgG: immunoglobulin G; NLRP3: nucleotide-binding oligomerization domain, leucine rich repeat and pyrin domain containing protein 3; PSPC: purple sweet potato color [Color figure can be viewed at wileyonlinelibrary.com]
To further support this assumption, we tested the distribution of another autophagy receptor p62, which serves as a molecular bridge for the delivery of substrates to the autophagosome (Seibenhener et al., 2004). The immunofluorescence staining in Figure 7b shows similar variation tendencies of p62 and NLRP3, suggesting that cells exposed to high glucose exhibited strong expression of p62 and NLRP3. Interestingly, the distributions of p62 and NLRP3 in glucose-treated cells were superposed (indicated by an arrow in Figure 7b). In addition, overlapping distribution of p62 and NLRP3 was detected in the senescent endothelium of diabetic mice (HFD group in Figure 7c), indicating the colocalization of the autophagosome and NLRP3 inflammasome.
Furthermore, we performed coimmunoprecipitation assays and found that p62 was detected in all three groups (normal, d-glucose, PSPC + d-glucose) in the immunoprecipitations obtained with anti-NLRP3 antibody but not with IgG (Figure 7d). A reciprocal coimmunoprecipitation assay showed similar results (data not shown), suggesting that the two proteins interacted in endothelial cells. Interestingly, compared with the other two groups, much greater p62 was pulled-down by the same amount of NLRP3 antibody after high glucose administration (Figure 7d), suggesting that glucose promoted the accumulated p62 to bond with NLRP3. These results confirmed that autophagy targeted inflammasome components to degrade NLRP3 inflammasomes during PSPC-modulated endothelial senescence.
4 DISCUSSIONS
Emerging evidence has indicated the involvement of autophagy and the NLRP3 inflammasome in cellular senescence. However, the interactions between these two elements underlying endothelial senescence are still poorly understood. In this study, we elucidated that PSPC induced endothelial autophagy in a mTOR-dependent manner, which in turn deactivated the NLRP3 inflammasome to restrain the inflammatory response and then ameliorated endothelial function against premature senescence. For the first time, these data clarified the antagonistic correlation between autophagy and the NLRP3 inflammasome in mediating endothelial senescence.
Cardiovascular complications are a major cause of mortality in diabetes, in which endothelial senescence is initiated (Yokoi et al., 2006). Our previous studies also demonstrated that endothelial senescence mediated the association between atherogenesis and prediabetes, and PSPC weakened endothelium senescence to protect vascular function and to postpone the development of diabetes (Sun et al., 2015). In this study, we adopted PSPC to inhibit endothelium senescence. To better investigate the underlying mechanisms, a well-established in vitro system, in which HUVECs were exposed to high glucose to induce premature senescence (Hayashi et al., 2014) was utilized. In addition, the premature senescence of endothelium in vivo was evoked by a HFD (Sun et al., 2015).
Autophagy is self-cleansing machinery used to protect and maintain cell survival under physiological and stress conditions. Several studies have demonstrated that insufficient and excessive autophagy may cause endothelial dysfunction and both conditions are detrimental to cardiovascular systems (Gatica, 2015; Lavandero, Chiong, Rothermel, & Hill, 2015), suggesting the significance of proper autophagic activity in endothelial cells. Indeed, moderate autophagy is necessary for endothelial cell survival and physiological functions. For example, a number of endogenous autophagosomes exist in cultured HUVECs to regulate endothelial cell processing, maturation, and secretion of von Willebrand factor (Torisu et al., 2013). In addition, proper autophagy in endothelial cells is indispensable for angiogenesis (Lu et al., 2016). In this study, we also detected positive LC3 puncta in both normal HUVECs and ECs isolated from GFP-labeled-LC3 mice, suggesting that basal autophagy is exhibited in endothelial cells to maintain cell homeostasis.
Although it has been reported that autophagy promotes the acquisition of a senescent phenotype (Young et al., 2009), the antiaging effect of autophagy is more acceptable, and autophagy has been proven to inhibit senescence by reducing the accumulation of toxic protein, improving the function of mitochondria, and impairing cell death (Rubinsztein et al., 2011). Consistent with these results, our research in this paper showed that high-glucose-induced endothelial senescence by inhibiting autophagy, and PSPC enhanced autophagic activity to reverse this trend. Our previous studies showed that a high-fat-diet-induced aging of the endothelium and that PSPC delayed endothelial senescence (Sun et al., 2015). In this study, we adopted mice fed with HFD or HFD + PSPC to verify the antagonism between autophagy and senescence. Expectedly, impaired autophagy in senescent endothelium was observed in HFD mice, and PSPC treatment rejuvenated endothelium and ameliorated diabetic complications by restoring autophagy function. To further determine the role of autophagy in cellular senescence, HUVECs were exposed to rapamycin or 3-MA, the autophagy inducer or inhibitor, respectively. These results showed that premature senescence (induced by high glucose) disappeared when autophagy inducer rapamycin was administered to endothelial cells. On the other hand, the prominent antiaging property of PSPC was disrupted after autophagy interference (3-MA administration). With regard to in vivo efficacy, Lesniewski et al. (2017) reported that dietary rapamycin supplementation improved glucose tolerance in old mice and reversed age-related endothelial dysfunction by modulating cell cycle and the senescence pathway. Likewise, autophagy activation by rapamycin significantly inhibited atherosclerotic plaque progression in mice fed with HFD and decreased the expression of the senescence markers p16 and p21; nevertheless, these alterations were reversed by the autophagy inhibitor 3-MA (Luo et al., 2017). Our data are partly consistent with these results and suggest that autophagy plays a vital role in antisenescence mediated by hyperglycemia, indicating a potential strategy and target for cardiovascular diseases evoked by diabetes.
The mTOR is a primary negative regulator of autophagy. It exists in two distinct complexes, mTORC1 and mTORC2. mTORC1 is sensitive to rapamycin (Oshiro et al., 2004) and is able to phosphorylate p70 S6 kinase and 4EBP1 to initiate messenger RNA translation (Holz, Ballif, Gygi, & Blenis, 2005; Sonenberg & Hinnebusch, 2009). In contrast, mTORC2 contains rapamycin-insensitive companion of mTOR and is insensitive to rapamycin (Sarbassov, Guertin, Ali, & Sabatini, 2005). Herein, phosphorylation of 4EBP1 was increased by high glucose but suppressed after PSPC treatment, suggesting the participation of mTORC1 in endothelial senescence. The function of mTOR is regulated by phosphorylation at ser2448 by Akt (Navé, Ouwens, Withers, Alessi, & Shepherd, 1999) and at ser2481 by autophosphorylation (Peterson, Beal, Comb, & Schreiber, 2000). In the present study, concomitant with cell senescence, ser2448 of mTOR in endothelial cells was phosphorylated by glucose, while PSPC blunted mTOR (Ser2448) phosphorylation. In addition, 3-MA, which is targeted to class III PI3K, inhibited autophagy and resulted in a disability of PSPC in delaying endothelial senescence. These results indicated the involvement of the PI3K/Akt signaling pathway during endothelial senescence.
It has been demonstrated that endothelial-deletion of mTORC1 in diabetic mice protects against hindlimb ischemia by promoting autophagy and alleviating inflammation (Fan et al., 2017), suggesting an anti-inflammatory effect of autophagy. Similarly, rapamycin has been reported to inhibit the NLRP3 inflammasome in pulmonary fibrosis (Meng et al., 2018) but 3-MA facilitated NLRP3 inflammasome activation in rats with cerebral injury (He et al., 2017). However, the direct interaction of autophagy and NLRP3 inflammasome is still unclear. It has been demonstrated that NLRP3 is colocalized with LC3 (Hayrabedyan et al., 2016). During the process of autophagy, the membranes of the autophagosome elongate and LC3 is conjugated to the lipid phosphatidylethanolamine to form LC3-II (Ravikumar et al., 2010). The LC3 puncta-positive autophagosomes, which signify the initiation of autophagy, traffic along microtubules and finally fuse with lysosomes. Therefore, we suspected that LC3 could bind to NLRP3 and guide NLRP3 inflammasomes to lysosomes. An increasing number of study utilizes immunostaining of LC3 to analyze autophagic activity in vivo (Yang et al., 2017). In this study, arteries from diabetic mice were immunostained with LC3 antibody, and immunofluorescence results verified the induced effect of PSPC on autophagy. Double immunofluorescence staining demonstrated an interaction of LC3 and NLRP3, in which NLRP3 displayed colocalization patterns with LC3 in endothelial cells. However, these colocalizations were not obvious after a challenge with high glucose and/or PSPC, which might be due to the unbalanced expression of the two molecules.
P62, the LC3-binding adaptor, has been reported to assist in delivering the inflammasome to autophagosomes by interacting with the inflammasome component ASC (Shi et al., 2012). In this study, we discovered a coherent variation tendency in NLRP3 and p62 during endothelial senescence, and these two proteins colocalized in both senescent endothelial cells and the endothelium in vascular vessels. Furthermore, the interaction between NLRP3 and p62 was confirmed by coimmunoprecipitation. Because p62 serves as a molecular bridge for the delivery of substrates to the autophagosome, we got the conclusion that the NLRP3 inflammasome was delivered to the autophagosome by p62 for destruction. The interaction was present even on the basal level, suggesting that autophagy kept inflammasome activation in check.
In conclusion, PSPC elevates autophagy to inhibit endothelial senescence as shown in Figure 8. Under physiological conditions, a moderate amount of autophagy receptor p62 binds to NLRP3 and delivers the NLRP3 inflammasome to the lysosome for degradation, finally keeping the inflammasome activities in check and maintaining cellular homeostasis. Once exposed to pathological stress, autophagy in endothelial cells is impaired, and p62 cannot be digested, which leads to an accumulation of NLRP3 inflammasomes. The activated inflammasomes trigger an inflammatory response and initiate cell senescence. This series of cascade reactions is eliminated by PSPC, in which autophagy is activated in a mTOR-dependent manner, and the inflammasomes are engulfed by the autophagosome for lysosomal destruction. Ultimately, PSPC prevents the release of proinflammatory cytokines and delays endothelial senescence.
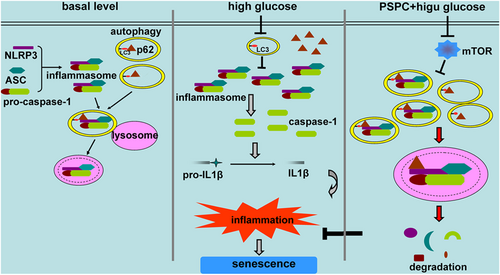
Schematic model of PSPC-inhibited endothelial cell senescence. At the basal level, autophagosomes in endothelial cells encompass the NLRP3 inflammasomes and deliver them to lysosomes to maintain homeostasis. Once stimulated, autophagy is impaired, but the NLRP3 inflammasome is activated to release pro-inflammatory cytokines and finally leads to endothelial senescence. PSPC enhances autophagic flux by repressing mTOR activity, and autophagosomes target NLRP3 inflammasomes to degradation, decrease inflammatory response and delay endothelial senescence. ASC: apoptosis-associated speck-like protein containing a CARD; LC3: microtubule-associated protein 1 light chain 3β; IL-1β: interleukin-1β; mTOR: mammalian target of rapamycin; NLRP3: nucleotide-binding oligomerization domain, leucine rich repeat and pyrin domain containing protein 3; PSPC: purple sweet potato color [Color figure can be viewed at wileyonlinelibrary.com]
ACKNOWLEDGEMENTS
Contract grant sponsor: National Natural Science Foundation of China (contract grant number: 81571055, 31201039, 31200873, 81400902, 81271225, 81570531, 81703523, and 81701821); contract grant sponsor: Natural Science Foundation of Jiangsu Province (contract grant number: BK2012143 and BK20170244); contract grant sponsor: Special Funds for Promoting Science and Technology Innovation in Xuzhou (contract grant number: KC16SG272); contract grant sponsor: grants from the Natural Science Foundation by Jiangsu Normal University (contract grant number: 11XLR21 and 16XLR045); contract grant sponsor: Priority Academic Program Development of Jiangsu Higher Education Institutions.
CONFLICTS OF INTEREST
The authors declare that there are no conflicts of interest.


