DNA methylation regulates α-smooth muscle actin expression during cardiac fibroblast differentiation
Abstract
Cardiac fibroblast (CF) differentiation to myofibroblasts expressing α-smooth muscle actin (α-SMA) plays a key role in cardiac fibrosis. Therefore, a study of the mechanism regulating α-SMA expression is a means to understanding the mechanism of fibroblast differentiation and cardiac fibrosis. Previous studies have shown that DNA methylation is associated with gene expression and is related to the development of tissue fibrosis. However, the mechanisms by which CF differentiation is regulated by DNA methylation remain unclear. Here, we explored the epigenetic regulation of α-SMA expression and its relevance in CF differentiation. In this study, we demonstrated that α-SMA was overexpressed and DNMT1 expression was downregulated in the infarct area after myocardial infarction. Treatment of CFs with transforming growth factor-β1 (TGF-β1) in vitro upregulated α-SMA expression via epigenetic modifications. TGF-β1 also inhibited DNMT1 expression and activity during CF differentiation. In addition, α-SMA expression was regulated by DNMT1. Conversely, increasing DNMT1 expression levels rescued the TGF-β1-induced upregulation of α-SMA expression. Finally, TGF-β1 regulated α-SMA expression by inhibiting the DNMT1-mediated DNA methylation of the α-SMA promoter. Taken together, our research showed that inhibition of the DNMT1-mediated DNA methylation of the α-SMA promoter plays an essential role in CF differentiation. In addition, DNMT1 may be a new target for the prevention and treatment of myocardial fibrosis.
1 INTRODUCTION
Myocardial fibrosis, an unavoidable pathological change involved in all forms of cardiovascular disease, contributes to the development of myocardial remodeling (Brown, Ambler, Mitchell, & Long, 2005; Murtha et al., 2017). Differentiation of cardiac fibroblasts (CFs) plays a key role in the process of myocardial fibrosis (Hinz et al., 2007; Souders, Bowers, & Baudino, 2009; Williams et al., 2014). After the heart suffers from ischemia, hypoxia, inflammation, or other stimulating factors, CFs proliferate and differentiate to cardiac myofibroblasts that express α-smooth muscle actin (α-SMA) and secrete numerous cytokines and extracellular matrix (ECM) proteins (Berk, Fujiwara, & Lehoux, 2007; Díez, 2007; Driesen et al., 2014; Roy et al., 2007). Originally, cardiac fibrosis was thought to be a beneficial repair process; however, the excessive deposition of ECM increases myocardial stiffness, damages tissue structure, and eventually contributes to diastolic dysfunction (Levick et al., 2009; Murtha et al., 2017; Qi, Jia, Li, Li, & Du, 2014).
Recent studies have suggested that DNA methylation may be associated with fibrotic diseases, such as hepatic, pulmonary, renal, and cardiac fibrosis (Dowson & O'Reilly, 2016; X. Zhang et al., 2017). DNA methylation is an essential component of epigenetic modification and plays an important role in many biological processes, such as cell proliferation (Zhu et al., 2017), differentiation (Londono Gentile et al., 2013), and apoptosis (Tran et al., 2016; Ye et al., 2016). DNA methylation predominantly occurs at position 5 of cytosines in CpG dinucleotides and is catalyzed by DNA methyltransferases (DNMTs; Leonhardt, Page, Weier, & Bestor, 1992; Prokhortchouk & Defossez, 2008; Sulewska et al., 2007).
Although DNA methylation plays a pivotal role in the progression of tissue fibrosis, the concrete regulatory mechanism of DNA methylation in CF differentiation has not been clarified. In the cardiovascular system, the effect of DNA methylation on CF differentiation is still under investigation. Watson et al. (2014) found that hypoxia-inducible factor-1 upregulated the expression levels of DNMT1 and DNMT3B and induced cardiac fibrosis. In addition, overexpression of DNMT3A inhibited ras association domain family 1 isoform A (RASSF1A) expression in activated CFs (Tao, Yang, Chen et al., 2014). A recent study from our laboratory also indicated that TGF-β1 may inhibit the expression and overall activity of DNMTs in CFs, as well as upregulate the expression of Col1A1 (Pan, Chen, Huang, Yao, & Ma, 2013).
Expression of α-SMA is a key indicator in the process of myofibroblast differentiation. Recent studies have shown that DNA methylation and MeCP2 regulate α-SMA gene expression during liver fibroblast differentiation (Mann et al., 2007, 2010). In addition, the DNMT-mediated DNA methylation of the α-SMA gene promoter plays an important role in the process of lung fibroblast differentiation (Hu, Gharaee-Kermani, Wu, & Phan, 2010). Little is known about the mechanism underlying the epigenetic regulation of α-SMA gene expression. Therefore, we tested the following hypothesis: The expression and activity of DNMTs are inhibited in fibrotic cardiac tissue and activated CFs. In addition, inhibition of the DNMT1-mediated DNA methylation of the α-SMA gene promoter induces α-SMA expression.
2 MATERIALS AND METHODS
2.1 Animal care and murine myocardial infarction model
Forty male Sprague–Dawley (SD) rats aged 6–8 weeks and weighing 200–220 g were purchased from the Experimental Animal Center of Yangzhou University (Yangzhou, Jiangsu, China). All experiments in this study were approved by the Ethics Review Board for Animal Studies of the Institute of Southeast University, Nanjing, China and conducted in accordance with the Guide for the Care and Use of Laboratory Animals published by the US National Institutes of Health (DHWE Publication No. 96-01, revised in 2002). The SD rats were randomly divided into the myocardial infarction (MI) group or sham-operation group (20 rats per group) and underwent surgical induction of MI by permanent coronary ligation or a sham operation. In general, rats were anesthetized by an intraperitoneal injection of pentobarbital sodium (50 mg/kg, i.p.). After mechanical ventilation was established, a left thoracotomy between the third and fourth intercostal space was performed to expose the left ventricle. After removing the pericardium, the left coronary artery was ligated with a 6-0 silk suture. Successful ligation was confirmed by observation of left ventricular pallor immediately after ligation. Rats in the sham-operation group underwent a similar surgery without ligation. The chest and skin were closed with 5-0 silk suture; the animals were kept under mechanical ventilation until spontaneous breathing occurred and recovered on a heating pad (Liu et al., 2016).
2.2 Cell culture and treatment
The CFs were isolated from adult SD rats (6–8 weeks old) by enzymatic digestion following a standard protocol (Pan et al., 2013). Briefly, rats were anesthetized by pentobarbital sodium (50 mg/kg, i.p.) and steeped in 75% ethanol for 5 min. Hearts were rapidly excised, minced, and placed in a collagenase II/trypsin digestion solution at 37℃ for 8 min. Dulbecco's modified Eagle medium (DMEM) (HyClone, Logan, UT) supplemented with 10% fetal bovine serum (FBS) (Gibco, New Zealand) was added to the cell suspension. After six to seven digestion periods, the cell suspension was centrifuged at 1,000 rpm for 10 min to collect the dissociated cells. Cells were resuspended in DMEM with 10% FBS and 1% penicillin–streptomycin (gibco) and kept for 90 min at 37℃ in a humidified atmosphere containing 5% CO2 to allow CFs to attach to the dishes. The cells in the medium were discarded. The CFs were further cultured and passaged at a 1:3 dilution. The second- to forth-passage CFs were used in the experiment.
CFs were starved for 12 hr in serum-free DMEM and then treated with 10 ng/ml recombinant human TGF-β1 (Peprotech Company) or 5-aza-2′-deoxycytidine (5-aza-dC; Sigma-Aldrich) at different concentrations (0, 0.5, 1, and 2 μm) for 48 hr. Medium containing phosphate-buffered saline (PBS) was used as a control (Pan et al., 2013).
2.3 Enzyme-linked immunosorbent assay
Six weeks after the operation, blood samples were collected from the heart and centrifuged at 4°C and 1,000g for 15 min. Plasma was separated and stored at −80°C until analysis. Procollagen Type I C-terminal peptide (PICP) levels were determined using a PICP ELISA Detection Kit (USCNK, Wuhan, China), according to the manufacturer's instructions. Absorbance was determined at 450 nm by using a microplate reader. The results were compared with a standard curve constructed by titrating standards.
2.4 Histology
The rats were euthanized 6 weeks after the operation, and the hearts were harvested and perfused with ice-cold PBS to eliminate blood contamination. Hearts were isolated and fixed in 4% paraformaldehyde overnight, embedded in paraffin, and sectioned at 5-μm thickness. Masson's trichrome staining was performed according to standard methods.
2.5 Quantitative real-time polymerase chain reaction
After the experimental treatment period, total RNA was isolated using TRIzol reagent (Invitrogen, CA). Then, the concentration of RNA was measured using a NanoDropND-1000 spectrophotometer (Thermo Fisher Scientific, Waltham, MA). One microgram of total RNA was reverse transcribed to single-strand complementary DNA (cDNA) using moloney murine leukemia virus (M-MLV) reverse transcriptase (Invitrogen), according to the manufacturer's instructions. Quantitative polymerase chain reaction (qPCR) experiments were performed using IQ SYBR Green Supermix (Bio-Rad) and the BIO-RAD MJ Mini Opticon Real-Time PCR System. The relative gene expression values were calculated using the method, and glyceraldehyde 3-phosphate dehydrogenase (GAPDH) was used as a control. The primer sequences are listed as follows:
α-SMA, forward primer GCTGTTTTCCCATCCATCGT
reverse primer TTCTCCCGGTTGGCCTTAG;
DNMT1, forward primer ACCACGCCGACATCAACCT
reverse primer TCCTCCACAGCCAGAAAACAC;
DNMT3A, forward primer GGCCCATTCGATCTGGTGA
reverse primer CTTGGCTATTCTGCCGTGTTC;
DNMT3B, forward primer GGTGCGTCGTTCAGGCAGT
reverse primer TCCTCATCTTCCCCTCGGTC;
TGF-β, forward primer CGGCAGCTGTACATTGACTT
reverse primer AGCGCACGATCATGTTGGAC;
Collagen I, forward primer TGACTGGAAGAGCGGAGAGTA
reverse primer GACGGCTGAGTAGGGAACAC;
Collagen III, forward primer TCTTATTTTGGCACAGCAGTC
reverse primer GTGGCTCCTCATCACAGATTA;
CTGF, forward primer CTGACCTGGAGGAAAACATTA
reverse primer TTAGCCCTGTATGTCTTCACAC; and
GAPDH, forward primer CCCATCTATGAGGGTTACGC
reverse primer TTTAATGTCACGCACGATTTC.
2.6 Western blot analysis
Protein was extracted using a Nuclear Protein and Cytoplasmic Protein Extraction kit (KeyGEN Biotech, Nanjing, China), and the protein concentration was quantified using the BCA Protein Assay Kit (KeyGEN Biotech). Western blot analysis was performed as previously described.
The following primary antibodies were used according to the manufacturer's protocol: α-SMA antibody (ab5694; Abcam, Cambridge, UK), DNMT1 antibody (ab13537; Abcam, Cambridge, UK), DNMT3A antibody (ab2850; Abcam, Cambridge, UK), DNMT3B antibody (ab2851; Abcam, Cambridge, UK), p-Smad2 antibody (cst-8828; Cell Signaling Technology), Smad2 antibody (cst-5678; Cell Signaling Technology), phosphorylated c-Jun N-terminal kinase (p-JNK) antibody (cst-9255s; Cell Signaling Technology), JNK antibody (cst-9255s; Cell Signaling Technology), phosphorylated extracellular signal-regulated kinase (p-ERK) antibody (cst-9911; Cell Signaling Technology), ERK antibody (cst-4370s; Cell Signaling Technology), p-p38 antibody (cst-4631; Cell Signaling Technology), p38 antibody (cst-8690; Cell Signaling Technology); in addition, GAPDH (AF1186; Beyotime Biotechnology, China) and tubulin (AF0001; Beyotime Biotechnology) were used as controls. Immunoreactive bands were visualized using an enhanced chemiluminescence reagent and were detected by exposing the blots to X-ray film (Roche Applied Science).
2.7 Nuclear DNMT activity assay
Nuclear protein was extracted using a Cytoplasm Protein and Nuclear Protein Extraction kit (KeyGEN Biotech, Nanjing, China). The activity of DNMTs was measured by a commercially available nuclear DNMT activity assay (GENMED Scientifics, Shanghai, China) according to the manufacturer's instructions with approximately 20 µg of nuclear protein. The absorbance was determined at 510 nm using a microplate reader. In addition, the results were calculated according to the manufacturer's instructions.
2.8 Plasmid construction
Specific small interfering RNAs (siRNAs) against DNMT1 and control siRNA were synthesized by GenePharma (Shanghai, China). The CFs were transfected with either siDNMT1 or siRNA using Lipofectamine RNAi Max transfection reagent (Invitrogen). The siRNA gene sequences used to specifically target DNMT1 were as follows: siDNMT1-1 sense: 5′-GACCATGATTGAAGCTTCATCTAGT-3′; siDNMT1-2 sense: 5′-GCTGTCTATGAAGACTTGATCAATA-3′; and siDNMT1-3 sense: 5′-GACAAGAAGTTCGTTAGCAACATTA -3′.
A DNMT1 expression vector was constructed based on the lentivirus vector pLVX-puro-EGFP. The DNA fragment of DNMT1 was amplified from the rat DNMT1 cDNA purchased from Thermo Fisher Scientific Inc.
2.9 Dual-luciferase assay
The CFs were plated in 24-well plates and cultured overnight. Lipofectamine transfection reagent (Invitrogen) was used to transfect cells according to the manufacturer's protocol. To normalize the luciferase activity, the pRL-TK control vector encoding Renilla luciferase was cotransfected with the pGL4.17 plasmids. The cells were then cultured for 48 hr after transfection and lysed with passive lysis buffer (Promega). The lysates were analyzed using a Dual-Luciferase Reporter Assay System Kit (Promega). Luminescence was measured on a luminometer (Turner Biosystems Instrument).
2.10 Bisulfite sequencing analysis
Genomic DNA was extracted using a Genomic DNA Mini Preparation Kit with a Spin Column (Beyotime Biotech) and converted using the Bisulfite Conversion Kit (Active Motif, 55016), according to the manufacturer's instructions. The primers for sodium bisulfite DNA sequencing were designed using METHPRIMER (http://www.urogene.org/methprimer/) and synthesized by Sangon Biotech (Shanghai, China) as follows: forward primer: 5′-TTTTGGTTTGTAGGAGGGAAGTAG-3′ and reverse primer: 5′-TTTAACCACAAAAATAACCCATTAC-3′. The products of the methylation PCR were then cloned directly into the pUCm-T vector using the pUCm-T Vector Cloning Kit (Sangon Biotech) and sequenced.
2.11 Cell counting kit-8 assay
CFs were seeded in 96-well plate, then treated with TGF-β1 and transfected with pcDNA-DNMT1, siDNMT1, or inhibitors of a relative signaling pathway for 48 hr. Ten-microlitre CCK-8 solution was added to each well and incubated at 37°C for 2 hr in a 5% CO2 incubator, and the absorbance of each well was read at a wavelength of 450 nm using a microplate reader. The presented as viability =(absorbance of the samples)/(absorbance of the control).
2.12 5-Ethynyl-2′-deoxyuridine incorporation assay
5-Ethynyl-2′-deoxyuridine (EdU) assay is available from Donghuan (Shanghai, China). The cells were seeded in a 24-well plate. Twenty-four hours after culture, the cells were washed with PBS, followed by treatment with TGF-β1, and transfected with pcDNA-DNMT1, siDNMT1, or inhibitors of a relative signaling pathway for 48 hr. Then, cells were incubated with serum-free DMEM supplemented with 10 μM EdU for an additional 2 hr at 37°C, and then were fixed with 4% formaldehyde for 30 min, followed by the addition of 150 μl glycine. After 5 min, the cells were incubated with 0.5% Triton X-100 for 10 min at room temperature. After washing with PBS for 5 min, 1× Apollo reaction reagent was added and incubated at room temperature in the dark for 30 min, and then the cells were stained with 300 μl Hoechst 33342 (5 μg/ml) for an additional 30 min in the dark. Cells labeled and unlabeled by EdU were counted under a microscope (TE2000-U; Nikon) and pictures were taken.
2.13 Immunohistochemistry
Immunohistochemical staining was performed on paraffin-embedded heart tissue sections of 5 mm thickness, which were deparaffinized, and treated with 0.3% endogenous peroxidase blocking solution for 20 min. Sections were treated sequentially with 3% hydrogen peroxidase in methanol for 10 min at room temperature and washed with PBS for 5 min three times to block the endogenous peroxidase activity. After high pressure-cooking retrieval and 5% bovine serum albumin blocking, sections were incubated overnight at 4°C with one of the following primary antibodies: proliferating cell nuclear antigen antibody (PCNA; Biolegend, CA), α-SMA antibody, and Vimentin antibody (AF1975, Beyotime Biotechnology); nuclei were identified by 4′-6-diamidino-2-phenylindole (DAPI; C1005, Beyotime Biotechnology). Primary antibodies were detected by rabbit anti-mouse and goat anti-rabbit nonbiotinylated regents (Donghuan), according to the instructions of the manufacturer. Pictures were taken with a Photo and Image Auto Analysis System (Image-Pro-Plus, China)
2.14 Statistical analysis
Quantitative data are presented as the mean ± standard deviation. Student's t test was performed by using SPSS (v.13.0.0; SPSS Inc., Chicago, IL) to determine statistical significance between two groups. *p < 0.05 was considered a statistically significant difference, and **p < 0.01 was considered a highly statistically significant difference.
3 RESULTS
3.1 Greater collagen density and increased fibrosis-related molecule expression in the infarct area after MI
As shown by Masson trichrome staining, 6 weeks after the operation, the degree of cardiac collagen deposition (Figure 1a) was increased in the MI group compared with the control group. In addition, in MI rats, the plasma PICP level was significantly increased (Figure 1b). We analyzed the expression levels of TGF-β, connective tissue growth factor (CTGF), Collagen I (COL I) and COL III by qPCR and determined that the expression of these fibrosis-related messenger RNA (mRNA) was enhanced after MI (Figure 1c). By using immunohistochemistry, we found a lot of cardiac myofibroblasts, coexpressing vimentin and α-SMA, were accumulated in the infarct zone (Figure 1d). These results showed that the cardiac fibrosis model was successfully constructed by left coronary ligation in rats.
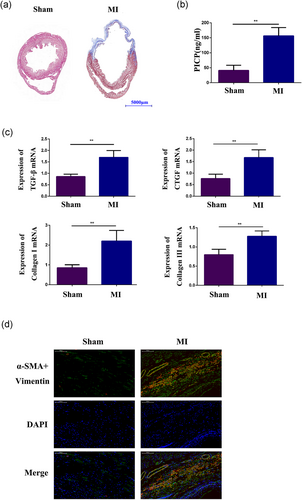
Greater collagen density and increased fibrosis-related molecule expression in the infarct area after MI. (a) Masson staining analysis of collagen deposition in the control group and the MI group. (b) Detection of the plasma level of PICP by PICP ELISA. (c) qPCR analysis of CTGF, TGF-β, COL I and COL III expression in the infarct area of ischemic heart tissue from the MI group and in matched areas from the control group. (d) Double immunofluorescence staining with antibodies to α-SMA (Red) and Vimentin (Green). Nuclei were counterstained with DAPI (blue) in the sham group and the MI group. Each experiment was repeated a minimum of three times, and statistically significant differences are indicated by asterisks: *p < 0.05 and **p < 0.01. α-SMA: α-smooth muscle actin; COL I: collagen I; CTGF: connective tissue growth factor; DAPI: 4’-6-diamidino-2-phenylindole; ELISA: enzyme-linked immunosorbent assay; MI: myocardial infarction; PICP: procollagen type I C-terminal peptide; qPCR: quantitative polymerase chain reaction; TGF-β, transforming growth factor-β1 [Color figure can be viewed at wileyonlinelibrary.com]
3.2 α-SMA expression was increased by epigenetic modification
qPCR and western blot analysis demonstrated that the mRNA and protein expression levels of α-SMA were both significantly increased in the infarct area of ischemic heart tissue (Figure 2a,b). Meanwhile, in the cardiac fibrosis zone, the number of PCNA+ cells were increased in comparison with the sham group (Figure 2c). In addition, these results were confirmed in CFs activated by treatment with 10 ng/ml TGF-β1 (Figure 2d,e). The results of CCK-8 and EDU assay also indicated that TGF-β1 could promote CF proliferation (Figure 5f). The dual-luciferase reporter assay also showed that the relative α-SMA promoter activity was significantly increased in CFs treated with TGF-β1 (Figure 2f). Then, CFs were treated with the DNMT inhibitor 5-aza-dC to identify whether DNA methylation affected α-SMA expression. qPCR and western blot analysis indicated that α-SMA mRNA and protein were overexpressed after 48 hr of incubation with 5-aza-dC (Figure 2g,h). These results indicated that α-SMA expression may be regulated by DNA methylation. To further confirm this finding, we used the sodium bisulfite DNA sequencing assay to examine the methylation status of CpGs upstream of the α-SMA promoter region in CFs treated with TGF-β1. As expected, the result showed that the level of CpG methylation in the α-SMA promoter region was reduced in CFs treated with TGF-β1 (12.5%) compared with control cells (37.5%) (Figure 2i). Therefore, these data indicated that epigenetic mechanisms may regulate the phenotype during CF differentiation.
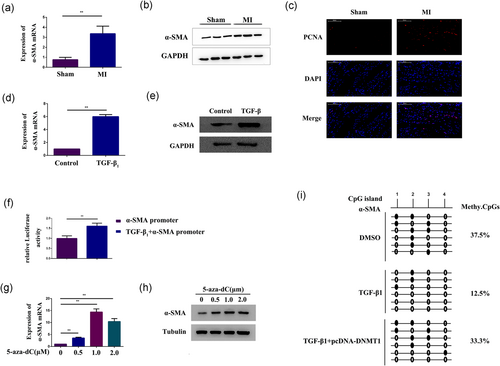
α-SMA expression was increased by epigenetic modification. (a,b) qPCR and western blot analysis of α-SMA expression in the infarct area of ischemic heart tissue from either the control group or the MI group. GAPDH expression was measured as a control. (c) Immunofluorescence staining with antibodies to PCNA (Red), and nuclei were counterstained with DAPI (blue) in the sham group and the MI group. (d,e) qPCR and western blot analysis of α-SMA expression in CFs treated with 10 ng/ml TGF-β1 for 48 hr. GAPDH expression was measured as a control. (f) Dual-luciferase assay determined α-SMA promoter activity in CFs treated with 10 ng/ml TGF-β1 for 48 hr. (g,h) qPCR and western blot analysis of α-SMA expression in CFs treated with 5-aza-dC at different concentrations (0, 0.5, 1, and 2 μm) for 48 hr. GAPDH and tubulin expression levels were measured as controls. (i) Bisulfite pyrosequencing analysis of the DNA methylation status of the α-SMA promoter region in CFs treated with 10 ng/ml TGF-β1 for 48 hr or TGF-β1-treated CFs overexpressing DNMT1. GAPDH and β-actin expression levels were measured as controls. Open circles: unmethylated CpG sequences; black circles: methylated CpG sequences. The conventional DNA methylation degrees calculated by methyl-CpGs/total CpG. Each experiment was repeated a minimum of three times, and statistically significant differences are indicated by asterisks: *p < 0.05 and **p < 0.01. 5-Aza-dC: 5-aza-2′-deoxycytidine; α-SMA: α-smooth muscle actin; CFs: cardiac fibroblasts; DAPI: 4’-6-diamidino-2-phenylindole; GAPDH: glyceraldehyde 3-phosphate dehydrogenase; MI: myocardial infarction; PCNA: proliferating cell nuclear antigen antibody; qPCR: quantitative polymerase chain reaction; TGF-β1, transforming growth factor-β1 [Color figure can be viewed at wileyonlinelibrary.com]
3.3 DNMT activity and expression are decreased in activated CFs and fibrotic tissue
To determine whether DNMTs affected α-SMA expression, we examined the DNMT expression level and activity in both fibrotic tissue and activated CFs. In vivo, the DNMT activity assay kit showed that DNMT activity was significantly reduced after MI (Figure 3a). Then, qPCR revealed that the mRNA expression level of DNMT1 was downregulated after MI. However, no differences were observed in the DNMT3A and DNMT3B mRNA expression levels (Figure 3b). Western blot also demonstrated that the DNMT1 protein expression level in fibrotic tissue was significantly decreased in the MI group compared with the control group (Figure 3c).
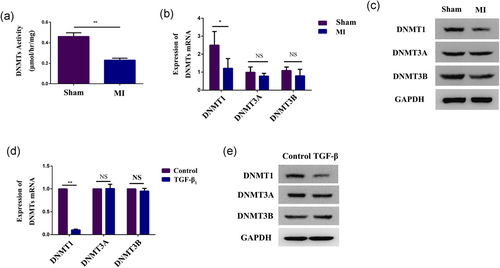
DNMT activity and expression are decreased in activated CFs and fibrotic tissue. (a) A global DNMT activity assay kit was used to analyze the activity of DNMTs in the infarct area of ischemic heart tissue from the MI group and matched areas from the control group. (b,c) qPCR and western blot analysis of DNMT1, DNMT3A, and DNMT3B expression in the infarct area of ischemic heart tissue from the MI group and matched areas from the control group. GAPDH expression was measured as a control. (d,e) qPCR and western blot analysis of DNMT1, DNMT3A, and DNMT3B expression in CFs treated with 10 ng/ml TGF-β1 for 48 hr. GAPDH expression was measured as a control. Each experiment was repeated a minimum of three times, and statistically significant differences are indicated by asterisks: *p < 0.05 and **p < 0.01. CFs: cardiac fibroblasts; GAPDH: glyceraldehyde 3-phosphate dehydrogenase; MI: myocardial infarction; qPCR: quantitative polymerase chain reaction; TGF-β1: transforming growth factor-β1 [Color figure can be viewed at wileyonlinelibrary.com]
In vitro, the expression level of DNMT1 mRNA was decreased after TGF-β1 treatment, and no difference was observed in DNMT3A and DNMT3B mRNA expression levels (Figure 3d). However, western blot showed that the protein expression levels of all the DNMT isoforms were decreased after incubation, especially DNMT1 (Figure 3e). These results demonstrated that DNMT1 may play a key role in CF differentiation.
3.4 DNMT1 regulates α-SMA expression
To explore whether α-SMA expression was regulated by DNMT1, CFs were transfected with pcDNA-DNMT1 to overexpress DNMT1 (Figure 4a), we found that overexpression of DNMT1 led to inhibition of α-SMA expression (Figure 4c,d). In contrast, the expression level of α-SMA was significantly increased (Figure 4e,f) after the cells were transfected with siDNMT1 (Figure 4b). These data indicated that DNMT1 may regulate α-SMA expression in CFs.
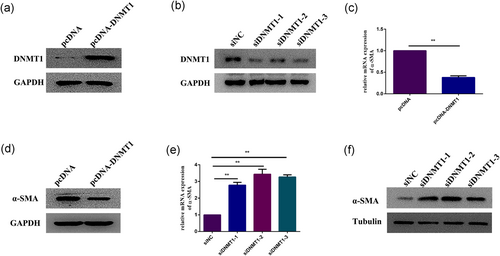
DNMT1 regulates α-SMA expression. (a) Western blot analysis of DNMT1 expression in CFs overexpressing DNMT1. GAPDH expression was measured as a control. (b) Western blot analysis of the efficiency of DNMT1 small interfering RNAs (siDNMT1). GAPDH expression was measured as a control. (c,d) qPCR and western blot analysis of α-SMA expression in CFs overexpressing DNMT1. GAPDH expression was measured as a control. (e,f) qPCR and western blot analysis of α-SMA expression in CFs after DNMT1 knockdown. GAPDH and tubulin expression levels were measured as controls. Each experiment was repeated a minimum of three times, and statistically significant differences are indicated by asterisks: *p < 0.05 and **p < 0.01. α-SMA: α-smooth muscle actin; CFs: cardiac fibroblasts; GAPDH: glyceraldehyde 3-phosphate dehydrogenase; qPCR: quantitative polymerase chain reaction [Color figure can be viewed at wileyonlinelibrary.com]
3.5 TGF-β1 promotes CF differentiation and proliferation and mediates DNA methylation of the α-SMA promoter by suppressing the DNMT1
The CFs were treated with TGF-β1 and transfected with either pcDNA-DNMT1 or siDNMT1 for 48 hr to explore the relationship between DNMT1 and α-SMA and to further verify the contribution of DNMT1 on TGF-β1-induced myofibroblast differentiation. We found that DNMT1 overexpression significantly abrogated the TGF-β1-induced increase in α-SMA expression (Figure 5a,b), whereas DNMT1 downregulation supported the TGF-β1-induced increase in α-SMA expression (Figure 5c,d). By using DNA methylation analysis, we verified that DNMT1 overexpression prevented TGF-β1-induced demethylation of the α-SMA promoter (33.3%) (Figure 2i). Therefore, these results revealed a direct relationship between TGF-β1 and α-SMA expression that was regulated by DNMT1 and suggested that DNMT1 significantly contributed to α-SMA overexpression. Meanwhile, by using CCK-8, we found that TGF-β1 could significantly promote the CFs proliferation. Compared with the TGF-β1 group, we found that DNMT1 overexpression significantly abrogated the TGF-β1-induced proliferation, whereas DNMT1 downregulation promoted the TGF-β1-induced proliferation (Figure 5e). The results of EdU incorporation assay are consistent with the CCK-8 assay (Figure 5f). These results indicated that TGF-β1 was able to promote the proliferation of CFs through DNMT1, and DNA methylation of the α-SMA promoter region by DNMT1 likely plays an essential role in CF differentiation.
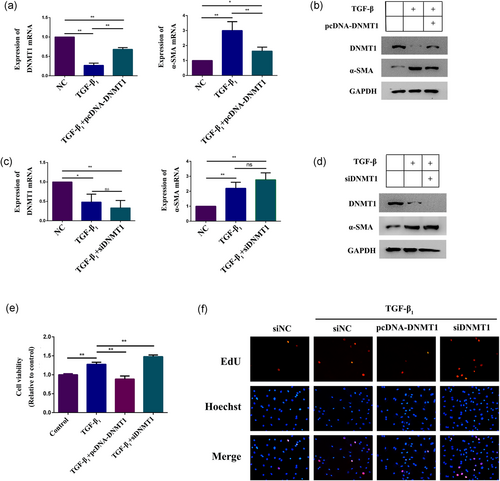
TGF-β1 promotes CF differentiation and proliferation and mediates DNA methylation of the α-SMA promoter by suppressing the DNMT1. (a,b) qPCR and western blot analysis of DNMT1 and α-SMA expression in TGF-β1-treated CFs overexpressing DNMT1. GAPDH expression was measured as a control. (c,d) qPCR and western blot analysis of DNMT1 and α-SMA expression in TGF-β1-treated CFs after DNMT1 knockdown. GAPDH expression was measured as a control. (e,f) Western blot analysis of α-SMA, DNMT1, Smad2 expression and the expression of Smad2 phosphorylated forms in TGF-β1-treated CFs cultured with SB431542 (20 μm) or DMSO for 48 hr. GAPDH expression was measured as a control. Each experiment was repeated a minimum of three times, and statistically significant differences are indicated by asterisks: *p < 0.05 and **p < 0.01. α-SMA: α-smooth muscle actin; CFs: cardiac fibroblasts; DMSO: dimethyl sulfoxide; GAPDH: glyceraldehyde 3-phosphate dehydrogenase; qPCR: quantitative polymerase chain reaction; TGF-β1: transforming growth factor-β1 [Color figure can be viewed at wileyonlinelibrary.com]
3.6 Both the Smad and MAPK pathways are involved in DNMT1-mediated CF differentiation and proliferation
Previous studies have documented that TGF-β1 could induce cell differentiation via the classical TGF-β/Smad signaling pathway or noncanonical MAKP signaling pathway. Therefore, we investigated whether Smad or mitogen-activated protein kinase (MAPK) signaling pathways are involved in TGF-β1-induced CF differentiation. We performed western blot analysis to detect the protein levels of Smad 2/3 and the three well-characterized MAPK subfamilies, JNK, p38, and ERK, as well as their phosphorylated forms in CFs with TGF-β1 alone or coupled with Smad inhibitor SB431542, p-JNK inhibitor SP100625, p-p38 inhibitor SB203580, or p-ERK inhibitor AZD6244. The western blot results demonstrated increased protein expression levels of p-Smad 2/3, p-JNK, p-p38, and p-ERK, but without alterations in Smad 2/3, JNK, p38, and ERK protein expression levels in CFs treated with 10 ng/ml TGF-β1 (Figure 6a–d). Meanwhile, activation of relative phosphorylated forms was repressed by their corresponding inhibitors (Figure 6a–d). It was noteworthy that treatment with the inhibitors could restore the TGF-β1-induced downregulation of DNMT1 and overexpression of α-SMA (Figure 6a–d). To investigate whether Smad or MAPK signaling pathway is involved in TGF-β1-induced CFs proliferation. We performed the CCK-8 and EdU assays to detect the cell viability in CFs treated with TGF-β1 alone or coupled with p-Smad2 inhibitor SB431542, p-JNK inhibitor SP100625, p-p38 inhibitor SB203580, or p-ERK inhibitor AZD6244 for 48 hr. The CCK-8 assay results demonstrated that treatment with the inhibitors could restore the TGF-β1-induced cell proliferation compared with the TGF-β1 group (Figure 6e); the results of the EdU assay is consistent with the CCK-8 assay (Figure 6f). These results indicated that TGF-β1 promote the proliferation of CFs through both Smad and MAPK signaling pathways, and both of these pathways were involved in the regulation of DNMT1 and α-SMA expression by TGF-β1.
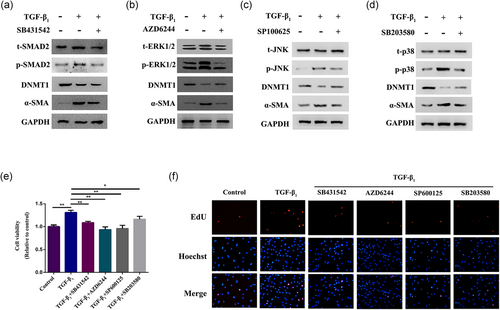
Both Smad and MAPK pathways are involved in DNMT1-mediated CF differentiation and proliferation. (a) Western blot analysis of α-SMA, DNMT1, Smad2 expression and the expression of Smad2 phosphorylated forms in TGF-β1-treated CFs cultured with SB431542 for 48 hr. (b) Western blot analysis of α-SMA, DNMT1, ERK1/2 expression and the expression of ERK1/2 phosphorylated forms in TGF-β1-treated CFs cultured with AZD6244 for 48 hr. (c) Western blot analysis of α-SMA, DNMT1, JNK expression, and the expression of JNK phosphorylated forms in TGF-β1-treated CFs cultured with SP100625 for 48 hr. (d) Western blot analysis of α-SMA, DNMT1, p38 expression, and the expression of p38 phosphorylated forms in TGF-β1-treated CFs cultured with SB203580 for 48 hr. (e) CFs were treated with TGF-β1 alone or coupled with p-Smad2 inhibitor SB431542, p-JNK inhibitor SP100625, p-p38 inhibitor SB203580, or p-ERK inhibitor AZD6244 for 48 hr. Cell proliferation was measured by the CCK-8 assay. (f) EdU assay was also used to detect cell proliferation. GAPDH expression was measured as a control. Statistically significant differences are indicated by asterisks: *p < 0.05 and **p < 0.01. α-SMA: α-smooth muscle actin; CCK-8: cell counting kit-8; CFs: cardiac fibroblasts; EdU: 5-ethynyl-2′-deoxyuridine; GAPDH: glyceraldehyde 3-phosphate dehydrogenase; JNK: phosphorylated c-Jun N-terminal kinase; MAPK: mitogen-activated protein kinase; p-ERK: phosphorylated extracellular signal-regulated kinase; TGF-β1: transforming growth factor-β1 [Color figure can be viewed at wileyonlinelibrary.com]
4 DISCUSSION
The α-SMA expression level is typically an indicator of fibroblast differentiation (Phan, 2002; C. Zhang et al., 2015). Therefore, a study of the mechanisms regulating α-SMA expression is a means to understanding the mechanism of fibroblast differentiation and cardiac fibrosis. In this study, we found that 5-aza-dC induced α-SMA expression in CFs at both the mRNA and protein levels in vitro, which is consistent with the results of TGF-β1 treatment. 5-Aza-dC, an analog of cytosine, irreversibly binds DNMTs during replication and leads to replication-dependent global demethylation and gene reactivation (Pan et al., 2013). This finding led us to hypothesize that DNA methylation regulates α-SMA expression in fibroblasts. Although an increasing number of trans-acting factors and cis-acting elements have been found (Phosri et al., 2017; Teixeira et al., 2017; Wu et al., 2016), the epigenetic regulation of α-SMA expression has not been widely studied. Therefore, in this paper, we explored the epigenetic regulation of α-SMA expression in CFs and tissues.
One mechanism by which epigenetics regulate gene expression is by DNA methylation of CpG sites within promoters (Dowson & O'Reilly, 2016; Ghosh, Rai, Flevaris, & Vaughan, 2017; Tao, Yang, Shi, Deng, & Li, 2014). In the present study, we provided evidence that TGF-β1 can significantly reduce the percentage of methylation across multiple CpG sites in the rat α-SMA promoter.
Currently, there are three known DNMT isoforms, namely DNMT1, DNMT3a, and DNMT3b, that are responsible for DNA methylation. DNMT1 is a maintenance-type methyltransferase that is responsible for copying DNA methylation patterns during DNA replication (Etoh et al., 2004), whereas DNMT3a and DNMT3b are important in de novo methylation (Okano, Bell, Haber, & Li, 1999). In this study, we found that global DNMT activity and expression, especially DNMT1 activity and expression, were significantly inhibited after either TGF-β1 treatment or MI. This result suggests that TGF-β1 treatment or MI could induce α-SMA expression and affect myofibroblast differentiation by suppression of DNMTs. Previous findings on the expression of DNMTs in the process of CF differentiation are controversial (Pan et al., 2013; Tao, Yang, Chen et al., 2014; Watson et al., 2014). Our results are in agreement with studies that have shown that TGF-β1 inhibits DNMT expression. The reason for the discrepant findings is still unclear but may be related to the different cell types and/or experimental conditions used. Changes in the expression or activity of DNMTs after TGF-β1 treatment or MI implicate DNMTs as regulators of cardiac fibrosis.
To confirm the potential regulatory mechanism of DNA methylation in the induction of α-SMA expression and CF differentiation, the effects of suppressing or overexpressing DNMT1 on α-SMA expression were examined in CFs. When DNMT1 expression was suppressed using specific siRNAs, there was a significant increase in α-SMA expression. Meanwhile, overexpression of DNMT1 by transfection with plasmids led to the inhibition of α-SMA expression. These observations were also noted in cells after TGF-β1 treatment to induce myofibroblast differentiation. Moreover, this study indicated that pcDNA-DNMT1 could significantly rescue the demethylation induced by TGF-β1 in the rat α-SMA promoter. Thus, these findings revealed that α-SMA expression is activated during CF differentiation by removing the methyl groups established by DNMT1.
Studies have shown that TGF-β1 activates multiple signaling pathways to induce CF differentiation. The Smad signaling pathway is considered the main intracellular signal transduction pathway (Leask & Abraham, 2004). Meanwhile, TGF-β can also mediate the process of fibrosis through other noncanonical signaling pathways, such as the ras/MEK/renin-angiotensin system/mitogen activation inhibitor/extracellular signal-regulated kinase (ERK), JNK, p38 MAPK and Rho/rho factor/Rho-associated protein kinase (ROCK) signaling pathway (Leask, 2010; Small et al., 2010). However, the signaling pathway involved in the regulation of DNMT expression by TGF-β is still unclear. In hepatocellular carcinoma cells, TGF-β can inhibit the expression of DNMT3b by activating Smad signaling (You, Ding, & Rountree, 2010). Hypoxia-induced RASAL1 promoter hypermethylation is associated with the Smad signaling pathway in endothelial–mesenchymal transition (Xu et al., 2016). A study has also shown that TGF-β can inhibit the expression of three subtypes of DNMT by inhibiting the ERK pathway, resulting in DNA demethylation in the Foxp3 promoter region in T lymphocytes (Luo et al., 2008). In prostate cancer, TGF-β could upregulate the expression of DNMTs by activating the ERK signaling pathway (Zhang et al., 2011), and the MAPK pathway is involved in DNMT1/p16 regulation in vascular smooth muscle cells (VSMCs) treated with atorvastatin (Zhu et al., 2017). In our study, we found that Smad 2/3 and three subfamilies of MAPKs were activated after TGF-β1-induced α-SMA expression and cell differentiation. Thus, we applied inhibitors of Smad and the three subfamilies of MAPKs to CFs treated with TGF-β1 and found that the inhibitors could alleviate the influence of TGF-β1 on CFs. These results demonstrated that the Smad and MAPK signaling pathways had regulatory functions in CFs by regulating DNMT1 expression. However, additional studies are required to elucidate the actual function and mechanism of the signaling pathways and its relationship with DNMT1 during cell differentiation.
Taken together, we demonstrated that α-SMA expression during CF differentiation was regulated by demethylation of its gene sequence through the inhibition of DNMT1 expression. In addition, the Smad and MAPK pathways are involved during this process. These results indicate the importance of DNA demethylation and DNMT1 in the induction of myofibroblast differentiation and reveal DNMT1 as an additional potential target for controlling CF differentiation and cardiac fibrosis.
ACKNOWLEDGMENTS
This work was supported by grants from the National Natural Science Foundation of People's Republic of China (Nos. 81500204, 81400219, and 81400225), the Natural Science Foundation of Jiangsu Province (No. BK20150648), and Jiangsu Provincial Medical Youth Talent (QNRC2016815).
CONFLICTS OF INTEREST
The authors declare that there are no potential conflicts of interest.
AUTHOR CONTRIBUTIONS
Y.H. performed the majority of experiments and wrote the manuscript. X.P. and G.M. designed the study. S.L. and Y.S. provided vital reagents and analytical tools. Z.S. and Z.C. analyzed the data and were also involved in editing the manuscript.


