ceRNA network construction and comparison of gastric cancer with or without Helicobacter pylori infection
Abstract
Gastric cancer (GC) is a lethal disease, and among its variety of etiological factors, Helicobacter pylori (H. pylori) infection is the strongest risk factor. However, the genetic and molecular mechanisms underlying H. pylori-related GC need further elucidation. We investigated the competing endogenous RNA (ceRNA) network differences between H. pylori (+) and H. pylori (−) GC. The long noncoding RNA (lncRNA), microRNA (miRNA), and messenger RNA (mRNA) expression data from 32 adjacent noncancerous samples and 18 H. pylori (+) and 141 H. pylori (−) stomach adenocarcinoma samples were downloaded from the TCGA database. After construction of lncRNA–miRNA–mRNA ceRNA networks of H. pylori (+) and H. pylori (−) GC, Panther and Kobas databases were used to analyze the Gene Ontology (GO) and Kyoto Encyclopedia of Genes and Genomes (KEGG) pathways. Finally, survival analysis was used to discover the key genes. In H. pylori (+) GC, we identified a total of 1,419 lncRNAs, 82 miRNAs, and 2,501 mRNAs with differentially expressed profiles. In H. pylori (−) GC, 2,225 lncRNAs, 130 miRNAs, and 3,146 mRNAs were differentially expressed. Furthermore, three unique pathways (cytokine–cytokine receptor interaction, HIF-1 signaling pathway, and Wnt signaling pathway) were enriched in H. pylori (+) GC. According to the overall survival analysis, three lncRNAs (AP002478.1, LINC00111, and LINC00313) and two mRNAs (MYB and COL1A1) functioned as prognostic biomarkers for patients with H. pylori (+) GC. In conclusion, our study has identified the differences in ceRNA regulatory networks between H. pylori (+) and H. pylori (−) GC and provides a rich candidate reservoir for future studies.
1 INTRODUCTION
Gastric cancer (GC) is one of the most common cancers and the second most common cause of cancer mortality in the world. The five-year survival rate of patients with GC is low because of the late detection of the disease. Among several tumor-associated factors, infection with Helicobacter pylori (H. pylori) has been classified as a type I carcinogen by the International Agency for Research in Cancer (IARC; Anwar et al., 1994). H. pylori is a Gram-negative bacteria, and half of the world's population are infected with H. pylori during childhood. H. pylori infection alters gene expression in host cells. Constant H. pylori infection may lead to an inflammatory cascade and then trigger a series of the normal gastric mucosa transformation: nonatrophic gastritis occurs, then turns into multifocal atrophic gastritis, intestinal metaplasia, and dysplasia; finally, some of the infected patients will develop stomach cancer (Correa & Houghton, 2007; Correa & Piazuelo, 2012). Thus, it is very important to find out how H. pylori virulence factors alter the intracellular signaling pathways in GC.
Only 2% of the human transcriptome is protein-coding RNA, and the other 98% is noncoding RNA. However, it was only in recent years that the researchers noticed that noncoding RNAs accomplish a remarkable variety of biological functions (Cech & Steitz, 2014). Among the noncoding RNAs, long noncoding RNAs (lncRNAs) are transcripts longer than 200 nucleotides that are not translated into protein (Ponting, Oliver, & Reik, 2009). lncRNAs are poorly conserved, and through cis- or trans-acting mechanisms, they control multilevel regulated gene expression pathways such as transcription, epigenetics, and translation (Rinn & Chang, 2012; Wang & Chang, 2011). In many human diseases, especially proliferative disorders, many lncRNAs showed altered expression patterns, which indicated that lncRNAs were important in maintaining cellular homeostasis (Michalik et al., 2014). Another small noncoding RNAs, called microRNAs (miRNAs), are typically 22 nucleotides long and evolutionarily conserved single-stranded RNA molecules. They negatively regulate of protein-coding genes’ expression by pairing with complementary target sequences in the 3′-untranslated regions (UTRs) of messenger RNA (mRNA; Guo, Ingolia, Weissman, & Bartel, 2010). In tumor diseases, aberrantly expressed miRNAs play crucial roles in cell proliferation, migration, and invasion (Tan & Marques, 2014). According to the recently discovered competing endogenous RNA (ceRNA) molecular mechanism hypothesis, mRNA and lncRNA share one or more miRNA response elements (MREs) and may act as natural miRNA sponges that lead to the downregulation of the intracellular miRNA function (Salmena, Poliseno, Tay, Kats, & Pandolfi, 2011). The lncRNA–miRNA–mRNA network is now known to have a major involvement in the initiation, progression, invasion, and metastasis of cancer. Therefore, disequilibrium of the ceRNA network may lead to disease pathogenesis.
Several noncoding RNA studies of H. pylori-associated GC had been reported. lncRNA AF147447 was reported to have functions in the tumor suppression of H. pylori-related GC (Zhou et al., 2016). Serum H19, LINC00152, and Lnc-SGK1 may serve as potential biomarkers for the diagnosis of H. pylori GC (Yang et al., 2016; Yao et al., 2016). In H. pylori (+) GC serum, miR-146, miR-375, and Let-7 were downregulated and miR-19 and miR-21 were upregulated for H. pylori clearance (Polakovicova et al., 2018; Vaziri, Tarashi, Fateh, & Siadat, 2018). miR-124 was reported to have a protective role through the inhibition of DNA damage in the etiology of H. pylori-associated GC (Murray-Stewart et al., 2016). Downregulation of miR128/miR148a in H. pylori (+) GC results in the activation of the MMPs/E-cadherin pathway and induces migration and invasion of GC cells (Yang, Li, Du, Yin, & Li, 2018). H. pylori infection may also cause dysfunction of the gastric epithelial barrier by increasing miR-100 levels (Hu, Guo, & Ye, 2018). miR-195 and miR-488 appear to play pivotal roles in controlling IL-6 activity in H. pylori infection (Chung et al., 2017). CagA from H. pylori downregulates miR-320a and miR-4496 and then promotes GC-initiating cell properties (Kang et al., 2017). However, complex RNA crosstalk differences between H. pylori (+) and H. pylori (−) GC have not yet been fully explored. This highlights the importance of studying the ceRNA network accounting for the H. pylori-related carcinogenesis of GC.
Here, we collected GC expression data of these three RNAs from TCGA database and their corresponding clinical data. Because it is widely accepted that GC is a heterogeneous cancer, H. pylori (+) and H. pylori (−) GC may have crucial differences in several aspects owing to their clinical, pathological, molecular, and cellular heterogeneity. This is the first study to investigate the H. pylori-related GC ceRNA network. After the analysis of differentially expressed genes, we compared the ceRNA networks, related enrichment analysis results, and key genes associated with overall survival time between H. pylori (+) and H. pylori (−) GC. Finally, we found that some RNAs that were tightly related to H. pylori (+) GC. All of these results may provide a better understanding of the unique H. pylori (+) ceRNA-related pathogenesis mechanism for future research.
2 METHODS
2.1 Data collection and processing
The raw RNA and miRNA sequencing data of stomach adenocarcinoma and adjacent noncancerous tissues were acquired from GDC Data Portal (https://portal.gdc.cancer.gov). With annotations based on the Ensembl database (http://www.ensembl.org), we re-annotated RNA probe sets and obtained the mRNA and lncRNA expression profiles. The corresponding clinical data of these GC samples, containing the H. pylori infection information, were also downloaded from TCGA database. Then, we manually classified each sample into two groups: H. pylori (+) group and H. pylori (−) group. Finally, we obtained lncRNA, miRNA, and mRNA expression profiles of H. pylori (+) and H. pylori (−) GC.
2.2 Differential expression analysis
RNA expression data were normalized, and by using the R software and edgeR Bioconductor package (Chen, Lun, & Smyth, 2014), we identified the differentially expressed lncRNAs (DElncRNA), miRNAs (DEmiRNA), and mRNAs (DEmRNA) in the H. pylori (+) and H. pylori (−) GC tissues compared with adjacent noncancerous tissues. The screening criteria of the three kinds of dysregulated RNAs were as follows: (a) absolute log2 folds change (log2 FC) > 1.5; (b) false discovery rate (FDR) < 0.05. Corresponding heat maps and clustering were generated using the gplots R package.
2.3 ceRNA network construction
First, we transformed the names of DEmiRNAs into human mature miRNA names from starBase v2.0 (http://starbase.sysu.edu.cn). In this study, lncRNA–miRNA interaction pairs were integrated using the miRcode database (http://www.mircode.org). Then, target genes of DEmiRNA signatures were obtained using three databases: miRDB, miTarBase, and TargetScan. Genes present in all three databases were regarded as target genes of these DEmiRNAs. Comparing predicted target genes with the dysregulated genes in TCGA GC samples, only the remaining overlapping genes and their interaction pairs were used for further analysis.
According to lncRNA–miRNA pairs and miRNA–mRNA pairs, ceRNA networks of H. pylori (+) and H. pylori (−) GC were reconstructed via Cytoscape software. In the two networks, red represents upregulation and green represents downregulation. lncRNAs, miRNAs, and mRNAs in the network are presented as diamonds, round rectangles, and circles, respectively. Simultaneously, we counted the number of interactions of each RNA to identify the key genes in the whole networks.
2.4 Gene Ontology and KEGG pathway analysis
To annotate the different underlying biological processes of dysregulated mRNAs in the H. pylori (+) ceRNA network compared with the H. pylori (−) network, Gene Ontology (GO) Biological Process enrichment analysis was performed using Gene Ontology Consortium (http://www.geneontology.org). KOBAS 3.0 online database (http://kobas.cbi.pku.edu.cn) was used to perform Kyoto Encyclopedia of Genes and Genomes (KEGG) pathway enrichment analysis and then find the H. pylori (+) and H. pylori (−) GC potential pathways. The cut-off criteria of significant GO terms and KEGG pathways was FDR < 0.05. Finally, we compared the enrichment results of H. pylori (+) GC with H. pylori (−) GC and visualized the results using ggplot2 and GOplot R packages.
2.5 Overall survival analysis
Setting the median as the screening standard and according to the tumor expression data of every RNA in the ceRNA network, we classified the H. pylori (+) and H. pylori (−) GC samples into two groups: high expression or low expression. Combined with the overall survival data downloaded from TCGA, we used the survival R package to generate the Kaplan–Meier survival curves. p-values < 0.05 were considered statistically significant.
3 RESULTS
3.1 Data set acquisition and identification of differentially expressed RNAs
From TCGA database, we collected 32 normal adjacent noncancerous tissues, 18 H. pylori (+) and 144 H. pylori (−) gastric adenocarcinoma samples with both clinical data and RNA expression data. Between the 18 H. pylori (+) samples and the 32 control samples, there were 782 upregulated lncRNAs, 637 downregulated lncRNAs, 40 upregulated miRNAs, 42 downregulated miRNAs, 909 upregulated mRNAs, and 1,592 downregulated mRNAs. Between the 144 H. pylori (−) GC samples and the 32 control samples, there were 1,697 upregulated lncRNAs, 528 downregulated lncRNAs, 95 upregulated miRNAs, 35 downregulated miRNAs, 1,633 upregulated mRNAs, and 1,513 downregulated mRNAs. The heat maps and volcano plots of lncRNAs, miRNAs, and mRNAs show the differences between H. pylori (+) and H. pylori (−) GC (Figures 1 and 2).
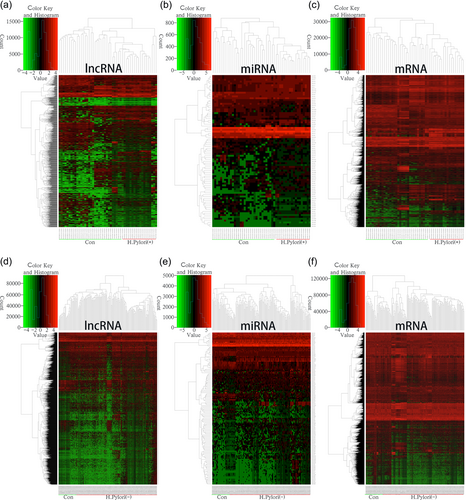
Clustered heat maps of the differentially expressed RNAs in Helicobacter pylori (+)/(−) GC. Rows represent RNAs, whereas columns represent H. pylori (+)/(−) GC samples. #pipe;log2FC#pipe; > 1.5 and FDR < 0.05. (a–c) differentially expressed lncRNAs, miRNAs, and mRNAs in H. pylori (+) GC; (d–f) differentially expressed lncRNAs, miRNAs, and mRNAs in H. pylori (−) GC. FC: folds change; FDR: false discovery rate; GC: gastric cancer; lncRNAs: long noncoding RNAs; miRNAs: microRNAs; mRNAs: messenger RNAs [Color figure can be viewed at wileyonlinelibrary.com]
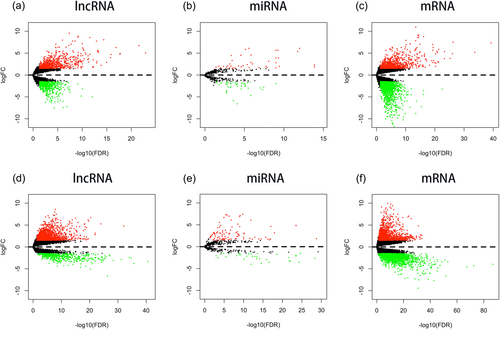
Volcano plots presenting the log2FC and −log10(FDR) and indicating significant RNA expression differences between Helicobacter pylori (+) and H. pylori (−) GC. #pipe;log2FC#pipe; > 1.5 and FDR < 0.05. (a–c) Differentially expressed lncRNAs, miRNAs, and mRNAs in H. pylori (+) GC; (d–f) differentially expressed lncRNAs, miRNAs, and mRNAs in H. pylori (−) GC. FC: folds change; FDR: false discovery rate; GC: gastric cancer; lncRNAs: long noncoding RNAs; miRNAs: microRNAs; mRNAs: messenger RNAs [Color figure can be viewed at wileyonlinelibrary.com]
3.2 ceRNA network construction and analysis
ceRNA networks of H. pylori (+) and H. pylori (−) GC were constructed and are presented in Figures 3 and 4. For a better understanding of the regulatory mechanism differences between these two types, we compared the interactions and RNAs between the two networks. We identified 121 common network RNAs (81 lncRNAs, 9 miRNAs, and 31 mRNAs), 62 RNAs that were specific to H. pylori (+) GC (42 lncRNAs, 5 miRNAs, and 15 mRNAs), and 159 H. pylori (−) GC unique RNAs (101 lncRNAs, 9 miRNAs, and 49 mRNAs). Between the two networks, there were 232 common interactions and 213 H. pylori (+) and 510 H. pylori (−) GC unique interactions.
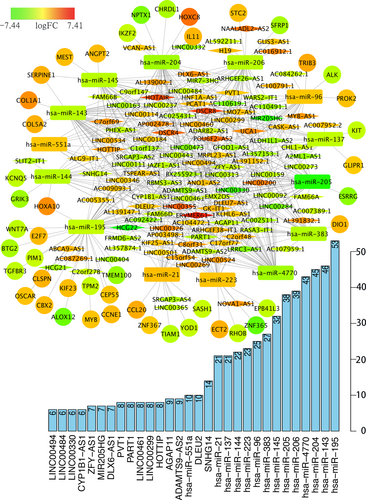
ceRNA networks of Helicobacter pylori (+) GC. Red represents upregulation, and green represents downregulation. LncRNAs, miRNAs, and mRNAs in the networks are represented as diamonds, round rectangles, and circles, respectively. Bar plots show the key genes that have the top interaction number in whole networks. ceRNA: competing endogenous RNA; GC: gastric cancer; lncRNAs: long noncoding RNAs; miRNAs: microRNAs; mRNAs: messenger RNAs [Color figure can be viewed at wileyonlinelibrary.com]
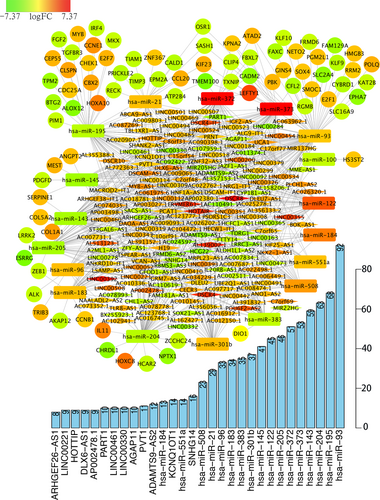
ceRNA networks of Helicobacter pylori (−) GC. Red represents upregulation, and green represents downregulation. LncRNAs, miRNAs, and mRNAs in the networks are represented as diamonds, round rectangles, and circles, respectively. Bar plots show the key genes that have the top interaction numbers in whole networks. GC: gastric cancer; lncRNAs: long noncoding RNAs; miRNAs: microRNAs; mRNAs: messenger RNAs [Color figure can be viewed at wileyonlinelibrary.com]
After counting the interaction numbers of each RNA, we found the top 3 RNAs in the two networks. For the H. pylori (+) GC ceRNA network, they were hsa-miR-195, hsa-miR-143, and hsa-miR-204. For the H. pylori (−) network, the top 3 RNAs were hsa-miR-93, hsa-miR-195, and hsa-miR-204. We hypothesized that they are hub genes and may play important roles in the whole network. Bar plots are shown in Figures 3 and 4.
3.3 Function annotation of ceRNA network
Under the threshold of FDR < 0.05, H. pylori (+) and H. pylori (−) stomach adenocarcinoma DEmRNAs had five common GO biological process enrichment terms. Compared with H. pylori (−) GC, unique GO terms for H. pylori (+) GC were most enriched in cancer-related functions such as cell proliferation, cell adhesion, cell migration, angiogenesis, apoptotic process, JNK cascade, BMP stimulus, and epithelial to mesenchymal transition. In contrast, H. pylori (−) unique cancer-related GO terms were mainly related to cell differentiation, cellular cycle, apoptotic process, vasculature development, and the ERK cascade.
According to KEGG pathway analysis, the H. pylori (+) and H. pylori (−) ceRNA network common cancer-related pathways were PI3K-Akt, Rap1, Ras, and p53 signaling pathways and miRNAs in cancer pathway. Important cancer pathways that were only enriched in H. pylori (+) ceRNA network were as follows: cytokine–cytokine receptor interaction; HIF-1 signaling pathway and Wnt signaling pathway. However, unique pathways of the H. pylori (−) ceRNA network included cell cycle, regulation of actin cytoskeleton, and cAMP signaling pathway. All enrichment results of H. pylori (+) and H. pylori (−) ceRNA networks are shown in Figures 5 and 6.
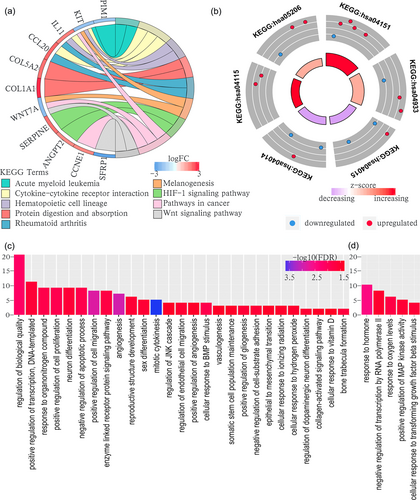
GO biological process and KEGG analyses of the ceRNA networks of Helicobacter pylori (+) GC. (a) Unique results of KEGG analysis; (b) common results of KEGG analysis between H. pylori (+) and H. pylori (−) GC. hsa04933: AGE-RAGE signaling pathway in diabetic complications. hsa05206: MicroRNAs in cancer. hsa04115: p53 signaling pathway. hsa04151: PI3K-Akt signaling pathway. hsa04015: Rap1 signaling pathway. hsa04014: Ras signaling pathway; (c) unique results of GO biological process analysis; (d) common results of GO biological process analysis between H. pylori (+) and H. pylori (−) GC. ceRNA: competing endogenous RNA; GC: gastric cancer; GO: Gene Ontology; KEGG: Kyoto Encyclopedia of Genes and Genomes [Color figure can be viewed at wileyonlinelibrary.com]

GO biological process and KEGG analyses of the ceRNA networks of Helicobacter pylori (−) GC. (a) Unique results of KEGG analysis; (b) common results of KEGG analysis between H. pylori (+) and H. pylori (−) GC. hsa04933: AGE-RAGE signaling pathway in diabetic complications. hsa05206: microRNAs in cancer. hsa04115: p53 signaling pathway. hsa04151: PI3K-Akt signaling pathway. hsa04015: Rap1 signaling pathway. hsa04014: Ras signaling pathway; (c) unique results of GO biological process analysis; (d) common results of GO biological process analysis between H. pylori (+) and H. pylori (−) GC. ceRNA: competing endogenous RNA; GC: gastric cancer; GO: Gene Ontology; KEGG: Kyoto Encyclopedia of Genes and Genomes [Color figure can be viewed at wileyonlinelibrary.com]
3.4 Relevant RNAs associated with survival of patients with H. pylori (+) GC
After testing all of the RNAs in the ceRNA network, survival curves of patients with H. pylori (+) and H. pylori (−) were obtained and are shown in Figure 7, Supporting Information Figures S1 and S2. For patients with H. pylori (+) , three lncRNAs, AP002478.1, LINC00111, and LINC00313, and two mRNAs, MYB and COL1A1, were the relevant RNAs associated with survival time (p-values < 0.05). The results revealed that patients with H. pylori (+) GC with higher expression levels of these five RNAs had shorter overall survival. The five RNAs had mutual interactions through miRNAs: (a) AP002478.1, LINC00111 and LINC00313 may serve as ceRNAs of MYB, and all were predicted to have interactions with hsa-miR-195; (b) LINC00313 may be the ceRNA of COL1A1, and they both interacted with hsa-miR-143. Furthermore, all five survival results were unique in H. pylori (+) GC.
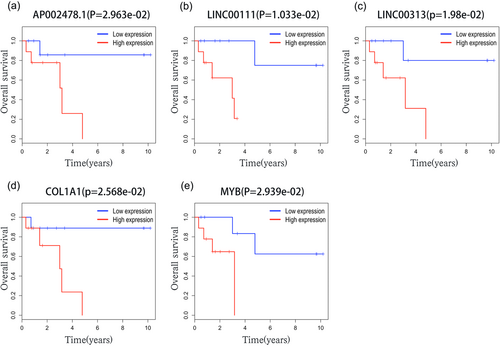
Overall survival analysis of RNAs in the ceRNA network of Helicobacter pylori (+) GC. ceRNA: competing endogenous RNA; GC: gastric cancer [Color figure can be viewed at wileyonlinelibrary.com]
4 DISCUSSION
As a Type I carcinogen, H. pylori is related to various gastric pathologies. The prevalence of H. pylori is higher in adults from developing countries than from developed countries (de Korwin, 2014). Most individuals infected with H. pylori develop asymptomatic gastritis, 10–20% of patients with H. pylori (+) may develop peptic ulcer, and 1% of these infected people have a risk of developing gastric adenocarcinoma (Kusters, van Vliet, & Kuipers, 2006). Although numerous studies have been conducted in H. pylori-related carcinogenesis, the mechanism of H. pylori-induced pathogenesis of stomach tumors remains undefined. Therefore, identifying unique biomarkers for early diagnosis and finding better therapeutic targets plays an important role in conquering H. pylori (+) GC.
Our whole workflow is shown in Figure 8. In our research, a total of 1,419 lncRNAs, 80 miRNAs, and 2,501 mRNAs with differentially expressed profiles were identified in H. pylori (+) GC, and 2,225 lncRNAs, 130 miRNAs, and 3,146 mRNAs were differentially expressed in H. pylori (−) GC. The numbers of the three kinds of differentially expressed RNAs were smaller in H. pylori (+) GC than in H. pylori (−) GC, which revealed that H. pylori (+) GC has less heterogeneity. After construction of lncRNA–miRNA–mRNA ceRNA networks of H. pylori (+) and H. pylori (−) GC, we compared the two networks; the number of common RNAs was 121.
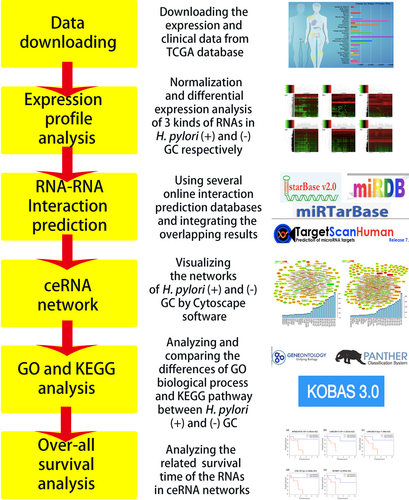
General workflow for evaluation of the Helicobacter pylori (+) and H. pylori (−) RNA expression data. ceRNA, competing endogenous RNA; GC, gastric cancer; GO, Gene Ontology; KEGG, Kyoto Encyclopedia of Genes and Genomes [Color figure can be viewed at wileyonlinelibrary.com]
In the H. pylori (+) network, hsa-miR-195, hsa-miR-143, and hsa-miR-204 were the top three miRNAs that had more interactions than other RNAs. Falzone et al. found that hsa-miR-195-5p shows the highest interaction levels among all miRNAs in colorectal cancer (Falzone et al., 2018). Hsa-miR-195 also has an inhibitory effect on several kinds of cancer, such as laryngeal squamous cell carcinoma, lung cancer, glioma, esophageal carcinoma, and osteosarcoma (Cai et al., 2018; Gao et al., 2017; Li, Wu, Wang, Li, & Shi, 2017; Liu, Liu, Wang, Yang, & Liu, 2017; Qattan et al., 2017; Rizzo et al., 2017; Zhou et al., 2017; Zhou, Yu, Xiong, & Dai, 2018; Zhu et al., 2018). In GC, low expression of hsa-miR-195 may play a role in promoting the genesis and development of the tumor (Shen et al., 2016). Hsa-miR-143 and hsa-miR-204 were also reported to be tumor suppressors. Moreover, hsa-miR-143 inhibits GC cell migration and metastasis by suppressing MYO6 and DNMT3A in GC (Lei et al., 2017; Zhang, Feng, Liu, & Yang, 2017). Decreased hsa-miR-204 in H. pylori (+) GC may promote cancer cell proliferation and invasion by targeting SOX4 (Zhou, Li, Su, & Zhang, 2014). Our study is the first report of the key role of these miRNAs in ceRNA networks, and their downregulation is crucial for the development of both H. pylori (+) and H. pylori (−) GC. More important, H. pylori (+) network had five and H. pylori (−) network had nine unique DEmiRNAs. These unique DEmiRNAs may reveal the vital RNA crosstalk differences between H. pylori (+) and H. pylori (−) GC. Among the five unique DEmiRNAs of the H. pylori (+) network, hsa-miR-4770 had the highest interaction level. However, there are few studies about hsa-miR-4770. Considering its unique role in H. pylori (+) ceRNA network, we believe that hsa-miR-4770 weighed heavily in the process of H. pylori-induced gastric carcinoma.
GO and KEGG pathway analyses have been used to evaluate the enriched biological functions. The DEmRNA-related GO analysis revealed that for H. pylori (+) GC, infection of H. pylori promotes cell proliferation, migration, angiogenesis, and epithelial to mesenchymal transition, participates in JNK cascade, BMP stimulus signal and inhibits cell–substrate adhesion and apoptotic process. The pathway analysis further demonstrated that in H. pylori (+) GC, three unique pathways (cytokine–cytokine receptor interaction, HIF-1 signaling pathway, and Wnt signaling pathway) were enriched. Therefore, the enrichment results might support that the H. pylori (+) ceRNA network plays essential roles via those pathways in gastric carcinoma. Membrane-bound β-catenin degradation is enhanced in H. pylori (+) infected GC cells, which leads to decreased cell adhesion (Das et al., 2017). Urease from H. pylori was reported to contribute to angiogenesis, and via the cyclooxygenase-2 pathway in GC, H. pylori promotes angiogenesis depending on Wnt/β-catenin-mediated vascular endothelial growth factor (Liu et al., 2016; Olivera-Severo et al., 2017). Furthermore, many cytokines were involved in the development of H. pylori (+) GC, such as the interleukin family (Bockerstett & DiPaolo, 2017). Tumor hypoxia is recognized in oncology as a key factor resulting in poor prognosis, and studies have shown that H. pylori can stabilize HIF-1α (Rivas-Ortiz, Lopez-Vidal, Arredondo-Hernandez, & Castillo-Rojas, 2017). All these above points prove that our ceRNA network reflects vital mechanisms of H. pylori (+) GC.
According to the overall survival analysis, three lncRNAs and two mRNAs functioned as prognostic biomarkers for patients with H. pylori (+) GC. AP002478.1 is a kind of antisense lncRNA, and LINC00111 and LINC00313 are lincRNAs. To date, neither AP002478.1 nor LINC00111 had been reported in any medical fields. Li et al. found that higher expression of LINC00313 indicated poor prognosis of lung cancer (Li et al., 2015). For the first time, we found these three novel lncRNAs play significant roles in H. pylori (+) GC. As the constructed ceRNA network showed, all of these three lncRNAs react with hsa-miR-195. Two mRNAs related to H. pylori (+) GC overall survival time are MYB and COL1A1. MYB, an oncogene, is a transcription factor that has been implicated in several tumors, including GC, colonic carcinoma, breast cancer, and non-small-cell lung cancer (Fan et al., 2018; Liang et al., 2015; Ramsay et al., 1992; Tao et al., 2014). COL1A1 encode the α1 chain of type I collagen and has also been studied in many cancers. Su et al. reported that COL1A1 was commonly upregulated in stomach tumors and was associated with cancer invasion and metastasis (Su, Qiu, & Zhang, 1999). Li et al. reported that COL1A1 might have potential as a monitoring factor to screen early GC and might predict poor outcomes in patients with GC (Li, Ding, & Li, 2016). Although much research has been devoted to the study of MYB and COL1A1, there are no reports suggesting that MYB and COL1A1 may act as H. pylori (+) GC survival biomarkers.
However, there were several limitations to this study. Only a small number of patients with H. pylori (+) GC were available in TCGA database and thus more datasets are required for further validation. The aforementioned results, including the ceRNA regulatory network and their functional effects, still need to be validated by experiments, which will be conducted in our further studies.
In conclusion, we determined the differences in the ceRNA regulatory networks between H. pylori (+) and H. pylori (−) GC. These key RNAs might have clinical utility for the diagnosis and prognosis prediction in H. pylori (+) GC. The results of the current study might be the foundation for future basic and clinical research.
ACKNOWLEDGMENTS
This study was financially supported by the National Natural Science Foundation of China (Nos. 31671468 and 81602593), the Chinese Postdoctoral Science Foundation (No. 2016M602152), the Shandong Provincial Natural Science Foundation of China (Nos. ZR2016HM15, ZR2015HM018, ZR2017MH071, and ZR2018MH021), and the Shandong Provincial Postdoctoral Innovation Project (201702047).
CONFLICTS OF INTEREST
The authors declare that there are no conflicts of interest.


