Understanding molecular biology of codon usage in mitochondrial complex IV genes of electron transport system: Relevance to mitochondrial diseases
Abstract
The mitochondrial cytochrome oxidase (CO) genes are involved in complex IV of the electron transport system, and dysfunction of CO genes leads to several diseases. However, no work has been reported on the codon usage pattern of these genes. We used bioinformatic methods to analyze the compositional properties and the codon usage pattern of the COI, COII, and COIII genes in fishes, birds, and mammals to understand the similarities and dissimilarities of codon usage in these genes, which gave an insight into the molecular biology of these genes. The effective number of codons (ENC) value of genes was high in different species of fishes, birds and mammals, which indicates that the codon bias of CO genes was low and the ENC values were significantly different among fishes, birds, and mammals, as revealed from the t test. The overall guanine and cytosine (GC) content in fishes, birds, and mammals was lower than 50% in all genes, indicating that the genes were AT-rich and significantly different among fishes, birds, and mammals. The TCA codon was overrepresented in fishes, birds, and mammals for the COI gene, in birds and mammals for the COII gene, but it was not overrepresented in others. Only three codons, namely CTA, CGA, and AAA, were overrepresented in all three groups for the COI, COII, and COIII genes, repectively. From the neutrality plot in fishes, birds, and mammals, it was observed that the slopes of the regression lines (regression coefficients) in the COI, COII, and COIII genes were <0.5, suggesting that natural selection played a major role, whereas mutation pressure played a minor role.
1 INTRODUCTION
Several metabolic enzyme systems function within mitochondria. These include the components of TCA (tricarboxylic acid) cycle enzymes and the β-oxidation pathway of fatty acids (H. Liu et al., 2014). Mitochondrial diseases are the results of either inherited or spontaneous mutations in mitochondrial DNA (mtDNA) or mDNA, which lead to altered functions of the proteins or RNA molecules that normally reside in mitochondria (Wallace, 1992). Mitochondrial dysfunction is involved in various diseases, such as cancer and neurodegenerative disorders, including Alzheimer's and Parkinson's diseases (Burté, Carelli, Chinnery, & Yu-Wai-Man, 2015). From previous studies, it was observed that mtDNA mutations have been associated with cancers (Modica-Napolitano & Singh, 2004). So, mutations in mtDNA might be expected to influence the gene expression and copy number of the mitochondrial genome. Different mutations, such as point mutation, insertion, deletion, and duplication of mitochondrial genes, have been reported in leukemia, ovarian, lung, brain, bladder, and breast cancers (Clayton & Vinograd, 1967). A 40-base pair insertion in the COI gene has been detected in renal cell oncocytoma (Welter, Kovacs, Seitz, & Blin, 1989). In a study on European and African American descendants consisting of 260 patients with prostate cancer and 54 without cancer, it was also found that the frequency of COI missense mutations was significantly higher in prostate cancer patients than in controls without cancer (Petros et al., 2005). It was further revealed that cytochrome c oxidase activity decreased in the biopsy samples of human colonic adenocarcinoma against normal colon mucosa (Sun, Sepkowitz, & Geller, 1981), and in cultured rat HC252 hepatoma cells against nonneoplastic liver (Sun & Cederbaum, 1980).
Apart from the Alzheimer's disease (AD) and Parkinson's disease, the mitochondrial dysfunctions are also responsible for many neurodegenerative diseases like Huntington's disease (HD) (Hroudová, Singh, & Fišar, 2014) and other diseases. Several lines of evidence have suggested that defects in mitochondrial metabolism, particularly in the electron transport chain (ETC), have been associated with the pathogenesis of AD. Mitochondrial dysfunction leads to insufficient ATP production and is more prone to generate reactive oxygen species (ROS) and proapoptotic factors at an early stage of various mitochondrial diseases, such as neurodegenerative diseases (Barnham, Masters, & Bush, 2004). Earlier studies reported that deficiencies in ETC, particularly complex I and cytochrome c oxidase (complex IV, CO), are associated with AD and complex III in HD (Morán et al., 2012). The deficiency of cytochrome c oxidase enzyme, specifically the mutations in the COI, COII, and COIII genes of mitochondria, is associated with Leigh syndrome in humans (Barrientos et al., 2002; DiMauro, Tanji, & Schon, 2012). Mutations in 11 mitochondrial genes have been reported to cause mitochondrial DNA-associated Leigh syndrome (Taylor & Turnbull, 2005).
The complex IV of the mitochondrial electron transport system (ETS) involves the products of cytochrome c oxidase genes and is coupled with a number of polypeptide subunits (Yoshikawa, Shinzawa-Itoh, & Tsukihara, 1998). Three largest subunits, namely, COI, COII, and COIII, form the core enzymes encoded by the mtDNA (L. J. C. Wong, 2007), and the other subunits, which are the products of the nuclear genes, are in fact transferred to mitochondria from the cytosol via different pathways (Barrientos et al., 2002). It was reported earlier that encephalomyopathy and Leigh syndrome in human are associated with the deficiency of cytochrome c oxidase enzyme resulting from the mutation in the COI, COII, and COIII genes (Barrientos et al., 2002; DiMauro et al., 2012).
The genetic code is degenerate in nature, and the triplet codons encode specific amino acids during translation of mature messenger RNA (mRNA) molecule in a linear order into protein (Gustafsson, Govindarajan, & Minshull, 2004). The genetic code in vertebrate mitochondria comprises 60 sense and synonymous codons that represent 20 standard amino acids, and the remaining four codons act as termination signals, namely TAA, TAG, AGA, and AGG (Knight, Freeland, & Landweber, 2001). Unequal use of the synonymous codons of an amino acid in mature mRNA molecule is known as codon usage bias (CUB), which is a unique feature in the genome/transcriptome of organisms and is found to be species-specific (Behura & Severson, 2012; Prat, Fromer, Linial, & Linial, 2009). The most remarkable theory that explains the origin of CUB is the selection-mutation-drift theory, which proposes that CUB in an organism is mainly affected by mutation pressure, genetic drift, and natural selection (Bulmer, 1991; Jenkins & Holmes, 2003). In addition, other genomic factors, namely, guanine and cytosine (GC) contents at the codon third position (L. Chen et al., 2013), gene expression level (Blake, Kærn, Cantor, & Collins, 2003), and gene length (Duret & Mouchiroud, 1999), are also considered to influence the codon usage patterns in different organisms. However, the main driving forces of CUB vary greatly across different species (Duret & Mouchiroud, 1999).
Earlier findings suggested that the codon usage trend in the highly expressed genes is due to the phenomenon of translational selection (Reis, Savva, & Wernisch, 2004). In these highly expressed genes, the preferred codons are easily recognized by the abundant transfer RNA (tRNA) molecules (Bibb, Findlay, & Johnson, 1984; McEwan & Gatherer, 1999). Two major aspects that mainly affect the CUB in different species are compositional constraints under mutation pressure and natural selection (Sharp, Stenico, Peden, & Lloyd, 1993; Sharp, Tuohy, & Mosurski, 1986). The change in certain bases more recurrently than others may cause mutation biases (Francino & Ochman, 2001; Green, Ewing, Miller, Thomas, & Green, 2003). In some prokaryotes and many mammals, mutation pressure is thought to be the major evolutionary force responsible for the variation in codon usage with extremely high A+T or G+C contents (Sharp et al., 1993; Zhao, Zhang, Chen, Zhao, & Zhong, 2007). On the other hand, the patterns of codon usage are mainly due to translational selection in Drosophila and some plants (Q. Liu, Feng, Zhao, Dong, & Xue, 2004). Nonsynonymous substitution precedes natural selection due to change of amino acids in the protein and thus influences the protein's biochemical properties (Plotkin & Kudla, 2011). The codon usage pattern in fast-growing organisms with a large population size is mainly governed by natural selection (Green et al., 2003; Ikemura, 1982; Ikemura, 1985; Sharp & Li, 1987). However, in mammals, due to small population size in many species, the effects of natural selection are low (Duret, 2002; Sharp, Averof, Lloyd, Matassi, & Peden, 1995). Genetic drift also affects the codon bias in some organisms (Keightley, Lercher, & Eyre-Walker, 2005; Sharp et al., 1995). Besides, except for some nonmammalian species, highly expressed genes with high codon bias are the effects of selection pressure to minimize the error in gene expression (Hershberg & Petrov, 2008). In general, the competence of gene expression is due to genetic code redundancy governed by selective forces (Gingold & Pilpel, 2011).
Moreover, codon usage decreases the proofreading expenses by reducing the time and energy required to discard the noncognate tRNAs (Bulmer, 1991). Use of less preferred codons in mRNA would raise the proofreading expenses and might result in a net decline in protein levels. In Escherichia coli, the association between codon bias and the level of gene expression has been experimentally established (Andersson & Kurland, 1990). Likewise, in in vitro studies, the expression proficiency has been shown to be significantly increased by using the preferred codons of the host cell in heterologous genes of cultured eukaryotic cells (Kim, Oh, & Lee, 1997).
The parameters that are used extensively in the codon bias study are the effective number of codons (ENC), the frequency of optimal codon, codon bias index, intrinsic codon deviation index, and codon adaption index (Freire-Picos et al., 1994; Tanguy et al., 2008; Wright, 1990). Analysis of CUB has immense importance in understanding the genome evolution (Sharp & Matassi, 1994). It has a significant impact on the better understanding of the molecular biology and evolution (Yang, Luo, & Cai, 2014), heterologous gene expression (Kane, 1995), prediction of expression level (Gupta, Bhattacharyya, & Ghosh, 2004), and prediction of gene function (Lin, Kuang, Joseph, & Kolatkar, 2002), design of transgenes (Yang et al., 2014), new gene discovery (Yang et al., 2014), determination of the origin of species (Ahn, Jeong, Bae, Jung, & Son, 2006), and design of primers (Zheng et al., 2007).
Mitochondria are ubiquitous intracellular organelles that are involved in a series of cellular events such as intracellular calcium signaling and apoptosis, and, further, mitochondria play an important role in cellular energy metabolism through several complexes of the ETS (Gao, 2010). The origin of the mitochondria in a eukaryotic cell is still a matter of dispute. Different theories have been proposed to explain the origin of mitochondria, and the hypothesis of mitochondrial origin from the alphaproteobacteria seems to be universally accepted (Keeling & Doolittle, 1997). During the period of evolution, the bacterial genome might have become smaller and simpler due to the transfer of nearly all the genetic material to the nucleus (Claverie, 2006). The evolutionary patterns of genomic and mitochondrial DNA appear to be different (Tamura & Nei, 1993). The endosymbiotic origin of mitochondria is represented by two main theories, one of which reveals that the mitochondrion was engulfed by the eukaryotes (Embley & Martin, 2006) and the other hypothesizes that prokaryotic host got hold of the mitochondrion (Embley & Martin, 2006). However, earlier studies believed that mitochondrial DNA has passed through neutral evolution due to the presence of some independent organelles inside the cell (Wise, Sraml, & Easteal, 1998). However, a later result denied those findings, and it is now supposed that mitochondrial DNA has undergone positive and negative selection (Rand & Kann, 1998; Rand, Dorfsman, & Kann, 1994). Plenty of proof supports the existence of coevolution and coadaption between nuclear and mitochondrial genomes (Dowling, Friberg, & Lindell, 2008; Gemmell, Metcalf, & Allendorf, 2004; Rand, Haney, & Fry, 2004). Moreover, different nucleobase substitution rates have been established in these two genomes, where the mitochondrial DNA shows a higher rate of nucleotide substitution than that of the nuclear DNA (Pesole, Gissi, De Chirico, & Saccone, 1999).
CUB is a spectacular feature of a gene/genome, which helps in understanding its molecular biology, genetics, and evolutionary relationship (Clark et al., 2007). The MT-CO gene is one of the important genes in complex IV of ETS that produces the energy currency ATP in the cell, and its mutation causes various diseases. Analysis of CUB in the MT-CO gene is of special interest to elucidate the interrelations, if any, of the energy requirements of fishes, birds and mammals with the codon usage patterns against fast environmental changes during evolution. We investigated the compositional properties and the codon usage patterns of mitochondrial CO genes in different species belonging to fishes, birds, and mammals that thrive in aquatic, aerial, and terrestrial environments, respectively, as no comparative work has yet been reported. This study gives insights into molecular biology and paves the way to better understand the molecular evolution of the gene. Besides, this study would be a preparatory work for designing synthetic CO genes for modulating gene expression in future.
2 METHODOLOGY
2.1 Sequence data
The coding sequences (cds) of mitochondrial cytochrome oxidase (CO) genes, namely COI, COII, and COIII, for each of the 100 species of fishes, birds, and mammals were retrieved from the Nucleotide database of NCBI (http://www.ncbi.nlm.nih.gov/). The accession numbers along with species of fishes, birds, and mammals used in the study are shown in Supporting Information S1. In our current analysis, a total of 900 cds of CO genes, each having correct start and stop codons with an exact multiple of three bases, were used. The analysis is based on the genetic code of vertebrate mitochondria (Translation Table 2 of NCBI). In this genetic code, Met and Trp are encoded by two codons each, and there are four termination codons, namely, TAA, TAG, AGA, and AGG. Met amino acid is encoded by two codons, namely, ATG and ATA, whereas Trp is encoded by two codons, namely, TGG and TGA, unlike the standard genetic code (Mazumder, Uddin, & Chakraborty, 2016).
2.2 Compositional properties
The base compositions (A, T, G, and C) of the COI, COII, and COIII genes, their nucleotide compositions at the third position of codons (A3, T3, G3. and C3), overall GC contents, GC contents at the first (GC1), second (GC2), and third position (GC3) of codon in percentage were calculated for each coding sequence (cds) using an in-house Perl script developed by SC (corresponding author).
2.3 Relative synonymous codon usage
2.4 Effective number of codons
The ENC is a measure of CUB, which is independent of gene length and the number of amino acids (Wright, 1990). A low ENC value (<35) indicates high codon bias in the gene (Wright, 1990).
ENC quantifies how far the codon usage of a gene departs from the equal usage of synonymous codons.
2.5 Correspondence analysis
To investigate the major trend in the codon usage variation among the genes, correspondence analysis (COA) is used, which allocates the codons in two axes, namely axis1 (F1) and axis 2 (F2) (Shields & Sharp, 1987). It was performed using the “Past” software based on the RSCU values of the CO genes among fishes, birds, and mammals.
2.6 Neutrality plot
The neutrality plot, a graphical plot of GC12 (average of GC1 and GC2) on GC3, delineates the role of directional mutational pressure against natural selection. In this plot, the regression coefficient of GC12 on GC3 is considered as the equilibrium condition of mutation-selection pressure (Sueoka, 1988).
2.7 Grand average of hydropathy
The grand average of hydropathy (GRAVY) score was estimated from the sum of the products of the frequency of each amino acid and the corresponding hydropathy index of each amino acid (Kyte & Doolittle, 1982). Positive GRAVY value indicates the hydrophobic nature of the protein, but the negative value represents the hydrophilic nature of the protein.
2.8 Aromaticity
Aromaticity means the frequency of aromatic amino acids (Phe, Tyr, Trp) present in the translated gene product (Lobry & Gautier, 1994).
2.9 Statistical analysis
Correlation analysis was performed to quantify the relationship between overall nucleotide composition and its composition at the third codon position. All the statistical analyses were done using the SPSS software.
3 RESULTS
3.1 Analysis of CUB in mitochondrial CO gene
The mean ENC values were 47.91, 40.95, and 46.07 in fishes, birds, and mammals, respectively, for the COI gene. In the COII gene, the ENC values were 42.27, 37.2, and 41.2 in fishes, birds, and mammals, respectively, whereas in the COIII gene, the ENC values were 47.02, 44.18, and 48 in fishes, birds, and mammals, respectively. The ENC values of COII genes were comparatively lower than COI and COIII genes; however, the ENC values of birds were lower than fishes and mammals. Together, these results show that the ENC value was higher in different species of fishes, birds, and mammals, which indicates that a weak codon bias exists in CO genes and the codon bias is maintained at a stable level (Z. Zhang, Dai, & Dai, 2013). Further, we performed a t test to explore the difference of ENC values in fishes, birds, and mammals for the COI, COII, and COIII genes and found that ENC values were significantly different between fishes and birds, fishes, and mammals, and birds and mammals for the COI, COII, and COIII genes (Supporting Information S2; except between fishes and mammals for COII genes).
3.2 Compositional features of mitochondrial CO gene among fishes, birds, and mammals
It was reported earlier that the overall nucleotide composition might influence the CUB of a genome (Jenkins & Holmes, 2003). Therefore, we analyzed the nucleotide composition in the cds of different species of fishes, birds, and mammals. In the COI gene, the nucleobases T and C were higher in fishes, C and A in birds, and T and A in mammals (Figure 1), whereas in the COII gene, the nucleobases A and C were higher in fishes, C and A in birds, and A and T in mammals. In the COIII gene, the nucleobases T and C were higher in fishes, C and A in birds, and the nucleobases T and A were higher in mammals. However, the nucleobase G was the lowest in fishes, birds, and mammals in all three genes. Besides, the nucleotide composition at the third position of the codon (A3%, T3%, G3%, and C3%) revealed a clear picture of the preference of codons in different species of fishes, birds, and mammals. In the COI gene, the nucleobases C and A were higher in fishes and birds, but A and T were higher in mammals (Figure 1). In case of the COII gene, the nucleobases A and C were higher in fishes and mammals, but in birds, the nucleobases C and A were higher. Similarly, for the COIII gene, A and C were higher in fishes, birds, and mammals. Interestingly, we observed that the nucleobase G was the lowest in fishes, birds, and mammals for all the mitochondrial CO genes (Figure 1). These results suggested the unequal distribution of nucleotide compositions in fishes, birds, and mammals for CO genes.
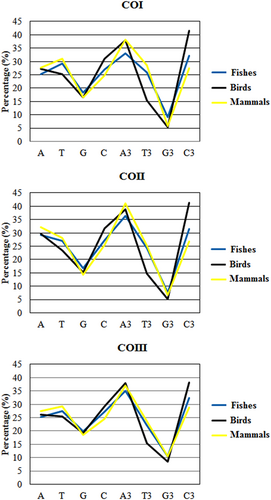
Nucleotide composition and its composition at the third codon position for the MT-COI, COII, and COIII genes. CO: cytochrome oxidase [Color figure can be viewed at wileyonlinelibrary.com]
The overall GC content in fishes, birds, and mammals was lower than 50% in all genes, indicating that the genes were AT-rich (Figure 2). It was further observed that among fishes, birds, and mammals, the overall GC content was higher in birds followed by fishes and mammals in all genes. In addition, we performed a t test and observed (Supporting Information S3) that the overall GC content was significantly different between fishes and birds, fishes and mammals, and birds and mammals. The unequal distribution of GC content at the first, second, and third codon positions was found in CO genes, and it also differed in fishes, birds, and mammals (Figure 2). The above findings suggested that the mutation pressure on the compositional constraints might influence the codon usage of mitochondrial CO genes among the selected species of fishes, birds, and mammals (Uddin & Chakraborty, 2015).
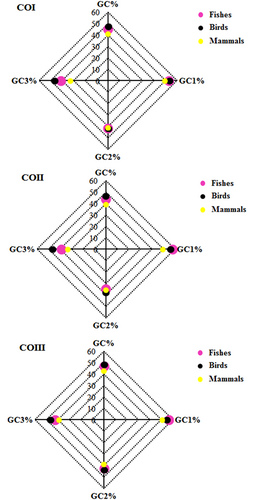
Overall GC content and its content at codon's first, second, and third position in fishes, birds, and mammals for the COI, COII, and COIII genes. CO: cytochrome oxidase; GC: guanine and cytosine [Color figure can be viewed at wileyonlinelibrary.com]
3.3 Codon usage pattern of CO gene in fishes, birds and mammals
We performed correlation analysis between the usage of each codon and GC3 content to explore the relationship of the general codon usage difference and GC bias. From Figure 3, it can be seen that most of the AT-ending codons were negatively correlated with GC3, but a majority of the GC ending codons were positively correlated with GC3 in fishes, birds, and mammals. However, the pattern of correlation was slightly different in birds and mammals for the COIII gene. These results suggested that the GC-ending codons would have increasing usage, whereas AT-ending codons would show decreasing usage with the increase in GC3 values. Thus, it revealed that GC3 content might have a great significance in determining the molecular organization of CO genes (Palidwor, Perkins, & Xia, 2010).
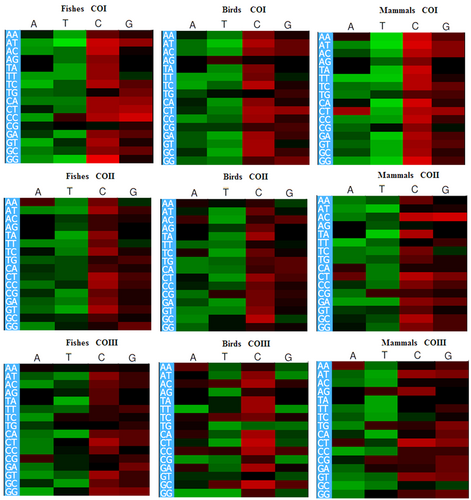
Correlation between codon usage and GC3 for COI, COII, and COIII among fishes, birds, and mammals, respectively. Red and green color indicates positive and negative correlation, respectively. Black color indicates stop codons. CO: cytochrome oxidase; GC: guanine and cytosine [Color figure can be viewed at wileyonlinelibrary.com]
To examine the unequal usage of synonymous codons for mitochondrial CO genes across the species of fishes, birds, and mammals, the RSCU values of individual codons for each cds were estimated and compared. The TCA codon was overrepresented in fishes, birds, and mammals for the COI gene, in birds and mammals for the COII gene, but it was not overrepresented in others. The CAA codon was overrepresented in fishes, birds, and mammals for the COI (except the COI gene in fishes), COII, and COIII genes, respectively. The TGC codon was overrepresented in fishes and birds for the COI gene only. Three codons, namely, CTA, CGA, and AAA, were overrepresented in all three groups for the COI, COII, and COIII genes, respectively. It was also observed that the codon TGA was overrepresented in fishes, birds, and mammals for the COI, COII, and COIII (except COIII in fishes) genes, respectively (Figure 4). Furthermore, the heat map clearly showed the overrepresented and the underrepresented codons as well as the codon usage patterns, which varied in three CO genes among the selected species of fishes, birds, and mammals. Therefore, based on the analysis of nucleotide composition and RSCU values of individual codons in the cds of CO genes, it was clear that mutation pressure affected the compositional constraints and codon usage patterns of the COI, COII, and COIII genes among fishes, birds, and mammals (Behura & Severson, 2012).
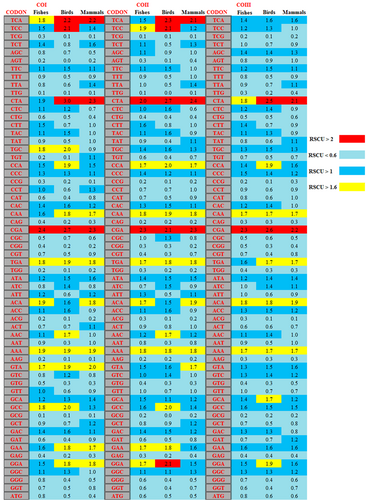
Heat map using RSCU values of each codon among fishes, birds, and mammals for the COI, COII, and COIII genes, respectively. CO: cytochrome oxidase; RSCU: relative synonymous codon usage [Color figure can be viewed at wileyonlinelibrary.com]
3.4 Relationship between overall nucleotide composition and its composition at third codon position
Two evolutionary forces, namely, mutation pressure and natural selection, influence the codon usage pattern of a genome. Mutation pressure was found to affect the whole genome, which accounted for the majority of codon usage among different RNA viruses (Z. Zhang et al., 2013). We performed a correlation analysis between overall nucleotide composition and nucleotide composition at the third codon position to decide whether the evolutionary process was mostly influenced by mutation pressure alone or by both mutation pressure and natural selection. In fishes, birds, and mammals for CO genes, a highly significant (p < 0.01) positive correlation was found between homogenous nucleotide composition, and its third codon position, whereas a significant (p < 0.05) negative correlation was observed in most of other nucleotide comparisons as shown in Table 1. These results suggested that the compositional constraints, resulting from mutation pressure and natural selection, might have determined the codon usage pattern in the COI, COII, and COIII genes in these groups (Z. Zhang et al., 2013).
| Genes | Group | Nucleotide | A3% | T3% | G3% | C3% | GC3% |
|---|---|---|---|---|---|---|---|
| COI | Fishes | A % | **0.961 | −0.026 | **−0.723 | **−0.446 | **−0.660 |
| T % | −0.024 | **0.981 | −0.092 | **−0.732 | *−0.675 | ||
| G % | **−0.599 | −0.098 | **0.938 | *0.214 | **0.477 | ||
| C % | **−0.518 | **−0.713 | *0.219 | **0.975 | **0.914 | ||
| GC % | **−0.607 | **−0.683 | **0.505 | **0.871 | **0.973 | ||
| Birds | A % | **0.962 | 0.080 | **−0.608 | **−0.417 | **−0.695 | |
| T % | 0.082 | **0.950 | −0.163 | **−0.786 | **−0.746 | ||
| G % | **−0.273 | **−0.424 | **0.775 | **0.259 | **0.509 | ||
| C % | **−0.447 | **−0.684 | 0.172 | **0.895 | **0.905 | ||
| GC % | **−0.510 | **−0.755 | **0.455 | **0.860 | **0.978 | ||
| Mammals | A % | **0.967 | 0.059 | **−0.635 | *−0.247 | **−0.434 | |
| T % | 0.118 | **0.992 | * −0.242 | **−0.942 | **−0.890 | ||
| G % | **−0.508 | −0.110 | **0.909 | 0.078 | **0.326 | ||
| C % | **−0.283 | **−0.953 | *0.234 | **0.991 | **0.932 | ||
| GC % | **−0.474 | **−0.909 | **0.497 | **0.947 | **0.991 | ||
| COII | Fishes | A % | **0.942 | **−0.281 | **−0.602 | −0.130 | −0.405 |
| T % | −0.159 | **0.952 | 0.073 | **−0.815 | **−0.722 | ||
| G % | **−0.426 | −0.010 | **0.891 | −0.122 | **0.270 | ||
| C % | **−0.296 | **−0.678 | −0.111 | **0.952 | **0.846 | ||
| GC % | **−0.448 | **−0.638 | **0.265 | **0.837 | **0.928 | ||
| Birds | A % | **0.896 | −0.080 | **−0.501 | **−0.316 | **−0.471 | |
| T % | −0.088 | **0.941 | 0.017 | **−0.794 | **−0.739 | ||
| G % | **−0.496 | −0.026 | **0.767 | 0.101 | **0.339 | ||
| C % | **−0.292 | **−0.814 | −0.033 | **0.962 | **0.890 | ||
| GC % | **−0.459 | **−0.715 | **0.317 | **0.851 | **0.914 | ||
| Mammals | A % | **0.960 | 0.116 | **−0.553 | **−0.383 | **−0.646 | |
| T % | 0.112 | **0.945 | 0.022 | **−0.889 | **−0.760 | ||
| G % | **−0.706 | −0.189 | **0.875 | 0.191 | **0.572 | ||
| C % | **−0.421 | **−0.817 | 0.014 | **0.980 | **0.863 | ||
| GC % | **−0.582 | **−0.776 | **0.266 | **0.925 | **0.938 | ||
| COIII | Fishes | A % | **0.908 | *−0.241 | **−0.614 | −0.119 | **−0.619 |
| T % | −0.166 | **0.777 | 0.002 | **−0.328 | **−0.392 | ||
| G % | **−0.569 | *0.246 | **0.910 | **−0.430 | **0.337 | ||
| C % | 0.164 | **−0.549 | **−0.413 | **0.981 | **0.530 | ||
| GC % | **−0.643 | **−0.312 | **0.523 | **0.335 | **0.863 | ||
| Birds | A % | **0.921 | **−0.548 | **−0.703 | *0.219 | −0.109 | |
| T % | **−0.381 | **0.945 | **0.464 | **−0.822 | **−0.722 | ||
| G % | **−0.663 | **0.438 | **0.893 | **−0.402 | −0.039 | ||
| C % | 0.010 | **−0.723 | **−0.483 | **0.958 | **0.872 | ||
| GC % | **−0.734 | 0.044 | **0.500 | 0.179 | **0.475 | ||
| Mammals | A % | **0.643 | 0.022 | **−0.425 | −0.023 | **−0.453 | |
| T % | 0.024 | **0.865 | 0.061 | **−0.595 | **−0.653 | ||
| G % | **−0.696 | 0.143 | **0.912 | **−0.677 | **0.292 | ||
| C % | **0.363 | **−0.565 | **−0.610 | **0.971 | *0.235 | ||
| GC % | **−0.470 | **−0.620 | **0.274 | **0.391 | **0.801 |
- Note. CO: cytochrome oxidase.
In addition, if mutation pressure solely determines the codon usage pattern, the frequencies of nucleotides A and T should be equal to that of G and C at the third position of the codon, which is mostly synonymous. However, the frequencies of these nucleotides at the third codon positions were not the same in fishes, birds, and mammals for the COI, COII, and COIII genes revealing that other factors such as natural selection might have played a role in the codon usage pattern of these genes (Z. Zhang et al., 2013).
3.5 COA of mitochondrial CO genes among fishes, birds, and mammals
To investigate the trends in the codon usage variation among different species of fishes, birds, and mammals for the CO genes, we performed COA using RSCU values of codons, as shown in Figure 5. The plots of fishes, birds, and mammals were different and these also differed among CO genes, which suggested that the pattern of codon usage was different in these genes across three groups. Further, in all the three genes, most of the codons were found to be located close to the axes with a concentrated distribution around the center of the plots in fishes, birds, and mammals (Figure 5), indicating that the base composition for mutation bias might correlate to the CUB. However, a few codons were found in a discrete distribution, suggesting that natural selection might have also affected the codon usage of the COI, COII, and COIII genes to some extent (Wei et al., 2014).
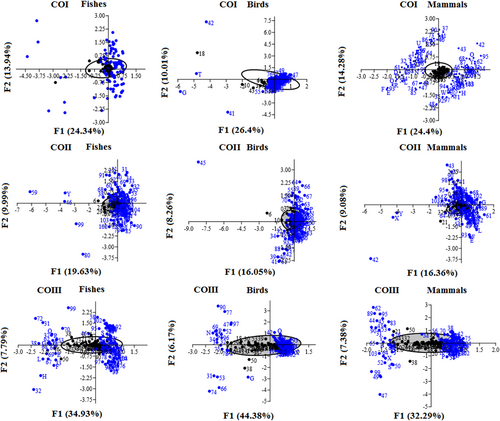
Correspondence analysis of the synonymous codon usage for the COI, COII, and COIII genes in fishes, birds, and mammals, respectively. CO: cytochrome oxidase [Color figure can be viewed at wileyonlinelibrary.com]
3.6 Parity plot analysis
The parity plot analysis is used to evaluate the relative influence of mutational pressure and natural selection in the genome. If the mutation pressure alone affects the CUB in a gene, G and C (A and T) should be used equally, whereas natural selection would not necessarily cause the proportional use of G and C (A and T) (H. Chen, Sun, Norenburg, & Sundberg, 2014). We plotted [G3/(G3+C3)] along the y-axis and [A3/(A3+T3)] along the x-axis of the graphical plot for the COI, COII, and COIII genes in fishes, birds, and mammals, respectively, as shown in Figure 6. In our analysis, we observed that AT and GC were not proportionally used, which suggested that both natural selection and mutation pressure might have affected the CUB of the mitochondrial COI, COII, and COIII genes in fishes, birds, and mammals, respectively (H. Chen et al., 2014).
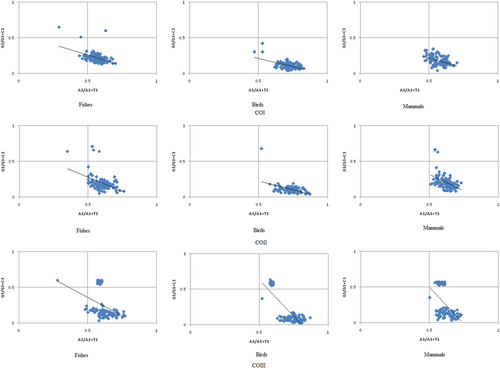
Parity plot analysis of COI, COII, and COIII for fishes, birds, and mammals. CO: cytochrome oxidase [Color figure can be viewed at wileyonlinelibrary.com]
3.7 Neutrality plot of mitochondrial CO gene among fishes, birds, and mammals
The neutrality plot of GC12 (average of GC1 and GC2) versus GC3 was drawn to quantify the degree of natural selection and mutation pressure in the codon usage of CO genes. In the neutrality plot, we found a narrow range of GC3 distribution in CO genes among fishes, birds, and mammals, which suggested that natural selection might have influenced the CUB of these genes. Moreover, in fishes, the slopes of the regression lines (regression coefficient) were 0.044, 0.05, and 0.052, respectively, whereas in birds, the slopes were 0.044, 0.035, and 0.148 for the COI, COII, and COIII genes, respectively. However, in mammals, the slopes of the regression lines were 0.031, 0.116, and 0.051, respectively, for the COI, COII, and COIII genes (Figure 7). These results suggested that natural selection might have played a major role, whereas mutation pressure played a minor role in shaping the CUB of CO genes across fishes, birds, and mammals (Y. Chen, 2013; He et al., 2016; Jia et al., 2015).
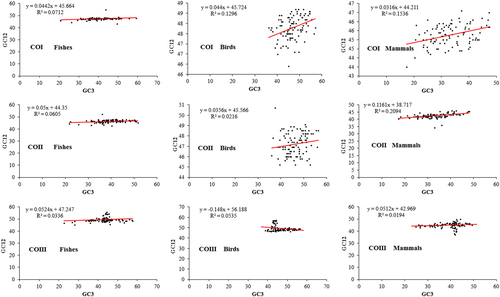
Neutrality plot of GC12 with GC3 in different species of fishes, birds, and mammals for the COI, COII, and COIII genes, respectively. CO: cytochrome oxidase; GC: guanine and cytosine [Color figure can be viewed at wileyonlinelibrary.com]
3.8 Interrelationship between CUB and various skews
It was earlier reported that the skewness of nucleotides influenced the CUB (Choudhury, Uddin, & Chakraborty, 2017). We, therefore, estimated GC, AT, purine, pyrimidine, amino, and keto skews for the CO genes among fishes, birds, and mammals. Further, we performed the correlation analysis to understand the effect of skewness on CUB. In all three genes, a highly significant correlation was found between codon usage bias and most of the nucleotide skews in fishes, birds, and mammals (Table 2), which suggested that compositional features giving rise to nucleotide skews might affect the CUB in these genes (Uddin & Chakraborty, 2015).
| Genes | Group | GC Skew | AT Skew | Purine skew | Pyrimidine skew | Keto skew | Amino skew | Hydrophilicity | Aromaticity | GRAVY |
|---|---|---|---|---|---|---|---|---|---|---|
| COI | Fishes | **0.319 | **−0.679 | **−0.756 | 0.087 | **−0.402 | −0.168 | −0.172 | −0.051 | **0.383 |
| Birds | **0.339 | **−0.848 | **−0.284 | **0.468 | −0.034 | **0.344 | **0.322 | **−0.331 | **−0.435 | |
| Mammals | 0.044 | −0.148 | **−0.717 | *−0.246 | **−0.522 | **−0.492 | 0.030 | −0.084 | −0.193 | |
| COII | Fishes | **0.399 | **−0.540 | **−0.668 | *0.251 | −0.145 | −0.164 | 0.050 | −0.166 | 0.089 |
| Birds | **0.535 | **−0.544 | **−0.492 | **0.375 | −0.037 | 0.003 | −0.032 | **0.280 | 0.114 | |
| Mammals | 0.157 | **−0.521 | **−0.717 | 0.009 | **−0.308 | **−0.323 | **−0.310 | 0.132 | **0.319 | |
| COIII | Fishes | **0.457 | **−0.306 | **−0.532 | **0.430 | *0.203 | **−0.313 | **0.376 | **−0.492 | −0.135 |
| Birds | **0.627 | **−0.867 | **−0.736 | **0.612 | **0.338 | **−0.417 | **0.389 | **−0.491 | **0.461 | |
| Mammals | **0.645 | **−0.307 | **−0.704 | **0.613 | **0.572 | **−0.604 | **0.456 | **−0.564 | 0.127 |
- Note. CO: cytochrome oxidase; GRAVY: grand average of hydropathy.
- **p < 0.01 and *p < 0.05.
3.9 Relationship between CUB and protein properties
Previous studies showed that the hydrophobicity and aromaticity of encoded proteins play a significant role in influencing CUB (Sablok, Nayak, Vazquez, & Tatarinova, 2011). In the COI gene, a highly significant correlation was found between ENC and GRAVY in fishes, whereas in birds, a highly significant correlation was found among (Table 2) ENC, GRAVY, aromaticity, and hydrophilicity of protein product. But in mammals, no significant correlation was observed between the CUB of the COI gene and protein properties. In the COII gene, a highly significant correlation was recorded between ENC and aromaticity in birds, whereas in mammals, a highly significant correlation was found among ENC, hydrophilicity, and GRAVY, but no significant correlation was observed in fishes. In the COIII genes, a highly significant correlation was found among ENC, hydrophilicity, and aromaticity for fishes and mammals, respectively, whereas in birds, a highly significant correlation was found among ENC, hydrophilicity, aromaticity, and GRAVY. These results suggested that variation in CUB of three CO genes was associated with the degree of aromaticity, hydrophilicity, and GRAVY values of encoded protein (Uddin & Chakraborty, 2016).
3.10 Amino acid composition of CO protein
The amino acid frequency of the encoded proteins in different species of fishes, birds, and mammals was estimated. In COI, COII, and COIII gene products, the frequency of Leu residue was the highest in most of the species of fishes, birds, and mammals, whereas the Cys residue was the least. The usage of amino acids, such as Gln, Arg, Lys, Glu, and Trp, was lower in COI protein, whereas in COII protein, the usages of Asp and Lys were lower. However, in COIII protein, the usage frequency of Arg, Asn, Lys, Cys, and Asp residues was lower in fishes, birds, and mammals (Figure 8).
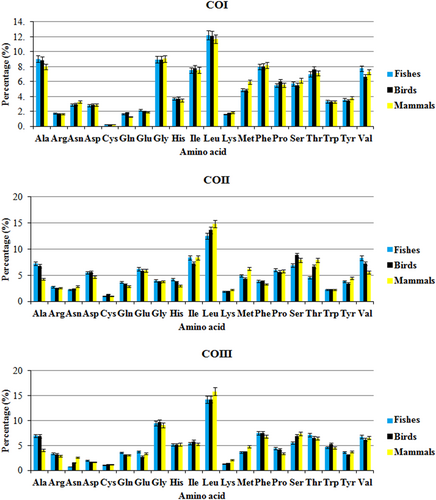
Amino acid usage of COI, COII, and COIII protein among fishes, birds, and mammals. CO: cytochrome oxidase [Color figure can be viewed at wileyonlinelibrary.com]
4 DISCUSSION
The study of codon bias received renewed attention from the scientific community due to the availability of whole genome sequences of different organisms in publicly accessible databases like NCBI (Hughes Martiny & Field, 2005). CUB is the nonrandom usage of synonymous codons wherein some codons for an amino acid are used more frequently than others in RNA transcripts. CUB may have significant roles in determining the gene product (Baba et al., 2006). It was reported that the frequencies of codons varied significantly in genes between different organisms, between proteins expressed at high or low levels within the same genome, and sometimes even within the same operon (Gustafsson et al., 2004). Factors that affect the CUB of genes include base compositional mutational bias (Jenkins & Holmes, 2003), gene expression (Gustafsson et al., 2004), gene length (Duret & Mouchiroud, 1999), and natural selection (Akashi, 1994).
The dysfunction/alteration of mitochondrial protein coding genes was reported to be involved in several diseases like cancer and neurodegenerative diseases like Alzheimer's and Parkinson's diseases (Burté et al., 2015). As the synonymous codon usage during translation is unequal, elucidating the codon usage pattern is essential for understanding the molecular biology and genetics of protein-coding genes of mitochondria involved in various diseases (Lewontin, 2002).
The present investigation comparatively highlights the codon usage patterns among fishes, birds, and mammals. The different species of fishes, birds, and mammals analyzed in this study acquire importance because their modes of respiration and energy consumption are different along with their habitats, that is aquatic, aerial, and terrestrial environments, respectively. CUB is an essential and complex evolutionary process, which exists in a wide variety of organisms, ranging from prokaryotes to eukaryotes (Behura & Severson, 2012).
The mean ENC value in the coding sequence of CO genes among different species of fishes, birds, and mammals was high, which suggested a weak codon bias for CO genes, probably thereby the genes maintained a stable level. A probable explanation for the low CUB is that it might be advantageous for efficient replication in each cell, with potentially distinct codon preferences (Jenkins & Holmes, 2003). Further, we found that the ENC values were higher in fishes than mammals and birds. Also, the ENC values significantly differed among fishes, birds, and mammals for the COI, COII, and COIII genes, which suggested the existence of higher genetic variability in terms of codon usage in fishes than mammals and birds for these genes. It is a well-accepted fact that high genetic variability provides the platform for evolution to continue in the desired direction for increased fitness, primarily by the evolutionary forces of mutation pressure and natural selection, which was more in fishes than mammals and birds.
Earlier investigations reported similar results of low codon bias among the mitochondrial genes, namely MT-ATP8 (54.1 ± 5.93) in mammals (Uddin & Chakraborty, 2014) and MT-ND2 gene in fishes, birds, and mammals (57 ± 2.91, 59 ± 0.44, and 55 ± 1.58 respectively) (Uddin, Mazumder, Choudhury, & Chakraborty, 2015). The same was also true in the case of the ENC value of albumin superfamily, which varied from 51.65 to 56.62. It was also reported that the ENC value of codon usage analysis of rabbit was 51.31 ± 5.71.
The composition of GC content has an essential role in CUB (Plotkin & Kudla, 2011). The GC content may affect the thermostability, bendability, and the ability to convert B-form of DNA to Z-form. It is also actively involved in transcription process because it can keep the coding region in an open chromatin state (D. H. Zhang et al., 2010). Previous studies reported that highly expressed genes might have low mutation rates because of DNA repair mechanisms (Bird, 2002). In our study, the GC content, in general, was lower than the AT content in mitochondrial CO genes, that is, the genes were AT-rich among fishes, birds, and mammals. We found that the GC content was high in birds followed by fishes and mammals. Further, we observed that the overall GC content was significantly different between fishes and birds, fishes and mammals, and birds and mammals. As the overall GC content significantly differed among fishes, birds, and mammals for the COI, COII, and COIII genes, it is suggested that the structure and the biological activity might also differ for each gene product among the three groups. Mirsafian et al. (2014) reported that the two albumin gene families ALB and AFP showed a similar nucleotide composition, suggesting that they might share similarities in their structure and biological function. Although AFM and VDBP were in the same albumin superfamily, they showed variation in their nucleotide composition, suggesting that their biological functions might differ in comparison to the other members of the albumin superfamily.
Most synonymous codons usually differ only at the third codon position. Therefore, GC3 (guanine and cytosine at the third position) is considered as a good indicator of the degree of synonymous CUB (Shen et al., 2015). Earlier studies revealed that genes with higher GC3 content appear to be easily methylated, which ultimately leads to mutation as compared with the genes with low GC3 content (Tatarinova, Alexandrov, Bouck, & Feldmann, 2010). Nucleotide composition could be one of the most important factors in influencing the CUB in genes as well as genomes (Jenkins & Holmes, 2003). Wei et al. (2014) and E. H. Wong et al. (2010) reported that the AT content was higher than the GC content in Bombyx mori, supporting our results. The genomes of Plasmodium falciparum (Peixoto, Fernndez, & Musto, 2004), Tetraphalerus bruchi, Trachypachus holmbergi, Sphaericus sp., Chaetosoma scaritides, Cyphon sp., and Priasilpha obscura (Sheffield, Song, Cameron, & Whiting, 2008) were found to be rich in AT nucleobases. The GC content was also reported to be the lowest in mitochondrial genomes of eight nemertean species, namely, Cephalothrix hongkongiensis, Cephalothrix sp., Lineus alborostratus, Lineus viridis, Zygeupolia rubens, Emplectonema gracile, Nectonemertes compare mirabilis, and Paranemertes compare peregrine (H. Chen et al., 2014). Earlier studies suggested that the distribution of the nucleobase C at the third codon position was the most frequent one followed by G, A, and T, respectively, that is the GC content was higher than the AT content in the nuclear genes of rabbit (Fadiel, Ganji, Farouk, and Marai, 2003).
A significant correlation was observed in some of the compositional constraints of CO genes among fishes, birds, and mammals, which indicated the effects of both mutation and natural selection in the codon usage of these genes. Besides, a significant correlation was also found between the ENC and GC contents at various codon positions, suggesting the influence of mutation pressure along with natural selection in shaping the codon usage of mitochondrial CO genes among fishes, birds, and mammals. Similar results were reported earlier in the case of mitochondrial DNA in B. mori (Wei et al., 2014) and ND2 gene for fishes, birds, and mammals (Duret, 2002).
Mutational biases are usually caused by nonuniform DNA repair, nonrandom replication errors, and chemical decay of nucleotides (Kaufmann & Paules, 1996). Mutational biases are neutral and do not affect the protein properties because they typically act on all DNA sequences of an organism. Several mutations arise from non-random mismatch repairs after replication errors and methylation. Such strand-specific mutational biases result from differential fidelities of replication of the leading and lagging strands. Asymmetric mutation rates of the leading and lagging strands were found in both bacteria (Lobry, 1996) and eukaryotes (Pavlov & Anrep GVe, 2003).
Furthermore, our study showed that the regression coefficient of GC12 on GC3 was less than 0.5, which indicated the major role of natural selection over mutation pressure in the codon usage patterns of these genes and a similar result was also observed in the codon bias of B. mori mitochondrial DNA (Wei et al., 2014), DNA and RNA virus genomes (Y. Chen, 2013).
We compared the CO genes of fishes, birds, and mammals with the mitochondrial genes of human and found that mitochondrial protein coding genes of human are AT-rich. The ENC values were high, that is, low CUB supporting our current study (Uddin & Chakraborty, 2016). Further, we compared the CO genes of fishes, birds, and mammals with nuclear encoded different variants of cytochrome 450 (CYP 450) gene of human and found that the overall GC content was 53.04% and the overall AT content was 46.96% i.e. nuclear encoded CYP 450 gene was GC-rich. The mean ENC value of CYP450 gene was 47.61, which suggested a low CUB similar to the mitochondrial CO genes in fishes, birds, and mammals (Malakar, Halder, Paul, & Chakraborty, 2016).
5 CONCLUSIONS
The mitochondrial protein coding genes are involved in different complexes of ETC, which provides energy currency to the cell and involves in respiration. Any mutation in the mitochondrial protein coding genes disrupts the physiological process of respiration and leads to various diseases. The study of compositional properties, codon usage pattern and elucidation of overrepresented and underrepresented codons of CO genes in fishes, birds, and mammals and its comparison with human gives novel insights into the molecular biology of the genes, a precursor study of genetic engineering for therapeutic intervention. In our current study, the CUB analysis revealed that different subunits of CO genes were significantly different in fishes, birds, and mammals. The compositional properties, like the overall GC content, also differed significantly among three groups. These results together suggest the biological functions of these genes might also differ and so might their mode of respiration. The fishes live in aquatic habitat and use gill as a respiratory organ, birds thrive in aerial habitat, possess pneumatic bone, and use lung as the respiratory organ; mammals thrive in terrestrial habitat and use lung as the respiratory organ, so the process of respiration differs among them, which could be attributed to the variation in the codon usage of the genes involved in ETC. Natural selection played a major role, whereas mutation pressure had a minor role in shaping the CUB in all the three genes, but the relative role of natural selection and mutation pressure varied among fishes, birds, and mammals for these genes.
CONFLICTS OF INTEREST
The authors have declared that they have no conflicts of interest.
ACKNOWLEDGMENT
We are thankful to Assam University, Silchar, Assam, India, for providing necessary lab facilities.


