Identification of a novel cell cycle-related gene signature predicting survival in patients with gastric cancer
Abstract
Gastric cancer (GC) is one of the most fatal cancers in the world. Thousands of biomarkers have been explored that might be related to survival and prognosis via database mining. However, the prediction effect of single gene biomarkers is not specific enough. Increasing evidence suggests that gene signatures are emerging as a possible better alternative. We aimed to develop a novel gene signature to improve the prognosis prediction of GC. Using the messenger RNA (mRNA)-mining approach, we performed mRNA expression profiling in a large GC cohort (n = 375) from The Cancer Genome Atlas (TCGA) database. Gene Set Enrichment Analysis (GSEA) was performed, and we recovered genes related to the G2/M checkpoint, which we identified with a Cox proportional regression model. We identified a set of five genes (MARCKS, CCNF, MAPK14, INCENP, and CHAF1A), which were significantly associated with overall survival (OS) in the test series. Based on this five-gene signature, the test series patients could be classified into high-risk or low-risk subgroups. Multivariate Cox regression analysis indicated that the prognostic power of this five-gene signature was independent of clinical features. In conclusion, we developed a five-gene signature related to the cell cycle that can predict survival for GC. Our findings provide novel insight that is useful for understanding cell cycle mechanisms and for identifying patients with GC with poor prognoses.
1 INTRODUCTION
Gastric cancer (GC) has a major impact on public health because of its high morbidity and mortality rates (Qinghai, Yanying, Yunfang, Xukui, & Xiaoqiao, 2014). The occurrence rate of GC is generally about twice as high in men as it is in women and varies widely across the world (Torre et al., 2015). There has been a steady increase in GC incidence and mortality in most countries, reaching approximately 8.52–9.68 cases per 100,000 individuals (Li et al., 2015; Tahara, Shibata, & Nakamura, 2010). Despite improvements in surgery, radiotherapy, and chemotherapy, the survival rates for GC are still poor, and some patients with GC, even those with the same TNM (Tumor Node Metastasis) stage, have different prognoses and treatment responses (Shiratsu, Higuchi, & Nakayama, 2014). An increasing amount of evidence demonstrates that the discovery and application of molecular biomarkers will improve the prognostic evaluation and identification of potential high-risk patients with GC.
Recently, many biomarkers have been developed for GC. For example, CEACAM6 (carcinoembryonic antigen-related adhesion molecule 6) is upregulated by the Helicobacter pylori CagA (cytotoxin-associated gene A) gene and is a biomarker for early GC (Subramanian et al., 2005). Furthermore, SETD2 indicates a favorable prognosis in GC, and it suppresses cancer cell proliferation, migration, and invasion (Chen et al., 2018b). With the surprising stability of miRNAs in tissues, serum or other bodily fluids, miRNAs also have emerged as a new type of cancer biomarker with immeasurable clinical potential (Wu, Lin, & Tsai, 2014). With the booming development of high-throughput sequencing, researchers have built many patient genome databases that help us to better understand genomic changes. Thousands of biomarkers have been explored via database mining that might be related to survival and prognosis (Liu, Miao, Liu, Wang, & Lu, 2018; Qixing et al., 2017). However, the predictive power of a single gene biomarker is insufficient. Researchers have found that gene signatures including several genes are emerging as a possible better alternative (Chen et al., 2018a; Cheng et al., 2016). Multigene prognostic signatures derived from primary tumor biopsies can guide clinicians in designing an appropriate course of the treatment. Identifying the genes and pathways most essential to a signature's performance may facilitate clinical application, provide insights into cancer progression, and uncover potential new therapeutic targets. However, there are still defects in the performance of the newly developed GC biomarkers. Therefore, finding a more efficient and sensitive GC biomarker is still an urgent problem to be solved.
In this study, we used Gene set enrichment analysis (GSEA) to identify some genes needing further analysis. In general, in studies for biomarker development, the difference analysis is often centered on comparing gene expression differences between two groups and focuses on a few genes, which are significantly up- or downregulated. This approach makes it too easy to omit genes which are not significantly different but that might have important biological significance, and it does not consider biological information, the relationship between gene regulatory networks, or other valuable information such as gene function and significance. GSEA does not require the specification of a clear differential gene threshold. The algorithm provides researchers with an overall trend of the actual data to enable the researchers to examine the overall expression of several genes even without prior experience; thus, this approach improves the connection between the mathematical statistics of the expression of the data and the biological meaning (Thomas, Yang, Carter, & Klaper, 2011). Moreover, there are only a few methods for finding GC biomarkers in this way.
In this study, we profiled hallmark gene sets in 375 patients with GC using the whole mRNA expression data set from the TCGA database. We identified 189 mRNAs significantly associated with the G2/M checkpoint and established a five-gene risk signature that can effectively predict patient outcomes. Surprisingly, the G2/M-related risk signature could independently identify high-risk patients with poor prognoses.
2 METHODS
2.1 Patient clinical information and mRNA expression data set
The mRNA expression profiles and clinical data set for patients with GC were extracted from the TCGA database (https://cancergenome.nih.gov/). A total of 375 patients with matching gender and age were enrolled in this study, and their clinical information was examined, including neoplasm cancer status, residual tumor, radiation therapy, new tumor events after the initial treatment, and metastatic diagnosis. The general clinical features are listed in Table 1.
| Clinical pathological parameters | N | % | Dead number |
|---|---|---|---|
| Tissue | |||
| Adjacent noncancerous tissue | 32 | 7.86 | |
| Stomach adenocarcinoma | 375 | 92.14 | |
| Age(years) | |||
| < = 67 | 187 | 50.4 | 30 |
| >67 | 184 | 49.6 | 45 |
| Gender | |||
| Male | 241 | 67.89 | 59 |
| Female | 114 | 32.11 | 16 |
| T classification | |||
| T1–T2 | 100 | 27.17 | 14 |
| T3–T4 | 268 | 72.83 | 61 |
| N classification | |||
| N0–N1 | 208 | 67.31 | 32 |
| N2–N3 | 101 | 32.69 | 41 |
| M classification | |||
| M0 | 330 | 92.96 | 59 |
| M1 | 25 | 7.04 | 12 |
| Family history of stomach cancer | |||
| No | 268 | 94.7 | 55 |
| Yes | 15 | 5.3 | 7 |
| Hpylori infection | |||
| No | 140 | 89.17 | 50 |
| Yes | 17 | 10.83 | 5 |
| Neoplasm histologic grade | |||
| G1 | 11 | 3.05 | |
| G2 | 129 | 35.73 | 28 |
| G3 | 221 | 61.22 | 44 |
| Residual tumor | |||
| No | 293 | 91% | 49 |
| Yes | 30 | 9% | 19 |
| Radiation therapy | |||
| No | 145 | 76.7% | 43 |
| Yes | 44 | 23.3% | 16 |
2.2 Gene set enrichment analysis
GSEA (http://www.broadinstitute.org/gsea/index.jsp) was performed to explore whether identified sets of genes showed significant differences between two groups (Cheng et al., 2015a; Subramanian et al., 2005). The expression levels of 24,991 mRNAs in adjacent noncancerous tissue and in GC samples were analyzed. Normalized p values (p < 0.05) were used to determine which functions to further investigate.
2.3 Statistical analysis
The expression profiles of 24,991 mRNAs were shown as raw data and each mRNA was normalized bylog2 transformation for further analysis. Univariate Cox regression analysis was used to identify genes clearly related to OS with p values of <0.05. Next, multivariate Cox proportional hazards regression analysis was used to further confirm the prognostic genes from the previous step. The filtered mRNAs were classified into risky (hazard ratio (HR) > 1) and protective (0 < HR < 1) types. Subsequently, a prognostic risk score formula was established based on a linear combination of the expression levels weighted with the regression coefficients derived from the multivariate Cox regression analysis. Risk score = expression of gene 1 x β1 + expression of gene 2 x β2 + ⋯ + expression of gene n x βn. We classified 375 patients into high-risk and low-risk subgroups using the median risk score as the cutoff. Kaplan–Meier curves and the log-rank method were used to validate the prognostic significance of the risk score. The Student's t test was performed to examine the differential expression of optimal genes in adjacent normal tissue and GC tissues. The selected genes’ alterations were shown in specific cancer types online (http://www.cbioportal.org/). All of the statistical analyses were performed with SPSS 16.0 and GraphPad Prism6 software.
3 RESULTS
3.1 Initial screening of genes using GSEA
Clinical features from a total of 375 patients with GC, along with an expression data set for 24,991 mRNAs, were obtained from the TCGA. The hallmark gene sets, each containing 50 specific gene sets, are coherently expressed signatures derived by aggregating multiple gene sets from the Molecular Signatures Database (MSigDB) to represent well-defined biological states or processes. GSEA was performed using the above mentioned data to explore whether the identified gene sets showed statistically significant differences between GC tissue and adjacent normal tissue. We found that 26 gene sets were upregulated in GC and that five gene sets, including the G2/M checkpoint, E2F targets, MYC targets V2, mitotic spindle, and MYC targets V1, were significantly enriched with normalized p values <5% among all of the 50 gene sets (Table 2, Figure 1). We then selected the top-ranking function, the G2/M checkpoint (p = 0.001),which contained 189 genes, for further analysis.
| GS follow link to MSigDB | SIZE | ES | NOM p-value | Rank at MAX |
|---|---|---|---|---|
| G2M CHECKPOINT | 189 | 0.75 | 0.001 | 2,379 |
| E2F TARGETS | 189 | 0.8 | 0.002 | 2,486 |
| MYC TARGETS V2 | 57 | 0.77 | 0.011 | 4,169 |
| MITOTIC SPINDLE | 197 | 0.51 | 0.026 | 4,635 |
| MYC TARGETS V1 | 192 | 0.64 | 0.048 | 5,431 |
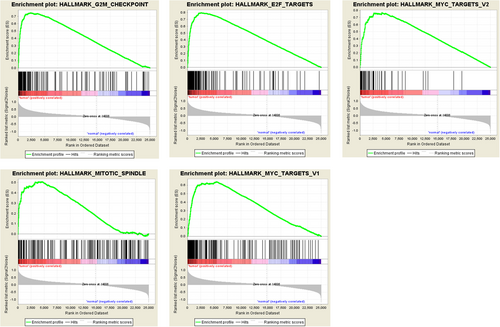
Enrichment plots of five gene sets which were significantly differentiated between in normal and gastric cancer tissues using GSEA. (Including (a) G2/M checkpoint; (b) E2F targets; (c) MYC targets V2; (d) mitotic spindle; (e) MYC targets V1) [Color figure can be viewed at wileyonlinelibrary.com]
3.2 Identification of G2/M checkpoint-related mRNAs associated with patient survival
First, we applied univariate Cox regression analysis to the 189 genes for preliminary screening and obtained 27 genes with p values <0.05. Next, multivariate Cox regression analysis was used to further examine the links between the expression profiles of 27 mRNAs and patient survival, and, subsequently, five mRNAs (MARCKS, INCENP, CHAF1A, CCNF, and MAPK14) were verified as independent GC prognostic indicators. The filtered mRNAs were classified into a risky type (MARCKS, CCNF, and MAPK14), whose HR was >1 with shorter survival, and a protective type (INCENP and CHAF1A), whose HR was <1 with longer survival (Table 3).
| mRNA | Ensemble ID | Location | Β (Cox) | HR (95%CIs) | p |
|---|---|---|---|---|---|
| MARCKS | ENST00000612661.1 | chr6:113,857,362–113,863,471 | 0.672 | 1.957 (1.37–2.795) | <0.001 |
| CCNF | ENST00000397066.8 | chr16:2,429,394–2,458,854 | 0.568 | 1.765 (1.197–2.601) | 0.004 |
| MAPK14 | ENST00000229795.7 | chr6:36,027,711–36,111,236 | 0.48 | 1.615 (1.133–2.303) | 0.008 |
| INCENP | ENST00000278849.4 | chr11:62,123,998–62,152,752 | −0.522 | 0.593 (0.401–0.877) | 0.009 |
| CHAF1A | ENST00000278849.4 | chr11:62,123,998–62,152,752 | −0.522 0.798 | 0.45 (0.302–0.6671) | <0.001 |
We then analyzed the alterations in the five selected genes by analyzing 375 clinical GC samples in the cBioPortal database. The result showed that the queried genes were altered in 80 (17%) of the sequenced cases. The CHAF1A gene included one example of amplification, 11 examples of deep deletion, 10 examples of missense mutations, and two examples of mRNA upregulation. The INCENP gene had a 5% change, including a mix of changes. The CCNF gene had a 3% changes, and the MARCKS and MAPK14 genes had 5% and 2.7% changes, respectively (Figure 2a).
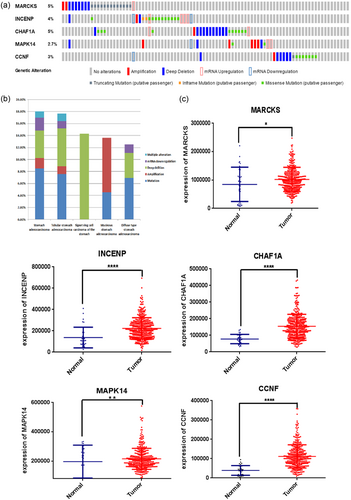
Identification of mRNAs associated with patients’ survival. (a) Selected genes’ alteration with the study of 375 clinical samples. (b) Selected genes’ specific alteration in five detailed cancer type including gastric cancer, signet ring cell carcinoma of the stomach, mucinous gastric cancer, etc. (c) Different expression of five selected genes. (* represents for p < 0.01, ** represent for p < 0.001, **** represent for p < 0.00001) [Color figure can be viewed at wileyonlinelibrary.com]
The specific alterations in the selected genes were also clear in specific cancer types. Among the patients with GC, 8.48% of the patients exhibited mutations, 1.77% had amplifications, 4.59% had deep deletions, 2.12% had mRNA downregulation, and 1.06% had multiple alterations. In signet ring cell carcinoma of the stomach, there was only one type of alteration: 14.29% of patients had deep deletion. In mucinous GC, the largest proportion of alterations was amplification (9.09%; Table 4, Figure 2b).
| Mutation | Amplification | Deep deletion | mRNA downregulation | Multiple alteration | |
|---|---|---|---|---|---|
| Stomach adenocarcinoma | 8.48% | 1.77% | 4.59% | 2.12% | 1.06% |
| Tubular stomach adenocarcinoma | 7.59% | 1.27% | 6.33% | 1.23% | 1.23% |
| Signet ring cell carcinoma of the stomach | 14.29% | ||||
| Mucinous stomach adenocarcinoma | 4.55% | 9.09% | |||
| Diffuse type stomach adenocarcinoma | 6.94% | 4.17% | 1.39% |
The differential expression of the five genes in adjacent normal tissue compared with GC tissue were also investigated. We found that the five genes were all upregulated in tumor tissues with significant differentiation (p < 0.05, Figure 2c).
3.3 Construction of a five-mRNA signature for predicting patients’ outcome
A prognostic risk score formula was established based on a linear combination of the expression levels weighted with the regression coefficients derived from the multivariate Cox regression analysis. Risk score = 0.672 x expression of MARCKS + 0.48 x expression of MAPK14 + 0.568 x expression of CCNF−0.522 x expression of INCENP−0.798 x expression of CHAF1A. Each patient with GC had only one risk score. We calculated the scores and ranked the patients in order of increased risk scores. We then sorted them into high- and low-risk groups using the median point (Figure 3a). The survival times (in days) of each patient are shown in Figure 3b, and the patients with high-risk scores had higher mortality rates than did the patients with low-risk scores. In addition, a heatmap (Figure 3c) is shown to display the expression profiles of the five mRNAs. As the risk score of the patients with GC increases, the expression of high-risk type mRNAs (MARCKS, CCNF, and MAPK14) were clearly upregulated; on the contrary, the expression of the protective type mRNAs (INCENP and CHAF1A) were downregulated.
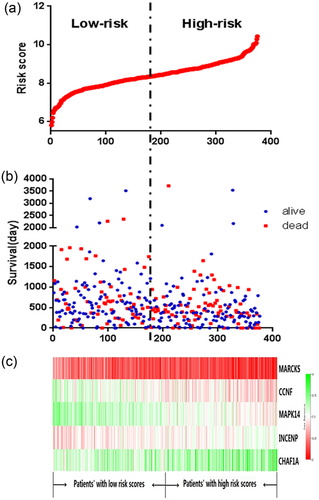
The five-mRNA signature related to risk score predicts overall survival in the patients with stomach adenocarcinoma. (a) mRNA risk score distribution in each patient. (b) Survival days of patients in order of the value of risk scores. (c) A heatmap of five selected genes’ expression profile [Color figure can be viewed at wileyonlinelibrary.com]
3.4 The risk score generated from the five-mRNA signature as an independent prognostic indicator
Using univariate and multivariate analysis, the prognostic value of the risk score was compared with the clinical pathological parameters (Table 5). We selected samples that had complete clinical data. The median age of the 375 patients with GC was 67 years old. Among 189 patients, 44 (23%) received radiation therapy. Among 322 patients, 77 (24%) had tumors during the follow-up. Among 329 patients, 31 (9%) had residual tumors. Among 62 patients, 2 (3%) suffered from new primary tumors, 43 (69%) had distant metastases and 17 (28%) had locoregional recurrences. Furthermore, 25 (7%) had metastatic disease among 355 patients with GC. From this data set, we found that the risk score, neoplasm cancer status, radiation therapy status, and residual tumor status were independent prognostic indicators, as they had significant differences not only in the univariate analysis, but also in the multivariate analysis, with p values <0.05. Importantly, the risk score had remarkable prognostic value, with p values < 0.001 (HR = 2.03, 95% CI (confidence interval) = 1.452–2.841). Furthermore, the “person neoplasm cancer status” was the most obvious clinical parameter to predict patient survival, as patients with tumors were 3.609 times more likely to die than those who were tumor free.
| Univariate analysis | Multivariate analysis | ||||||
|---|---|---|---|---|---|---|---|
| Clinical feature | Number | HR | 95% CI of HR | p value | HR | 95% CI of HR | p value |
| Risk score (high risk/low risk) | 188/187 | 2.03 | 1.452–2.841 | <0.001 | 2.873 | 1.615–5.111 | <0.001 |
| Age( > 67/ < = 67) | 184/187 | 1.484 | 1.068–2.062 | 0.019 | 1.514 | 0.847–2.706 | 0.162 |
| Neoplasm cancer status (with tumor/tumor free) | 77/245 | 3.609 | 2.511–55.186 | <0.001 | 4.748 | 1.471–15.3223 | 0.009 |
| Radiation therapy (yes/no) | 44/145 | 0.527 | 0.301–0.921 | 0.025 | 0.435 | 0.214–0.885 | 0.022 |
| Residual tumor (yes/no) | 31/298 | 3.433 | 2.153–5.476 | <0.001 | 2.657 | 1.273–5.548 | 0.009 |
| New tumor event after initial treatment (new primary tumor/distant metastasis/locoregional recurrence) | 2/43/17 | 2.459 | 1.555–3.887 | <0.001 | 0.681 | 0.223–2.083 | 0.5 |
| Metastatic diagnosis (yes/no) | 25/330 | 2.729 | 1.463–5.093 | 0.002 | 0.366 | 0.093–1.437 | 0.15 |
3.5 Validation of the five-mRNA signature for survival prediction by Kaplan–Meier curves
Kaplan–Meier curves and the log-rank method showed that patients with high-risk scores had poorer prognoses (p < 0.0001; Figure 4a). Univariate Cox regression analyses of the overall survival showed that several clinical pathological parameters could effectively predict the survival of GC, including age, radiation therapy, residual tumor, person neoplasm cancer status, new tumor event after the initial treatment, and metastatic diagnosis. The K–M method was then performed to verify the above conclusions and, subsequently, the results were self-consistent. According to the curves, patients who were older than 67 years, who had tumors during the follow-up, who received radiation therapy, who had residual tumors, who suffered from new tumor event after the initial treatment, and who had metastatic disease had poorer prognoses (Figure 4b). This observation further confirmed the accuracy of our analysis.
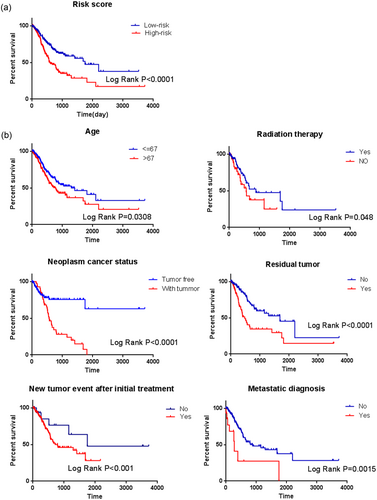
Kaplan–Meier survival analysis for the patients with stomach adenocarcinoma in TCGA data set. (a) The Kaplan–Meier curve for patients divided into high risk and low risk. (b) Different clinical features including age, radiation therapy, residual tumor, person neoplasm cancer status, new tumor event after the initial treatment, and metastatic diagnosis predict patients’ survival [Color figure can be viewed at wileyonlinelibrary.com]
Next, stratified analysis was performed for further data mining. As shown by the K–M curves, independent of gender (female or male) and age ( > 67 or < = 67), the five-mRNA signature was a stable prognostic marker for patients with GC in that high-risk group patients had poorer prognoses (Figure 5a,b). However, when the patients were stratified into different subgroups based on family history, the risk score based on the five-mRNA signature remained an independent prognostic indicator for the subgroup of no family history (Figure 5c), implying that GC may be a disease that requires further explanation. By the same token, when patients were tumor free during the follow-up and when they were not infected by H. pylori and had no residual tumors, we could use the risk score to predict patient outcomes, and the patients in the high-risk subgroup had shorter survival (Figure 5d–f).
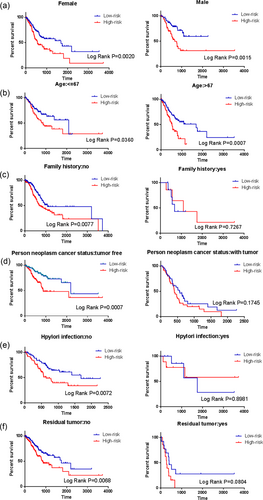
Kaplan–Meier curves for prognostic value of risk score signature for the patients divided by each clinical features. (a) Gender; (b) Age; (c) Family history; (d) Person neoplasm cancer status; (e) Hpylori infection; (f) Residual tumor [Color figure can be viewed at wileyonlinelibrary.com]
4 DISCUSSION
Recent studies demonstrated that clinicopathological features such as age, sex, tumor death, margin status, and metastatic diagnosis are insufficient to accurately predict patient prognosis.Therefore, more and more mRNAs might be useful as molecular markers of the cancer development and prognosis, indicating their important clinical significance should be explored (Guo, Chen, Zhu, & Wang, 2017). For example, Han et al. confirmed that the MAGE family member A9 had significantly higher expression in laryngeal squamous cell carcinoma and could be used as an independent prognostic factor in patients with laryngeal squamous cell cancer (Han, Jiang, Wu, Zhang, & Lu, 2014). Lou et al. used a Cox proportional hazards regression analysis to demonstrate that liver cancer patients with the highest expression of SRY-box 1 (SOX-1) had better prognoses and that the SOX-1 status could be used as a prognostic factor in patients with liver cancer (Lou et al., 2015). However, these markers are still insufficient to independently predict patient survival. In particular, since the expression of a single gene can be regulated by various factors, it is difficult for this information to provide a powerful predictive effect. Therefore, here we used a statistical model to construct a gene signature that included several related genes, combining the predictive effects of each constituent gene to improve prediction efficiency. This model is widely used and is superior to single biomarkers in predicting disease prognosis (Bao et al., 2014; Cheng et al., 2015b; Niyazi et al., 2016).
With the development of high-throughput gene detection technologies, we are entering a new era of big biological data (Peng et al., 2017). A tremendous amount of genomic information has been collected from individual samples, which allows the identification of novel diagnostic, prognostic, predictive, or pharmacodynamic biomarkers (Subramanian & Simon, 2010). Currently, microarray or RNA-sequencing data of genetic mutations and gene expression levels were usually used to construct novel prognostic signatures using a Cox proportional hazards regression model (Shen et al., 2017; Zhao et al., 2018). In the current study, we attempted to apply GSEA using expression data for 24,991 mRNAs from 375 patients with GC, and we found that five functions had significant differences with p values < 0.05.The function that had the lowest p value was selected for further analysis. As described above, we focused on a specific function to select genes using GSEA to predict patient survival instead of exploring a wide range of genes. Univariate Cox regression and multivariate Cox regression analyses were performed to identify a combination of five genes with prognostic value for patients with GC, rather that only a single gene. Compared with some known prognostic biomarkers, this selected risk signature may have a targeted and more powerful prognostic ability to support positive clinical outcomes and to be an effective classification tool of patients with GC. Furthermore, bioinformatic methods were used throughout in this study to explore the mRNA risk signature and its clinical significance, representing a more novel method to mine potential prognostic markers, not only to complement our understanding of GC in the past, but to also lay the foundation for future research. We collected G2/M checkpoint-related genes using the data set of GC in the TCGA and compared the data from tumor tissue with that from adjacent noncancerous tissue samples. Kaplan–Meier curve analysis showed that patients with high-risk scores were associated with poor prognosis. This observation suggested that calculating the risk scores of patients with GC had important clinical significance. When we conducted stratified analysis, the risk score could not predict patient outcomes in some situations, for example, in patients who were not infected with H. pylori. The reasons for this discrepancy are not known, and it should be explored in depth later.
The cell cycle refers to cells from the beginning of a division to the end of the division, and it is divided into two stages: interphase and division stage. Cell cycle checkpoints are a mechanism of cell cycle regulation whose main function is to ensure that the events of each cycle run orderly and are fully completed, and they are associated with environmental factors. Cells rely on the G1 and G2 cell cycle checkpoints to maintain their genomic integrity (Ouyang et al., 2009). Most cancer cells are defective in the G1 checkpoint, commonly due to mutations or other alterations of key regulators of the G1 checkpoint (Kastan, Onyekwere, Sidransky, Vogelstein, & Craig, 1991). Two types of G2 checkpoint responses have been previously identified: the DNA damage G2 checkpoint and the decatenation G2 checkpoint (Deming et al., 2001; Downes et al., 1994; Nurse & Bissett, 1981). The DNA damage G2 checkpoint delays the initiation of mitosis after DNA damage by sequestering inactive cyclin B1/cdk1 in the cytoplasm, thus preventing entry into mitosis (Morgan, 1995; Nigg, 1995). The decatenation G2 checkpoint is molecularly distinct from the DNA damage G2 checkpoint in that it is activated in response to catalytic inhibition of topoisomerase IIα (topo IIα) without overt DNA damage (Downes et al., 1994; Luo, Yuan, Chen, & Lou, 2009; Skoufias, Lacroix, Andreassen, Wilson, & Margolis, 2004). Major players in both the DNA damage and decatenation G2 checkpoints include the ATM/Chk2/p53 pathway, and attenuation of either G2 checkpoint leads to chromosomal instability (Xu, Kim, & Kastan, 2001). In addition, disorders in the mechanisms of cell cycle monitoring and proliferation are the root causes of uncontrolled tumor cell growth, tumor cell-specific phenomena, and indeed, deadly blows to normal cells. Cell cycle checkpoints ensure ordered progression of the cell cycle; the checkpoints are critical for maintaining genomic stability, they act as barriers to carcinogenesis, and they are often deregulated in tumors (Bower et al., 2010; Hartwell & Kastan, 1994, Taylor & McKeon, 1997). Currently, several studies have been reported for predicting patient with GC survival related to the cell cycle. For example, CCND1 (cyclin D1) overexpression is associated with shorter survival in patients with GC and with poorly differentiated tumors (Shan et al., 2017). However, no cell cycle-related gene signatures have been established for the prediction of GC prognosis. For the first time, we reported the gene signature identified using bioinformatics methods, which is related to the G2/M checkpoint (MARCKS, CCNF, MAPK14, INCENP, and CHAF1A) and which displays prognostic value for GC.
In summary, we first identified and validated a five-gene risk signature related to cell cycle control (G2/M checkpoint) that can predict the survival of patients with GC, where higher risk scores indicate poorer patient prognosis. This signature could be a useful classification tool in clinical practice. Continued exploration of these genes will provide theoretical guidance for basic research and for the clinical treatment of GC.
ACKNOWLEDGMENTS
This study was supported by the National Natural Science Foundation of China and the Liaoning joint fund key program (No. U1608281), the Program for Liaoning Excellent Talents in University (No. LJQ2015118), the Shenyang S&T Projects (17–123-9-00, Z18-4-020), the Key Laboratory Foundation from Shenyang S&T Projects (F16–094-1-00), and the Key Laboratory Foundation from Liaoning Province (No. LS201617).
CONFLICTS OF INTEREST
Authors declare that they have no conflicts of interest.


