Upregulation of lncRNA DGCR5 correlates with better prognosis and inhibits bladder cancer progression via transcriptionally facilitating P21 expression
Abstract
Mounting studies show that long noncoding RNAs (lncRNAs) could affect human cancer progression, including bladder cancer (BCa). LncRNA DiGeorge syndrome critical region gene 5 (DGCR5) has been proven to be involved in lung cancer, pancreatic ductal adenocarcinoma, and hepatocellular carcinoma. However, the function of DGCR5 in BCa remains largely unknown. Here, we found that DGCR5 expression was significantly downregulated in BCa tissues compared with adjacent normal tissues. Higher expression of DGCR5 predicted higher survival rate in BCa patients. Functional experiments indicated that DGCR5 overexpression markedly inhibited that proliferation, colony formation, and cell-cycle progression in BCa cells. Furthermore, ectopic expression of DGCR5 led to decreased BCa cell migration, invasion, and epithelial–mesenchymal transition while promoting apoptosis. In vivo xenograft assay also illustrated that DGCR5 overexpression inhibited BCa growth. In the mechanism, we found that DGCR5 interacted with AT-rich interaction domain 1A (ARID1A), a chromatin remodeling protein, to promote P21 transcription. Knockdown of P21 could significantly rescue the suppressed proliferation, migration, and invasion of BCa cells by DGCR5 overexpression. In summary, our study demonstrated that DGCR5 transcriptionally promotes P21 expression to suppress BCa progression.
1 INTRODUCTION
Bladder cancer is a common urological tumor, which poses a serious threat to the patient's life. According to previous studies, populations in Europe, North America, West Asia, and North Africa have the highest incidence of bladder cancer (Chen et al., 2012). Bladder cancer is one of the major male malignant tumors, and the 5-year survival rate is very low (Cheng, Fu, Xu, & Zhang, 2018). Similar to other cancers, radiotherapy, surgery, and chemotherapy are the standard methods used for the treatment of bladder cancer, but the effect is not satisfactory. Therefore, revealing the molecular mechanism of the occurrence and the development of bladder cancer is very important for the radical treatment of bladder cancer.
Long noncoding RNA (lncRNA) is a type of noncoding single-stranded RNA with a transcript of more than 200 nucleotides (Zhu, Wang, Huang, et al., 2016). LncRNA plays a very important role in various biological regulation processes. It participates in a series of biological processes, including DNA damage, angiogenesis, microRNA silencing, invasion, metastasis, and programmed cell death (Yang et al., 2016). In addition, lncRNA can also regulate embryonic development, immune cell development, and tumorigenesis (Liu et al., 2017; Ye et al., 2018; Zhu, Wang, Wu, et al., 2016). Current studies have found that lncRNA are involved in a variety of cancers (S. H. Wang et al., 2016). Many lncRNAs have been reported to play an irreplaceable role in the occurrence and development of bladder cancer. Martínez-Fernández et al. (2015) reported that, as one of the lncRNA, HOTAIR could be served as a candidate for the diagnosis of bladder cancer, which exerted an active role in regulating the progression, recurrence, and survival of bladder cancer. Xue et al. (2015) found through microarray screening that the expression of MDC1-AS as well as MDC1 had significantly declined in bladder cancer. They also realized that MDC1 expression level was increased with the upregulation of MDC1-AS. Cao et al. (2017) revealed that the expression level of ABHD11-AS1 was higher in bladder cancer tissues than in the adjacent normal tissues. ABHD11-AS1 promoted bladder cancer cell proliferation and suppressed their apoptosis.
As one of the lncRNA, DiGeorge syndrome critical region gene 5 (DGCR5) was also found to participate in the development and progression of multiple cancers, such as lung cancer and hepatocellular carcinoma (Hu et al., 2017; Huang et al., 2016). However, studies on DGCR5 in bladder cancer have not emerged yet. Based on previous research, we speculated that DGCR5 also played an important regulatory role in the development of bladder cancer. Therefore, this study has conducted an in-depth research on the above speculation to provide an important potential target for clinical treatment of bladder cancer.
2 MATERIALS AND METHODS
2.1 Patients and tissue samples
From June 2010 to October 2012, patients undergoing surgery for bladder urothelial carcinoma in our hospital were included in the study. Patients who met the following criteria were included in the study: patients diagnosed with bladder cancer for the first time, patients without a history of radiation or chemotherapy, and patients voluntarily participated in this study. Exclusion criteria were as follows: patients with other serious organic diseases, pregnancy and lactation in women, patients with mental or neurological diseases, and patients who did not want to join this study. All patients were treated after surgery, as appropriately. Finally, 61 patients were enrolled in this study, including 34 men and 27 women. The average age was 58 ± 7.4 years. Patients’ tumor tissues and adjacent normal tissues were collected and stored. All patients were followed up for 60 months and their overall survival was analyzed by Kaplan–Meier curve analysis.
All patients who participated in the study have signed informed consent. This study has been approved by our hospital's ethics committee.
2.2 Cell culture
Human bladder epithelial immortalized cell line SV-HUC-1 and bladder cancer cell lines (T24, 5637, SW780, RT4, and UM-UC-3) were purchased from Shanghai Institute Chinese Academy of Science (Shanghai, China). All cells were maintained in Dulbecco's modified Eagle's medium (DMEM) containing 10% fetal bovine serum (FBS) in an incubator at 37°C, 5% CO2.
2.3 Cell transfection
pcDNA3.1-DGCR5 overexpression vector, pcDNA3.1-DGCR5 negative expression (NC) vector, and pcDNA3.1-ARID1A overexpression vector were purchased from Shanghai Jema Pharmaceutical Technology Co., Ltd. (Shanghai, China). T24 and SW780 cells were collected at logarithmic growth phase and prepared as cell suspension (1 × 10⁵ cells/ml) by using DMEM (without FBS). They were inoculated in six-well plates, respectively, with 1 ml cell suspension/well. After incubated for 12 hr, cells were subjected to transfection by pcDNA3.1-DGCR5 overexpression vector (oe-DGCR5 group) or pcDNA3.1-DGCR5 NC vector (oe-NC group) using Lipofectamine 2000 (Invitrogen; Thermo Fisher Scientific, Inc., Waltham, MA) strictly in accordance with the manufacturers instructions. Meanwhile, T24 and SW780 cells were also transfected using DGCR5 small interfering RNA (siRNA) negative control (si-NC group), DGCR5 siRNA (si-DGCR5 group), and ARID1A siRNA (si-ARID1A group), respectively. In addition, cotransfection was also performed on T24 and SW780 cells by DGCR5 siRNA and pcDNA3.1-ARID1A overexpression vector (si-DGCR5 + oe-ARID1A group), or by ARID1A siRNA and pcDNA3.1-DGCR5 overexpression vector (si-ARID1A + oe-DGCR5 group), or by pcDNA3.1-DGCR5 overexpression vector and P21 siRNA (oe-DGCR5 + si-P21 group). The residual medium in each well was replaced by DMEM (10% FBS) after 6 hr of transfection. Cells were returned to the incubator for continued culture at 37°C, 5% CO2.
2.4 Cell counting kit-8 (CCK-8) assay
T24 and SW780 cells were seeded in 96-well plates with 200 μl cell suspension/well (1 × 10⁴ cells/ml). CCK-8 (Dojindo, Kumamoto, Japan) assay was selected for cell proliferation detection at 24, 48, 72, and 96 hr. Absorbance values of each well at 450 nm wavelength (OD450 value) were detected.
2.5 Colony formation assay
T24 and SW780 cells were inoculated in six-well plates with 200 cells/well. A total of 1 ml DMEM (10% FBS) was added into each well. The residual medium in each well was replaced by fresh DMEM (10% FBS) in every 2 days. Cells were cultured in the incubator with 5% CO2, 37°C. After 2 weeks, cells were fixed with methanol and stained with 5% crystal violet. Colonies with >50 cells were counted under a microscope.
2.6 Cell cycle detection by flow cytometry
T24 and SW780 cells were seeded in Petri dishes (diameter = 6 cm) with 5 × 10⁵ cells/Petri dish. Totally 5 ml DMEM (10% FBS) was added into each Petri dish. After 12 hr of incubation, the residual liquid in Petri dishes was replaced with DMEM (without FBS) for 24-hr starvation, followed by 48 hr of incubation in DMEM (10% FBS). Then, these cells were collected and fixed for 12 hr at 4°C by prechilled 70% ethanol. At last, propidium iodide (PI) staining was performed, and flow cytometry was carried out to detect the cell cycle.
2.7 Transwell assay
T24 and SW780 cells were digested and dispersed in a serum-free DMEM with a density of 1 × 10³ cells/ml. Cells migration and invasion abilities were detected by Transwell assay. Briefly, 1 ml cell suspension was inoculated in six-well Transwell chambers with a polycarbonate membrane (pore size = 8.0 μm). A total of 1 ml DMEM (10% FBS) was also added to the bottom of each well. Incubation for 24 hr at 37°C, 5% CO2, was necessary. Then, the cells on the upper chamber were gently wiped off, while those passed through the membrane were fixed by formaldehyde and stained with 5% crystal violet. Cells penetrating the membrane were considered as migrating cells, which were counted under an inverted microscope.
Matrigel (BD Biosciences, Franklin Lakes, NJ) was precoated uniformly on the polycarbonate membrane for cell invasive ability testing. The other operations were same as the cell migration ability detection.
2.8 Flow cytometry detection of apoptosis
T24 and SW780 cells were collected and incubated for 20 min by Annexin V–FITC (BD Biosciences, San Jose, CA) at room temperature in dark. Then, 5-min incubation under the same conditions was performed by adding PI. Fluorescence-activated cell sorting was used to examine cell apoptosis.
2.9 RNA distribution assay
Cytosolic and nuclear fractions of T24 and SW780 cells were collected, respectively, using Cytoplasmic and Nuclear RNA Purification Kit (Shanghai Pumai Biotechnology Co., Ltd., Shanghai, China). The operation was strictly in accordance with the manufacturer's instructions. The distribution of DGCR5 in nucleus and cytoplasm was detected through quantitative real-time polymerase chain reaction (qRT-PCR) technology. In this study, U6 was selected as the reference for DGCR5 expression in the nucleus, while glyceraldehyde 3-phosphate dehydrogenase (GAPDH) was used as the reference for DGCR5 expression in the cytoplasm.
2.10 RNA immunoprecipitation (RIP) assay
T24 and SW780 cells were harvested and lysed with cell lysis buffer (containing protease inhibitors) for 30 min. The cell lysate was centrifuged at 4°C for 30 min at maximum speed to obtain the supernatant. AT-rich interaction domain 1A (ARID1A) monoclonal antibody or normal mouse immunoglobulin G (IgG) was added to the lysis buffer, respectively, for 12-hr incubation at 4°C. A total of 10 μl protein A agarose beads were washed three times with lysis buffer by centrifugation at 3,000 rpm for 3 min each time. Then, protein A agarose beads were also added into the lysis buffer for 2–4-hr incubation at 4°C. The lysis buffer was subjected to centrifugation at 3,000 rpm for 3 min at 4°C. After the supernatant was removed, the agarose beads at the bottom of the centrifuge tube were washed 3–4 times with 1 ml of lysis buffer. At last, 5× sodium dodecyl sulfate (SDS) was added into the agarose beads and boiled for 5 min. The supernatant was collected after centrifugation. The DGCR5 level in the supernatant was investigated using qRT-PCR.
2.11 RNA pulldown assay
Biotin-labeled DGCR5 plasmids were constructed to transfect T24 and SW780 cells. RNA pulldown assay was performed using Pierce Magnetic RNA-Protein Pull-Down Kit (Thermo Fisher Scientific, Waltham, MA). Proteins in cells were collected and were reacted with biotin-labeled RNA. At last, proteins were detected using western blot analysis.
2.12 Chromatin immunoprecipitation (ChIP) assay
ChIP assay was conducted using ChIP Kit (Thermo Fisher Scientific) in strict accordance with the manufacturer's instructions. Formaldehyde was selected to fix cells, followed by separation of chromatin DNA. Chromatin DNA was sonicated into 300~500 bp fragments. IgG or anti-ARID1A were used in this study. Immunoprecipitated product fragments and control fragments were amplified using qRT-PCR technology. The Ct value was calculated.
2.13 Nude mice xenograft experiment
A total of 50 nude mice without significant difference in body weight were purchased from Beijing Chinese Academy of Sciences Laboratory Animal Center (Beijing, China). T24 cells of oe-NC group and oe-DGCR5 group were prepared as cell suspension at a density of 1 × 10⁵ cells/ml. Five nude mice were randomly selected and injected subcutaneously with cell suspension of oe-NC group. Another five nude mice were subcutaneous injected with cell suspension of oe-DGCR5 group. Each nude mouse was injected with 1 ml of cell suspension. Subcutaneous tumor volume of each nude mouse was measured once in a week. All nude mice were killed at Week 4 to obtain subcutaneous tumor tissues. The weight of these tumor tissues were detected. The expression levels of DGCR5 and P21 in tumor tissues were measured using qRT-PCR.
All animal experiments have been approved by our hospital's ethics committee.
2.14 qRT-PCR
Total RNAs from tissues or cultured cells were isolated using TRIzol (Thermo Fisher Scientific) according to the manufacturer's instructions. The complementary DNA template was obtained through reverse-transcription polymerase chain reaction system (Takara Bio Inc. Tokyo, Japan). qRT-PCR was carried out under the following three step conditions: degeneration at 95°C for 10 s, reannealing at 60°C for 20 s, and extension at 72°C for 34 s. This process was cycled 40 times. The primer sequences involved in this study were as follows: DGCR5, forward: 5′-CACGAGTGTAGTGCCCAGTT-3′, reverse: 5′-GGTCAGGGACCTTTGTCTGG-3′; P21, forward: 5′-GTCAGAACCGGCTGGGGATG-3′, reverse: 5′-CTCCTCCCAACTCATCCCGG-3′; and GAPDH, forward: 5′-GGAGCGAGATCCCTCCAAAAT-3′, reverse: 5′-GGCTGTTGTCATACTTCTCATGG-3′. GAPDH served as a internal reference.
2.15 Western blot analysis
Total proteins of cells and tissues were obtained using RIPA lysis buffer, followed by separating with 10% sodium dodecyl sulfate polyacrylamide gel electrophoresis (SDS-PAGE). Proteins were then transferred onto a polyvinylidene difluoride membrane for blocking using 5% of skimmed milk, followed by incubation with primary antibodies (mouse anti-rabbit primary antibodies; 1:1000; Proteintech, Chicago, IL) for 12 hr at 4°C. Horseradish peroxidase-labeled secondary antibodies was added for 2-hr incubation at room temperature. The blots were visualized using Odyssey Infrared Imaging System (LI-COR Biosciences, Lincoln, NE).
2.16 Statistical analysis
All data were processed by SPSS 19.0 (IBM Corp., Armonk, NY) and was expressed as mean ± SD. The comparison between the two groups was performed using t test. The comparison among multiple groups was analyzed by one-way analysis of variance. p < 0.05 was considered statistically significant. All experiments in this study were repeated three times to ensure accuracy.
3 RESULTS
3.1 DGCR5 was downregulated in bladder cancer tissues, cell lines, and correlated with adverse prognosis
DGCR5 relative expression in tumor tissues was significantly lower than that in normal tissues (p < 0.001; Figure 1a). Meanwhile, compared with SV-HUC-1 cells, a significantly decreased DGCR5 relative expression was found in bladder cancer cell lines (T24, 5637, SW780, RT4, and UM-UC-3; p < 0.05 or <0.01 or <0.001; Figure 1b). T24 and SW780 cells showed much lower DGCR5 relative expression than the other bladder cancer cell lines. Therefore, T24 and SW780 cells were selected for subsequent research.

DGCR5 was downregulated in bladder cancer tissues, cells, and correlated with adverse prognosis. (a) DGCR5 relative expression in bladder cancer tissues and adjacent normal tissues was assessed by qRT-PCR. ***p < 0.001 when compared with DGCR5 relative expression in normal tissues. (b) DGCR5 relative expression in human bladder epithelial immortalized cell line SV-HUC-1 and bladder cancer cell lines (T24, 5637, SW780, RT4, and UM-UC-3) was analyzed by qRT-PCR. *p < 0.05, **p < 0.01, and ***p < 0.001 when compared with DGCR5 relative expression in SV-HUC-1 cells. (c) Patients overall survival was analyzed by Kaplan–Meier curve analysis. DGCR5: DiGeorge syndrome critical region gene 5; qRT-PCR: quantitative real-time polymerase chain reaction [Color figure can be viewed at wileyonlinelibrary.com]
In addition, patients were further divided into high-DGCR5-expression group (n = 31) and low-DGCR5-expression group (n = 30) according to DGCR5 expression in their tumor tissues. Kaplan–Meier curve analysis revealed that the overall survival of patients with low DGCR5 expression was much lower than the patients with high DGCR5 expression (p < 0.05; Figure 1c). Low DGCR5 expression predicted more serious adverse prognosis in bladder cancer patients.
3.2 Overexpression of DGCR5 inhibited bladder cancer cell proliferation and cell-cycle progression
As shown in Figure 2a, DGCR5 relative expression in T24 and SW780 cells of oe-DGCR5 group was significantly higher than that of oe-NC group (p < 0.001). When compared with oe-NC group, DGCR5 overexpression obviously inhibited T24 and SW780 cell proliferations at 48, 72, and 96 hr (p < 0.05 or <0.001; Figure 2b). Colony formation assay showed markedly decreased colony number of T24 and SW780 cells in oe-DGCR5 group when compared with the oe-NC group (p < 0.01; Figure 2c). Meanwhile, the overexpression of DGCR5 significantly increased the percentage of T24 and SW780 cells in G0 phase and significantly reduced the percentage of T24 and SW780 cells in S and G2 phases (p < 0.01; Figure 2d). Western blot results showed upregulated P21 and downregulated cyclin D1 in T24 and SW780 cells of oe-DGCR5 group than that of oe-NC group (Figure 2e).
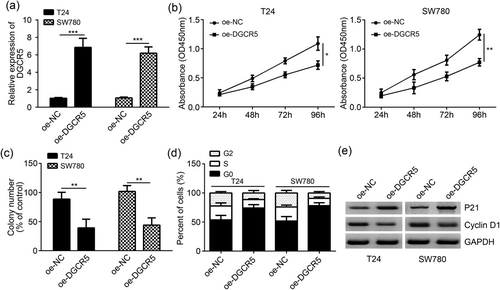
Overexpression of DGCR5 inhibited bladder cancer cell proliferation and cell-cycle progression. (a) DGCR5 expression was markedly upregulated after transfection with pcDNA3.1-DGCR5 vector in T24 and SW780 cells. (b,c) CCK-8 and colony formation experiments showed that DGCR5 overexpression inhibited the proliferation and colony formation in T24 and SW780 cells. (d) DGCR5 overexpression arrested the cell-cycle progression in T24 and SW780 cells. (e) The protein levels of P21 and cyclin D1 were measured by western blot analysis in T24 and SW780 cells. *p < 0.05 or **p < 0.01 or ***p < 0.001 when compared with oe-NC group. CCK-8: cell counting kit-8; DGCR5: DiGeorge syndrome critical region gene 5; GAPDH: glyceraldehyde 3-phosphate dehydrogenase; NC: negative control; OD: optical density
3.3 Overexpression of DGCR5 suppressed bladder cancer cell migration, invasion, and epithelial–mesenchymal transition (EMT) while promoted their apoptosis
Compared with oe-NC group, the number of migrated and invaded T24 and SW780 cells in oe-DGCR5 group were remarkably lower (p < 0.05 or <0.01; Figure 3a,b). Furthermore, we also observed significantly decreased N-cadherin and significantly increased E-cadherin expression in T24 and SW780 cells in oe-DGCR5 group when compared with oe-NC group (Figure 3c), indicating DGCR5 impeded the EMT. However, the percentage of apoptotic T24 and SW780 cells of oe-DGCR5 group was significantly higher than that of oe-NC group (p < 0.01; Figure 3d).
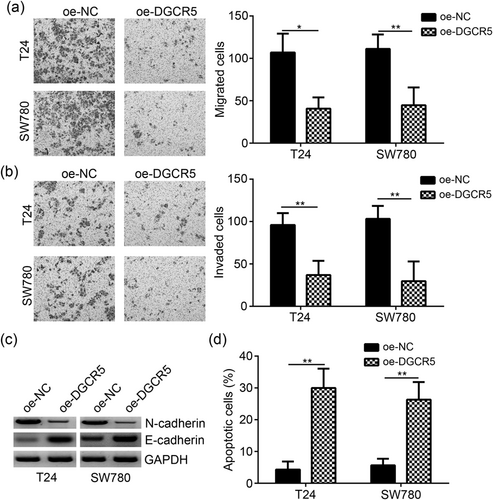
Overexpression of DGCR5 suppressed bladder cancer cells migration, invasion, and EMT, while promoted their apoptosis. (a,b) Transwell assay showed that DGCR5 overexpression led to reduced cell numbers of migration and invasion. (c) The protein levels of N-cadherin and E-cadherin were determined by western blot analysis. (d) Cell apoptosis was examined by FACS in T24 and SW780 cells transfected with pcDNA3.1-DGCR5 or empty vector control. *p < 0.05 or **p < 0.01 when compared with oe-NC group. DGCR5: DiGeorge syndrome critical region gene 5; GAPDH: glyceraldehyde 3-phosphate dehydrogenase; EMT: epithelial–mesenchymal transition; FACS: fluorescence-activated cell sorting; NC: negative control
3.4 DGCR5 transcriptionally promoted P21 expression by recruiting ARID1A
We examined the distribution of DGCR5 in the nucleus and cytoplasm. The results showed that in T24 and SW780 cells, DGCR5 was mainly expressed in the nucleus (Figure 4a,b). RIP assay revealed that DGCR5 was significantly precipitated by anti-ARID1A in T24 and SW780 cells (p < 0.001; Figure 4c). RNA pulldown assay further confirmed that biotin-labeled DGCR5 could markedly precipitate ARID1A in T24 and SW780 cells (Figure 4d). According to the results of the ChIP assay, ARID1A was significantly enriched on the promoter of P21 in T24 and SW780 cells (p < 0.001; Figure 4e). Furthermore, after DGCR5 was silenced, the enrichment of ARID1A on the promoter of P21 in T24 and SW780 cells was significantly impaired (p < 0.001; Figure 4f). qRT-PCR analysis indicated that compared with T24 and SW780 cells in si-NC group, P21 mRNA relative expression in si-DGCR5 group, si-ARID1A group, and si-ARID1A + oe-DGCR5 group was all markedly decreased (p < 0.05 or <0.01; Figure 4g). Compared with si-DGCR5 group, si-ARID1A group, si-DGCR5 + oe-ARID1A group, and si-ARID1A + oe-DGCR5 group, T24 and SW780 cells of si-DGCR5 + oe-ARID1A group were with much high P21 mRNA relative expression (p < 0.05; Figure 4g), indicating that DGCR5 is necessary for ARID1A-mediated P21 expression.
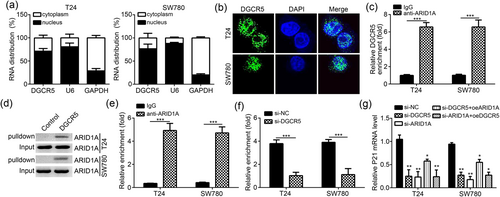
DGCR5 transcriptionally promoted P21 expression by recruiting ARID1A. (a) The location of DGCR5 in nucleus and cytoplasm of bladder cancer cells was analyzed. U6 was used as nuclear control, and GAPDH was served as cytoplasmic control. (b) RNA-FISH indicated that DGCR5 was mainly located in the nucleus of bladder cancer cells. (c) RIP assay showed that anti-ARID1A precipitated DGCR5 in bladder cancer cell lysates. (d) RNA pulldown assay showed that biotin-labeled DGCR5 precipitated ARID1A in bladder cancer cell lysates. (e) ChIP assay indicated that ARID1A was enriched on the promoter of P21 in bladder cancer cells. (f) ChIP assay showed that DGCR5 knockdown significantly impaired the enrichment of ARID1A on the promoter of P21 in bladder cancer cells. (g) qRT-PCR analysis showed that DGCR5 or ARID1A knockdown suppressed the mRNA level of P21 in bladder cancer cells. *p < 0.05 or **p < 0.01 or ***p < 0.001 when compared with oe-NC group. ARID1A: AT-rich interaction domain 1A; ChIP: chromatin immunoprecipitation; DAPI: 4′,6-diamidino-2-phenylindole; DGCR5: DiGeorge syndrome critical region gene 5; GAPDH: glyceraldehyde 3-phosphate dehydrogenase; NC: negative control; qRT-PCR: quantitative real-time polymerase chain reaction; RIP: RNA immunoprecipitation [Color figure can be viewed at wileyonlinelibrary.com]
3.5 Silencing P21 reversed the effects of DGCR5 overexpression in T24 and SW780 cells
Overexpression of DGCR5 markedly enhanced the relative expression of P21 mRNA in T24 and SW780 cells (p < 0.01). However, after P21 was silenced, P21 mRNA relative expression in oe-DGCR5 + si-P21 group was significantly lower than that of oe-DGCR5 group (p < 0.01; Figure 5a). We also observed that compared with oe-NC group, T24 and SW780 cells in oe-DGCR5 group were with much lower OD450 values, remarkably higher percentage of cells in G0 phase, significantly lower migrated and invaded cells number, and markedly higher percentage of apoptotic cells (p < 0.05 or <0.01). At the same time, compared with oe-DGCR5 group, T24 and SW780 cells in oe-DGCR5 + si-P21 group had obviously increased OD450 values, significantly decreased percentage of cells in G0 phase, much higher migrated and invaded cells number, and dramatically decreased percentage of apoptotic cells (p < 0.05 or <0.01; Figure 5b-f). These results indicated that the downregulation of P21 had reversed effects with the overexpression of DGCR5.
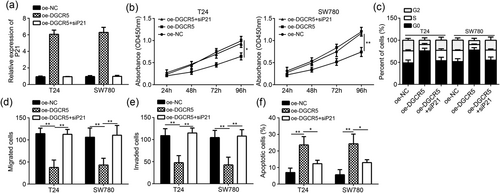
Knockdown of P21 reversed the effects of DGCR5 overexpression. (a) Relative mRNA levels of P21 were analyzed by qRT-PCR in T24 and SW780 cells. (b) Cell proliferation was measured by CCK-8 assay in T24 and SW780 cell-transfected indicative plasmids. (c) Cell-cycle distribution was analyzed by FACS. (d,e) Cell migration and invasion were determined by Transwell assay in T24 and SW780 cells. (f) Cell apoptosis was assessed by FACS in T24 and SW780 cells. *p < 0.05 and **p < 0.01. CCK-8: cell counting kit-8; DGCR5: DiGeorge syndrome critical region gene 5; FACS: fluorescence-activated cell sorting; NC: negative control; OD: optical density; qRT-PCR: quantitative real-time polymerase chain reaction
4 OVEREXPRESSION OF DGCR5 REPRESSED TUMOR GROWTH IN VIVO
At 2–4 weeks, the tumor volume of oe-DGCR5 group was remarkably lower than that of oe-NC group (p < 0.01; Figure 6a). Meanwhile, at Week 4, significantly decreased tumor weight in oe-DGCR5 group was found when compared with oe-NC group (p < 0.01; Figure 6b). qRT-PCR results showed that DGCR5 and P21 mRNA relative expression in tumor tissues of oe-DGCR5 group was both significantly higher than that of oe-NC group (p < 0.001; Figure 6c). Thus, DGCR5 overexpression significantly inhibited tumor growth in vivo.

Overexpression of DGCR5 repressed tumor growth in vivo. (a) Tumor volume was monitored every week. (b) Tumor weight was measured at the end point of xenograft experiment. (c) The expression levels of DGCR5 and P21 in tumor tissues of xenograft experiment were measured by qRT-PCR. **p < 0.01 and ***p < 0.001. DGCR5: DiGeorge syndrome critical region gene 5; NC: negative control; qRT-PCR: quantitative real-time polymerase chain reaction
5 DISCUSSION
In this study, we explored DGCR5 expression in bladder cancer. It could be noted that DGCR5 was significantly downregulated in bladder cancer tissues and cells, which severely reduced patients’ 5-year survival rate. DGCR5 was initially reported to be downregulated in Huntington's disease (Johnson, 2012). Currently, DGCR5 was found to be involved in multiple cancers, and low expression of DGCR5 was closely associated with the poor prognosis of several other cancers. Yong et al. (2017) illustrated in their article that decreased DGCR5 expression level predicted poor prognosis of patients suffering from pancreatic ductal adenocarcinoma. Huang et al. (2016) also proved that for patients with hepatocellular carcinoma, the 5-year survival rate of the high-DGCR5-expression group was 36.6%, while for low-DGCR5-expression group, it was reduced to 10.3%. Our findings were consistent with these previous studies that decreased DGCR5 expression significantly impaired the 5-year survival rate in bladder cancer patients.
The effect of DGCR5 on bladder cancer was further studied at the cellular and molecular levels. We found that the overexpression of DGCR5 markedly inhibited bladder cancer cells proliferation ability, dramatically promoted their apoptosis, and significantly increased the percentage of cells in G0 phase. As important cell-cycle-associated proteins, P21 was upregulated and cyclin D1 was downregulated after DGCR5 was overexpressed. It was reported that P21 has participated and mediated the process of DNA damage, which further resulted in a decreased cell proliferation and increased apoptotic capacity (Lee et al., 2013; Yao et al., 2017). Cyclin D1 was significantly associated with poor prognosis of multiple cancers (Li et al., 2014; H. Wang et al., 2014). It could promote cells entry into the S phase, which exerted promoting effects on the proliferation of cells (Wu, Liu, Liu, Yu, & Wang, 2016; Yu et al., 2016). P21 and cyclin D1 mediated cell proliferation and apoptosis through the regulation of the cell cycle. EMT played a key role in the development and progression of cancer. N-cadherin could lead to decreased adhesion capacity between tumor cells, thereby resulting in enhanced migration and mobility (Chal, Guillot, & Pourquié, 2017; Cosgrove et al., 2016). However, E-cadherin had a completely opposite effect on the adhesion ability between cells, which could inhibit tumor cells migration and invasion (Han et al., 2016; Zhang, Bu, Chen, Wang, & Sha, 2016). Our research found that the overexpression of DGCR5 could inhibit bladder cancer cells migration and invasion by upregulation of E-cadherin and downregulation of N-cadherin.
More important, this study also investigated the mechanisms by which DGCR5 affected the development of bladder cancer. Data indicated that DGCR5 interacted with ARID1A, a chromatin remodeling protein, to promote P21 transcription. Knockdown of P21 could significantly rescue the suppressed proliferation, migration, and invasion of bladder cancer cells by DGCR5 overexpression. ARID1A was considered as a tumor suppressor gene, which exerted an inhibitory effect in various malignant tumors. Takao et al. (2017) suggested in their research that declined ARID1A could cause unfavorable prognosis in breast cancer patients. ARID1A was also considered as the strongest tumor suppressor in gastric carcinogenesis among ARIDs. Its downregulation correlated positively with vascular invasion (Aso, Uozaki, Morita, Kumagai, & Watanabe, 2015). Considering the fact that the overexpression of ARID1A significantly inhibited hepatocellular carcinoma cell proliferation, migration, and invasion, researchers also proposed to use ARID1A as candidate target for the treatment of hepatocellular carcinoma (He et al., 2015). This study demonstrated for the first time that DGCR5 promoted the expression of P21 by stimulating the expression of ARID1A. In vivo studies have also shown that DGCR5 could inhibit the growth of bladder cancer cells in nude mice by upregulating the expression of P21, which provided an important theoretical basis for the application of DGCR5 in the treatment of bladder cancer.
In conclusion, this study revealed for the first time the decreased DGCR5 expression in bladder cancer, which significantly reduced the prognosis of patients and promoted the proliferation, migration, and invasion of bladder cancer cells. Overexpression of DGCR5 could inhibit the proliferation, migration, and invasion of bladder cancer cells and promote their apoptosis. Further research indicated that DGCR5 promoted the expression of P21 by stimulating the expression of ARID1A, thereby regulating the development of bladder cancer. Thus, DGCR5 might be used as a potential target for diagnosis and treatment of bladder cancer. This study provided an important theoretical basis for the clinical application of DGCR5, which had important clinical significance.
CONFLICTS OF INTEREST
The authors declare that they have no conflicts of interest.


