Gene expression of TWIST1 and ZBTB16 is regulated by methylation modifications during the osteoblastic differentiation of mesenchymal stem cells
Abstract
Background
Osteoblastic differentiation of mesenchymal stem cells (MSCs) is the principal stage during the restoration and regeneration of bone tissue. Epigenetic modifications such as DNA methylation play a key role in the differentiation process of stem cells. In this study, the methylation status of the promoter region of ZBTB16 and Twist1 genes and their role in controlling osteoblastic differentiation in MSCs was investigated during the osteoblastic differentiation of MSCs.
Methods
The MSCs were cultured under standard conditions and differentiated into the osteoblasts. We had three treatment groups including 5-azacytidine (methylation inhibitor), metformin (Twist-inhibitor), and procaine (Wnt/β-catenin inhibitor) and a non-treated group (control). Methylation level of DNA in the promoter regions was monitored by methylation specific-quantitative polymerase chain reaction (PCR). Also, the mRNA levels of key genes in osteoblastic differentiation were measured using real-time PCR.
Results
ZBTB16 gene expression was upregulated, and promoter methylation was decreased. For Twist1 messenger RNA (mRNA) level decreased and promoter methylation increased during osteoblastic differentiation of MSCs. 5-Azacytidine caused a significant reduction in methylation and increased the mRNA expression of ZBTB16 and Twist1. Metformin repressed the Twist1 expression, and therefore osteoblastic differentiation was increased. On the opposite side, procaine could block the WNT/β-catenin signaling pathway, as a consequence the gene expression of key genes involved in osteoblastic differentiation was declined.
Conclusion
We found that methylation of DNA in the promoter region of ZBTB16 and Twist1 genes might be one of the main mechanisms that controlling the gene expression during osteoblastic differentiation of MSCs. Also, we could find an association between regulation of Twist1 and ZBTB16 genes and osteoblastic differentiation in MSCs by showing the relation between their expression and some key genes involved in osteoblastic differentiation. In addition, we found a connection between the Twist1 expression level and osteoblastic differentiation by using a Twist-inhibitor (metformin).
1 INTRODUCTION
Mesenchymal stem cells (MSCs) are a type of stem cells naturally found within the various organs such as bone marrow, fat tissue, muscles, skin, and dental pulp (Dominici et al., 2006; Marofi, Vahedi, Biglari, Esmaeilzadeh, & Athari, 2017). Over the last decade, bone-marrow-derived MSCs (BM-MSCs) have been nominated as one of the eligible options for the cell-based therapies (Dominici et al., 2006; Karpov, Udalova, Pliss, & Galagudza, 2016). Several advantages such as high capacity of differentiation into various types of cells of the mesodermal lineage (e.g., osteoblasts, chondrocytes, adipocytes, myocytes, and cartilage), simple handling features such as easy isolation from the bone marrow and rapid ex vivo expansion, the suitability for autologous transplantation, high potential of self-renewability, and the easy procedure for identification make them a good choice for cell therapy (Dominici et al., 2006; Marofi et al., 2017). Although an MSC-based cell therapy has shown to be effective in the regeneration of tendons and cartilage (Haleem & Chu, 2010; Haleem et al., 2010), but the cellular pathways for differentiation of MSCs during the osteogenesis have not yet been elucidated (Ortuño et al., 2010). The major limitation for the bone tissue engineering is the inadequate hardness of the newly generated bone tissue which makes it fragile and too weak to tolerate the body weight (Ortuño et al., 2010). Therefore, due to the incapability of MSCs to produce large bones suitable for clinical use, bone tissue engineering has been prevented to be used extensively, and just as an experimental method has been limited to the research centers (Ortuño et al., 2010). However, on the other hand, some features such as the high physiobiological and adaptation capacity, differentiation flexibility, and the gene expression plasticity have made this type of cells easily amendable and reprogrammable (Ortuño et al., 2010). Therefore, future studies investigating the osteogenesis pathways at the molecular level will help to find a way to overcome the limitations of using MSCs as the therapeutic gene carriers (Ortuño et al., 2010). Osteoblasts, derived from MSCs of the bone marrow, are the cells primarily responsible for the formation of bones by calcification of extracellular matrix (Ortuño et al., 2010). Osteoblastic differentiation of MSCs is controlled by numerous transcription factors and signaling proteins (Ortuño et al., 2010). Runx2 and Osterix (Osx) are essential transcription factors during osteoblastic differentiation (X. Yang et al., 2004). Although Runx2 and Osx are known as the key regulators of osteogenesis, there are also other transcriptional factors involved in osteoblastic differentiation including Dlx5, Dlx3, FRA1, Twist1, ZBTB16, and ATF4 (X. Yang et al., 2004). There are some evidence indicating ZBTB16 (also known as PLZF and ZNF145) as a downstream transcription factor involved in osteoblastic differentiation. Therefore, ZBTB16 exerts its positive regulatory effect on osteoblastic differentiation by its close interaction with key osteogenesis regulators, Osx and Runx2. The studies have shown the significance of ZBTB16 during stem cells differentiation to osteoblasts (osteoblastic differentiation; Hemming et al., 2016; Onizuka et al., 2016). It seems that the ZBTB16 acts as an important late marker at the later stages of osteoblastic differentiation of stem cells (Saugspier et al., 2010). In addition, some of the studies have indicated a key role for Twist1 during osteoblastic differentiation of stem cells. Gene expression profiling of human Wharton’s jelly stromal cells using the RNA-Seq technology during induction of osteoblastic differentiation has revealed highly significant differential expression of Twist1 in comparison with thousands of evaluated genes (Belair et al., 2017). It seems that the expression of osteoblast-specific genes such as Runx2 occurs only in the absence of the Twist genes expression (Bialek et al., 2004). Nevertheless, we do not have a full picture of the mechanism which controls the osteoblastic differentiation, because contradictory evidence has been observed in in vivo and in vitro experiments. Numerous transcriptional factors, not yet fully determined, are involved in regulation of osteoblastic differentiation, but we do not still know much about how the gene expression of these factors is controlled (Juliandi, Abematsu, & Nakashima, 2010). One of the most important molecular procedures controlling the gene expression is the epigenetic modification that limits the gene expression by methylation of the DNA in the promoter region of a specific gene. Epigenetic modification at the level of DNA which is usually controlled through the methylation process is one of the most important mechanisms involved in regulation of the differentiation of stem cells (Alivand, Sabouni, & Soheili, 2016). However, a broad range of regulatory factors including hormones, growth factors, signaling pathways, and transcription factors are involved in osteogenesis (W. Huang, Yang, Shao, & Li, 2007). Recent studies have shown significant role of methylation of specific genes in cellular processes such as differentiation (Saki, Hagh, Mortaz, & Lajimi, 2013; Tarfiei et al., 2011). We have previously investigated the methylation status of Runx2, Osx, DLX5, and BSP genes during osteoblastic differentiation of MSCs (Hagh et al., 2015a). In the current study we aimed to further elucidate the role of epigenetic mechanisms during the osteoblastic differentiation of MSCs, by measuring the methylation level of the promoter region of two other genes involved in stem cells differentiation and osteogenesis: ZBTB16 and Twist1. Also, we monitored a signaling pathway involved in cellular development called Wnt/β-catenin to characterize the role of Twist1 and ZBTB16 and their related downstream or upstream regulatory genes in osteoblastic differentiation of MSCs from a mechanistic viewpoint.
2 MATERIALS AND METHODS
2.1 Cell culture conditions
Human bone-marrow-derived MSCs (hBMSCs) were purchased from Stem Cell Technology Research Center of Iran. The cells were suspended in Dulbecco’s modified Eagle medium (DMEM)-low glucose supplemented with fetal bovine serum (FBS) (10%), l-glutamine (2 mM), streptomycin (100 μg/ml), and penicillin (100 U/ml), then seeded onto the T75 cell-culture flasks and incubated at 37°C and 5% CO2 (Freshney, 2011).
2.2 Osteoblastic differentiation and treatments
Induction of osteogenesis was done 48 hr after seeding the cells. hBMSCs were cultured for 21 days at 37°C and 5% CO2 in bone differentiation medium containing DMEM-low glucose, l-glutamine (2 mM), streptomycin (100 μg/ml), penicillin (100 U/ml), β-glycerol phosphate (5 mM), ascorbate-2-phosphate (50 μg/ml), dexamethasone (10 nM; all purchased from Sigma-Aldrich, Darmstadt, Germany), and supplemented with FBS (10%; Tarfiei et al., 2011; L. Wang et al., 2017). To demonstrate the correlation between methylation status and gene expression level of ZBTB16 and Twist1, 5-azacytidine (10 μM; Ramos, Wijetunga, McLellan, Suzuki, & Greally, 2015), procaine (1 μM; Herencia et al., 2016; Sigma-Aldrich, St. Louis, MO), and metformin (1,1-dimethylbiguanide hydrochloride; 100 μM) was administered at the same time that osteogenesis stimulus for 21 days.
2.3 Determining the osteoblastic differentiation by alizarin red staining
Osteoblastic differentiation of MSCs was determined by alizarin red staining (ARS) of matrix mineralization (calcification) of differentiated MSCs/osteoblast-like cells. Matrix mineralization of the cells was measured at Days 14 and 21 of culture; the supernatant was discarded, and the cells were washed twice with phosphate buffered saline (PBS), and then fixed by formalin 10% for 15 min. Formalin was discarded, and the cells were washed twice with distilled water for 5 min. Then, 1 ml of ARS 1% (pH 4.2) was added, and the cells were incubated at 25°C for 20 min. Finally, the cells were washed four times with distilled deionized water. The stained matrix was examined under the inverted microscope at different magnifications (Tarfiei et al., 2011; L. Wang et al., 2017).
2.4 Confirmation of osteoblastic differentiation by real-time PCR
Osteoblastic differentiation confirmed by real-time polymerase chain reaction (PCR) analysis of the known gene markers of osteoblastic differentiation. The PCR profile was as follows: 1 cycle at 94°C for 5 min, 40 cycles at 94°C for 15 s, 58°C for 20 s, and 72°C for 20 s. Transcript levels of genes were normalized by an endogenous control, 18 s rRNA.
2.5 Methylation specific quantitative PCR
DNA was extracted from MSCs and differentiated MSCs (osteoblasts) on Days 1, 7, 14, and 21. A general protocol was used for bisulfite conversion. SYBR Green reagent (Thermo Fisher Scientific) was used for methylation specific quantitative PCR (MS-qPCR). The whole-blood-amplified DNA and SssI enzyme-treated DNA sample were used as the negative and positive controls, respectively for the methylation assay (Milani et al., 2010). Primers for Twist1 and ZBTB16 are listed in Table 1. The demethylation rate of Twist1 and ZBTB16 was calculated using a formula defined previously (Cottrell et al., 2007; Yadav et al., 2012; Zhuo et al., 2014) as follows: , in which the CtTG signifies the cycle threshold (Ct) attained by the unmethylated primers and the CtCG signifies the cycle threshold attained by methylated primers. Methylation and demethylation specific primers for Twist1 and ZBTB16 were designed using the Gene Runner software and MethPrimer website (Table 1; Li & Dahiya, 2002). A high resolution melting (HRM) analysis was performed based on a general protocol. A 100% methylated DNA was used as positive control, and unmethylated DNA was used as negative control.
| Gene symbol | Gene name | Location | Sequence accession IDs | CpG island size (bp) |
|---|---|---|---|---|
| ZBTB16 | Zinc finger and BTB domain containing 16 | 11q23.1 | NG_012140 | 1,900 |
| Twist1 | Twist family bHLH transcription Factor 1 | 7p21.2 | NG_008114.1 | 1,600 |
| Primers for MS-QPCR | Product size | Tm | ||
|---|---|---|---|---|
| Twist1 | ||||
| MF | TGTTCGTACGTTTCGGCG | 118 | 62.1 | |
| MR | ACCTAACCCGAACGACCG | 118 | 62.8 | |
| UMF | TTGTTTGTATGTTTTGGTGGGGA | 113 | 62.5 | |
| UMR | CCCAAACAACCAACCCCT | 113 | 61.2 | |
| ZBTB16 | ||||
| MF | AAGAGGCGTATCGTTTAGCG | 97 | 61.7 | |
| MR | CCCAACGACCGAATAACCG | 98 | 62.2 | |
| UMF | GGAAGAGGTGTATTGTTTAGTGAG | 101 | 60.4 | |
| UMR | AACCCAACAACCAAATAACCAAA | 101 | 61 | |
- Note. MS-QPCR: methylation specific-quantitative polymerase chain reaction; Tm: melting temperature.
2.6 Methylation of all CpG islands on the genomic DNA using SssI methylase
Whole blood DNA was methylated using Sss1 methylase (Biolabs, New England) according to the manufacturer’s instructions. The methylated DNA was used as positive control for methylation specific primers in MS-QPCR (Hagh et al., 2015a). The methylation rate was considered to be nearly 100%.
2.7 Gene expression analysis by real-time qPCR
The RNA was extracted from MSCs and osteoblasts on Days 0, 7, 14, and 21 using the TRIZOL Reagent (Life Technologies) according to the manufacturer’s instructions. RNA was quantified by electrophoresis and measured by Nanodrop. Then mRNAs were reverse-transcribed to the complementary DNAs with the Prime Script™ RT reagent Kit (Takara, Japan) based on the manufacturer’s protocol. Subsequently, real-time quantitative polymerase chain reaction (qRT-PCR) was done using the SYBR Green reagent (Thermo Fisher Scientific). Relative gene expression was calculated using the Pfaffl method (Pfaffl, 2012). Primer sequences for Twist1, ZBTB16, and other genes are listed in Table 2.
| Primers for qPCR | Product size | Tm | ||
|---|---|---|---|---|
| Twist1 | F | GCCAGGTACATCGACTTCCTCT | 122 | 61.5 |
| R | TCCATCCTCCAGACCGAGAAG | 122 | 60.5 | |
| ZBTB16 | F | GAGCTTCCTGATAACGAGGCTG | 107 | 60.80 |
| R | AGCCGCAAACTATCCAGGAACC | 107 | 60.90 | |
| OPN | F | CGAGGTGATAGTGTGGTTTATGG | 127 | 59 |
| R | CACCATTCAACTCCTCGCTTTC | 127 | 60 | |
| 18s rRNA | F | CAGCCACCCGAGATTGAGCA | 120 | 60 |
| R | TAGTAGCGACGGGCGGTGTG | 120 | 60 | |
| BSP | F | AAGGGCACCTCGAAGACAAC | 119 | 60 |
| R | CCCTCGTATTCAACGGTGGT | 119 | 60 | |
| Runx2 | F | CGCCTCACAAACAACCACAG | 225 | 60 |
| R | TCACTGTGCTGAAGAGGCTG | 225 | 60 | |
| Sp7 | F | AGTCAGAGTAGGACTGTAGGAC | 247 | 58 |
| R | AGTGAACTTCCTCCTCAAGC | 247 | 58 | |
| COL1A1 | F | AGTGGTTTGGATGGTGCCAA | 170 | 60 |
| R | GCACCATCATTTCCACGAGC | 170 | 60 | |
| ALP | F | CTCAACACCAATGTAGCCAAGAATG | 75 | 60 |
| R | GGCAGCGGTTACTGTGGAGA | 75 | 60 | |
| OCN | F | TCCTTTGGGGTTTGGCCTAC | 148 | 60 |
| R | CCAGCCTCCAGCACTGTTTA | 148 | 60 | |
| BMP2 | F | ACTCGAAATTCCCCGTGACC | 144 | 60 |
| R | CCACTTCCACCACGAATCCA | 144 | 60 | |
- Note. qPCR: quantitative polymerase chain reaction.
2.8 Interaction analysis
The interactions network and the genes involved in the differentiation of MSCs into osteoblasts were retrieved from various online databases including; NCBI Gene database (NCBI Research Coordinators, 2016), Gene Ontology (GO; Gene Ontology Consortium, 2004), UniProt (UniProt Consortium, 2014), GeneMANIA (Warde-Farley et al., 2010), BioGRID (Stark et al., 2006), and Wiki-Pi (Orii & Ganapathiraju, 2012). For a graphical representation of the interactions network between genes of interest, we searched several gene names including Twist1, Twist2, ZBTB16, Runx2, SP7 (also called Osterix), COL1A1, BMP2, OPN, and some other related genes as input gene names in the GeneMANIA online software version 3.5.
2.9 Statistical analysis
One-way analysis of variance was used to compare all groups. Post hoc Dunnett’ test was used to compare the control group with other treatment groups, and Tukey’s test was used for comparison between treatment groups. All analyses were performed using the Graph Pad Prism software version 6.1. P < 0.05 was considered as the significance threshold.
3 RESULTS
3.1 Osteoblastic differentiation was validated by detection of matrix mineralization
ARS confirmed the establishment of a mineralized matrix; calcium sediments as an indicator of the biologic activity of osteoblasts were determined as the red-colored matrix on the 21st day of culture of the cells (Figure 1d), whereas undifferentiated MSCs were negative in ARS; no profound red-stained calcification was detected (Figure 1c).
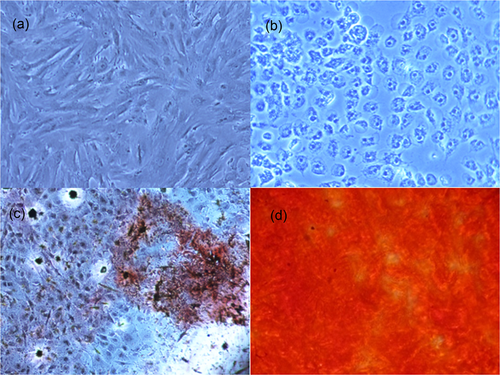
(a) MSCs were imaged by an inverted microscope equipped with a digital camera (Magnification: ×40). (b) Differentiated MSCs (osteoblasts) are imaged under the microscope (they were not stained by Alizarin-red). (c,d) Shows the Alizarin red-stained MSCs over the osteoblastic differentiation period on the 14th and 21st days, respectively. The MSCs on Day 21 stained was more profound. MSCs: mesenchymal stem cells
3.2 Gene expression of biomarkers of osteoblastic differentiation was detected by RT-qPCR
MSCs osteoblastic differentiation was confirmed by detection of OPN, BMP2, BSP, ALP, COL1A1, OCN, RUNX2, and SP7 gene expression using the RT-qPCR method. Undifferentiated MSCs demonstrated low mRNA levels of osteoblastic markers, but in contrast, their mRNA expression level was increased during the progression of the differentiation processes (Figure 2). On Day 21, gene expression of osteoblastic markers was significantly higher than that on Day 0 (p < 0.05, Tukey’s test).
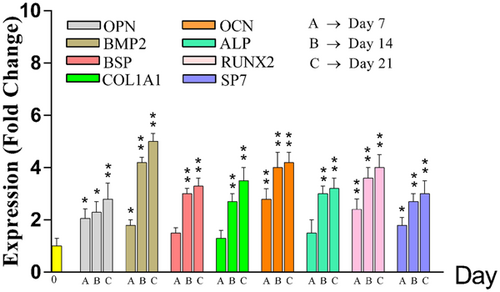
Gene expression of osteoblastic biomarkers was represented on Days 0, 7, 14, and 21 of osteoblast differentiation. There was a significant difference between Control (Day 0) and Days 7, 14, and 21 in OPN, BMP, OCN, RUNX2 and SP7 during osteoblastic differentiation. Although in BSP, COL1A1, and ALP there was a significant difference between Control and Days14 and 21 but not Day 7. (*p < 0.05, **p < 0.01). ALP: alkaline phosphatase; OCN: osteocalcin
3.3 There was a positive correlation between hypomethylation status and gene expression level of ZBTB16 and Twist1
Specificity of the primers for detection of methylated and unmethylated regions on DNA was confirmed using the melting curve analysis. The methylation-specific qPCR analysis demonstrated a remarkable change in methylation status on promoter regions of ZBTB16 and Twist1 on Days 0, 7, 14, and 21 during osteoblastic differentiation of MSCs. We found that the methylation level (% M) of the promoter region of ZBTB16 gene was gradually decreased over time. The reduction level was significant on Days 14 and 21 during osteoblastic differentiation (p < 0.05). Consequently, the ZBTB16 gene expression level was upregulated in an ascending manner during the osteoblastic differentiation. The ZBTB16 mRNA level on Days 14 and 21 was significantly higher than that in control cells (on Day 0). Therefore, there was a very strong and significant negative correlation between the mRNA level and methylation level of ZBTB16 (R2 = 0.9744, p < 0.05, regression analysis; Figure 3). Interestingly, Twist1 demonstrated an opposite footprint for both methylation and gene expression levels. The methylation level of Twist1 was increased by the progression of osteoblastic differentiation. Conversely, Twist1 mRNA reduction was significant on Days 14 and 21 (p < 0.05) in comparison with the control cells (Day 0). Thus, Twist1 gene expression was inhibited gradually by the progression of osteoblastic differentiation. The inhibition was nearly complete on Day 21 when full differentiation of MSCs to the osteoblasts was established. Therefore, a strong but not significant negative correlation between the gene expression and methylation level of Twist1 gene was calculated (R2 = 0.85, regression analysis; Figure 3).
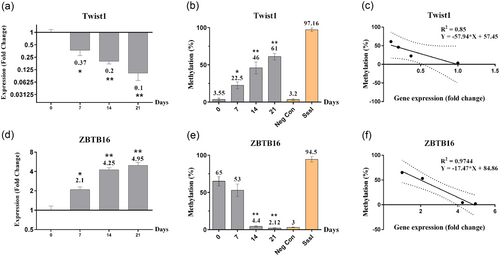
The figure represents the gene expression, promoter methylation level and correlation between them for ZBTB16 and Twist1 genes during osteoblastic differentiation. (a) shows a significant reduction in Twist1 expression level during osteoblastic differentiation, which indicates a inhibitory role for Twist1 during the differentiation process. (b) The methylation level in promoter region of Twist1 gene demonstrated an increased pattern during the progression of osteoblast differentiation. (c) Correlation analysis revealed a strong but not significant negative correlation between gene expression level and methylation status oTwist1 gene (R2 = 0.85, p > 0.05, regression analysis). (d) ZBTB16 gene expression was significantly upregulated during osteoblastic differentiation. (e) The promoter region of ZBTB16 gene was hypomethylated during the osteoblastic differentiation. (f) There was a strong and significant correlation between gene expression and methylation level of ZBTB16 (R2 = 0.9744, p < 0.05, regression analysis). The whole-blood amplified-DNA and SssI enzyme-treated DNA were used as the negative (Neg Con) and positive controls, respectively. (*p < 0.05, **p < 0.01)
3.4 5-Azacytidine diminishes methylation level of ZBTB16 and Twist1 genes so increases their expression during osteoblastic differentiation of MSCs
5-Azacytidine could trigger the demethylation of the Twist1 and ZBTB16 DNA by effecting the methyltransferases (Costa, Barra, Lentini, Cilluffo, & Leonardo, 2016). Methylation levels of Twist1 and ZBTB16 showed a significant decrease and mRNA levels of this genes were increased during osteoblastic differentiation in 5-azacytidine treated group in comparison with the control group (Figure 4; p < 0.05).
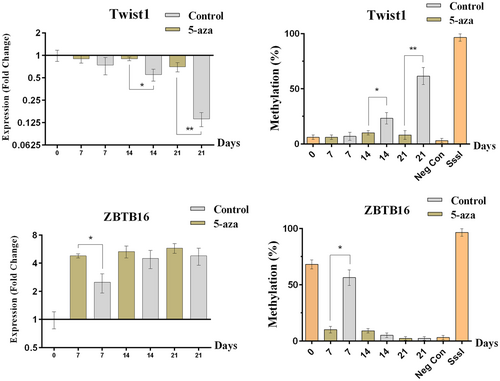
The figure represents the gene expression and promoter methylation level for ZBTB16 and Twist1 genes when the cells were treated with 5-azacytidine during osteoblastic differentiation of MSCs. Twist1 and ZBTB16 showed a significant reduction in promoter methylation level and an augmented expression in mRNA compared with the control group during osteoblastic differentiation which indicates an important role of methylation in the controlling of gene expression of Twist1 and ZBTB16 during the differentiation process (*p < 0.05, **p < 0.01). mRNA: messenger RNA
3.5 Inhibition of Twist1 by metformin led to augmentation of osteoblastic differentiation
Metformin could inhibit Twist1. The methylation levels of Twist1 showed a minor increase and mRNA levels of this gene were decreased significantly (p < 0.05) during osteoblastic differentiation in metformin treated group in comparison with the control group (Figure 5). We also measured other osteoblastic marker genes. Results showed an increased expression of these markers during osteoblastic differentiation, especially in the ending stages. Also, inhibition of Twist1 by metformin increased the mRNA expression of key osteoblastogenesis-associated genes (Figure 5). Therefore, treating of MSCs by metformin, leads to acceleration of the osteoblastic differentiation.
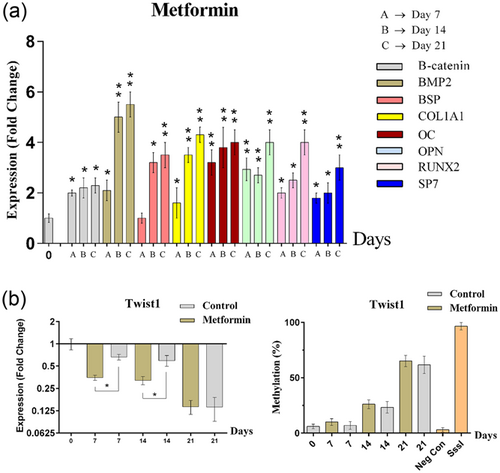
The figure represents gene expression and promoter methylation level of Twist1 and mRNA level of osteoblastic marker genes in control and metformin treated groups during osteoblastic differentiation of MSCs. (a) mRNA level of osteoblastic marker genes in metformin-treated group increased during osteoblastic differentiation. (b) Gene expression of Twist1 decreased and methylation level of this gene increased during osteoblastic differentiation. (*p < 0.05, **p < 0.01). MSCs: mesenchymal stem cells; mRNA: messenger RNA
3.6 Procaine could greatly affect the osteoblastic marker genes through inhibiting the WNT/β-catenin signaling pathway but could not induce a significant effect on Twist and ZBTB16
Procaine blocked the osteoblastic differentiation of MSCs by inhibiting the WNT/β-catenin signaling pathway. In procaine-treated groups, ARS was negative after 21 days of MSCs stimulation by dexamethasone. Also, mRNA levels of osteoblastic differentiation-related genes were significantly lower than non-treated cells which did not receive procaine (p < 0.05). Procaine-treated group, showed a significant reduction in mRNA level of β-catenin (p < 0.05; Figure 6).
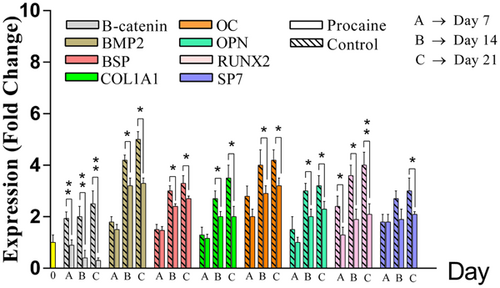
The figure represents gene expression of β-catenin and osteoblastogenesis marker genes in procaine-treated and control groups during osteoblastic differentiation of MSCs. In procaine-treated cells, mRNA levels of osteoblastogenesis marker genes were significantly lower than control cells. Also, the β-catenin gene was significantly downregulated in procaine-treated cells. As the days of experiment gone, β-catenin gene expression was getting more inhibited. This result showed successful canonical inhibition of the WNT/β-catenin signaling pathway by procaine caused a diminished osteoblastic differentiation. (*p < 0.05, **p < 0.01). MSCs: mesenchymal stem cells
In contrary to the other osteoblastogenesis-related genes (BMP2, BSP, COL1A1, OC, OPN, RUNX2, and SP7), the mRNA level of Twist1 and ZBTB16 was not changed significantly in procaine treated cells during osteoblastic differentiation in comparison with non-treated cells. However, their mRNA level changed during osteoblastic differentiation. But, their gene expression footprints were similar in both procaine-treated and control cells. Moreover, the methylation status of both genes was also similar (without any significant difference) in two groups of cells including procaine-treated and non-treated cells (Figure 7).
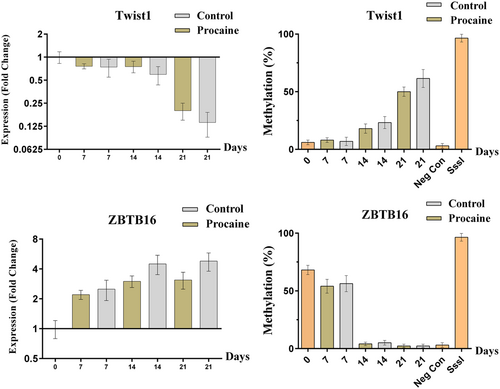
The figure represents the gene expression and promoter methylation level of Twist1 and ZBTB16 genes in procaine-treated and non-treated cells during osteoblastic differentiation of MSCs. Gene expression of Twist1 in both procaine-treated and non-treated cells was downregulated in a similar manner and without significant difference. In contrast, the mRNA level of ZBTB16 was upregulated in both conditions; procaine treatment and no treatment. Again, there was not any significant difference between two groups of MSCs. A similar pattern was observed for methylation status of Twist1 and ZBTB16 without significant differences between procaine-treated and non-treated MSCs. MSCs: mesenchymal stem cells; mRNA: messenger RNA
3.7 Interaction analysis
The interaction analysis using GeneMANIA, GO, NCBI Gene, and UniProt online databases revealed that most of the biologic processes and functions found for searched genes are related to bone/ossification/osteoblastic development or associated with histone deacetylases (Figure 8). The gene networks from GeneMANIA show biological links between ZBTB16 and histone deacetylases genes (HDAC1, HDAC4, HDAC5, and HDAC7), regulators with histone deacetylase binding activity (NCOR1 and NCOR2), an ossification-associated gene (BMP6), and some other regulatory genes (FHL2, FHL3, and CBFB). In addition, the software found some links between Twist1 gene and a histone deacetylase (HDAC4), an ossification-associated gene (Twist2), and some other genes (COL1A1, TBX2, NR6A1, SREBF1, and KAT2B). KAT2B is remarked in the GeneMANIA analysis as a protein with acetyltransferase activity. In the online databases and the gene networks reconstructed by the GeneMANIA software, there was a positive regulatory effect in ossification and osteoblastic differentiation for human and murine RUNX2 and ZBTB16 genes. Also, a positive regulatory effect for ZBTB16 in ossification process was found in GO and Wiki-Pi databases. The Wiki-Pi, NCBI Gene, and BioGRID analysis results showed the participation of NCOR1, NCOR2, TBX2 and RUNX1, RUNX2, ZBTB16 and Twist1 genes in ossification/osteoblastic differentiation process. However, in three databases (NCBI Gene, Uniprot, and Wiki-Pi) a negative regulatory effect of Twist1 on osteoblastic differentiation was indicated. Moreover, BioGRID analysis showed ZBTB16 and RUNX1 as interactors but no direct interaction was found between Twist1 and Runx1/Runx2. In addition, according to the GeneMANIA analysis, the ZBTB16 is coexpressed with BMP6 and has a common molecular pathway with NCOR2, genetic interactions with HDAC5, FHL2, FHL3, and CBFB and shows physical interactions with HDAC1, NCOR1, and NCOR2. On the other hand, the GeneMANIA analysis shows coexpression of Twist1, COL1A1, and HDAC4. The analysis also revealed a common molecular pathway between Twist1 and TBX2, genetic interactions between Twist1 and COL1A1, NR6A1 and CAT2B, physical interaction between Twist1 and CAT2B and shared protein domains among Twist1 and Twist2 and SREBF1. Moreover, the analysis showed the remarkable linked pathways between TBX2 gene and Twist1 gene. Based on the gene networks, TBX2 itself shares common protein domains with RUNX1, RUNX2, and RUNX3, has genetic interaction with BMP4 and coexpressed with HDAC5, HDAC7, and BMP4. The graph also exhibits a physical interaction between SP7 (Osterix) and HNF1A. In the analysis, a predicted interaction between SP7 and TAF4B was demonstrated. TAF4B itself shows links with RUNX3, BMP2, and BMP4. The GeneMANIA also found links between COL1A1 and SPP1, HDAC7, NCOR2, and Twist1. There are also links between BMP2 and other BMP genes and NCOR2 and HDAC7. The software also shows links among SPP1 (also known OPN) and RUNX3 and COL1A1 (Figure 8).
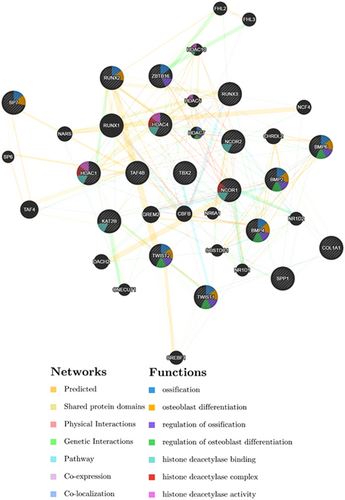
The schema represents the various types of molecular interactions (as colored lines) and functions (as colors within circles) between genes involved in cell growth, proliferation, and differentiation processes. Each color means a type of molecular interaction or function which is defined within the graph by a colorguide. The whole graph produced using an online software; GeneMANIA version 3.5 but all of the molecular functions were not represented due to software limitations. Input genes including Twist1, Twist2, ZBTB16, Runx2, SP7, COL1A1, BMP2, and OPN and some other related genes were represented as shaded circles. According to reports produced by software, the links (as molecular interactions) between the circles (as the genes) are consisted of 34.66% predicted, 21.55% shared protein domains, 13.96% physical interactions, 12.23% genetic interactions, 10.62% common pathways, 5.14% coexpressions, and 1.84% colocalization. Moreover, five most statistically significant biological processes (with a Benjamini–Hochberg FDR multiple testing correction) indicated for genes in the gene networks by GeneMANIA software are osteoblast differentiation, transcription initiation from RNA polymerase II promoter, DNA-templated transcription, ossification, and the Notch signaling pathway, respectively
4 DISCUSSION
Twist1 is a transcription factor belonging to the Helix-Loop-Helix (HLH) family with a fundamental role in development of stem cells to a specific cell lineage and regulating the differentiation pathways (Bialek et al., 2004; Cakouros et al., 2015; Castanon & Baylies, 2002; Manokawinchoke, Pimkhaokhum, Everts, & Pavasant, 2014; Y. Zhang et al., 2008). ZBTB16 is a Kruppel-like and zinc finger type transcription factor with nine C-terminal zinc finger domains for DNA binding and a N-terminal BTB/POZ domain for protein−protein contacts (T. Zhang et al., 1999). It was shown that ZBTB16 acts as a transcription factor with a regulatory effect on osteoblastogenesis (Liu, Lee, Lim, & Shyh-Chang, 2016). In the present study, we found that ZBTB16 experienced a remarkable leap in its mRNA level particularly on later stages of MSCs differentiation to osteoblasts. These results indicate the critical stimulatory role of ZBTB16 on MSCs and therefore a promoting role on the osteoblastic differentiation. We observed that ZBTB16 gene expression level in fully-differentiated MSCs (osteoblasts) was increased by 4.9-folds in comparison with the level in control cells. We also noticed a significant reduction in methylation level of promoter region with a close correlation to the gene expression level. These results indicate a key role for methylation processes in regulating the ZBTB16 gene expression during the osteoblastogenesis. Also, the results indicated that the epigenetic changes (methylation) in the promoter region of ZBTB16, is one of the main mechanisms responsible for regulation of gene expression. Therefore, induction of gene expression at the mRNA level coincides with a decrease in methylation status at the DNA level in the promoter region of ZBTB16. A sharp increase in ZBTB16 gene expression level on Days 14 and 21 of osteoblastic differentiation suggests a late-stage and functional role for this gene. The correlation analysis provides a mathematical base for prediction of progression level of osteoblastogenesis. Besides the surface markers, morphology, and expression levels of some specific genes, regulatory mechanisms such as epigenetic modifications can also be used as a biomarker for determining the differentiation and development stage in MSCs.
The critical role of ZBTB16 in skeletal development has been unraveled previously. Genetic mutation(s) in ZBTB16 gene causes serious defective skeletal development. A missense mutation on the maternal allele and an 8-Mbp deletion on the paternal allele of ZBTB16 on chromosome 11 resulted in reduced skeletal development and genital hypoplasia in a 10-year-old boy (Fischer et al., 2008). Onizuka et al. (2016) showed that silencing ZBTB16 gene in MSCs using a small interfering RNA (siRNA) can inhibit alkaline phosphatase (ALP) activity and key genes involved in osteoblastic differentiation (osteocalcin [OCN] and bone sialoprotein [BSP]). Moreover, blocking Osx gene expression using a siRNA caused a substantial reduction in ZBTB16 expression, indicating a fundamental role for Osx in regulating the ZBTB16 expression. Further analysis using the chromatin immunoprecipitation technology revealed a GC-rich region on ZBTB16 sequence specific for Osx protein. These results indicated ZBTB16 as a downstream target gene of Osx during osteoblastic differentiation of human MSCs. Also, it was shown that ZBTB16 can induce osteogenesis and mineralization in dental follicle cells (DFCs) by a BMP- and Osx- based mechanism but independent of Runx2. Transient transfection of DFCs for overexpression of ZBTB16 showed that all genes upregulated during dexamethasone-mediated osteogenesis were also upregulated by ZBTB16 overexpression. ZBTB16 can control Osx transcription by direct binding on the promoter region but not that of Runx2 (Felthaus et al., 2014). Moreover, it was suggested that overexpression of the ZIP1 zinc transporter causes the upregulation of osteoblast-associated genes such as ZBTB16 (PLZF), ALP, OPN, and Runx2 (Cbfa1) in MSCs (Tang et al., 2006). ZBTB16 acts as an upstream regulator of Runx2 (Cbfa1) and downstream target gene of Osterix (Ikeda et al., 2005; Onizuka et al., 2016). Disregulation or functional defects in ZBTB16 have been known to be associated with bone-related diseases. An overexpression of ZBTB16 in patients with OPLL (ectopic bone formation), was detected (Fischer et al., 2008; Inoue, Ikeda, & Tsukahara, 2006). Therefore, ZBTB16 plays a key role during osteoblastic differentiation. Our results are in agreement with the mentioned studies. We found that ZBTB16 is highly upregulated during dexamethasone-mediated osteoblastic differentiation of MSCs. Its expression was strongly correlated with the methylation status of the promoter region, indicating a key role for methylation regulation of ZBTB16 gene expression.
Furthermore, the interaction analysis showed physical interactions between Twist1 and KAT2B and molecular links with RUNX1, RUNX3, HDAC1, and NCOR1. KAT2B (also called PCAF) exerts its fundamental role in osteoblastic differentiation via acetylation of Runx2. PCAF can directly bind to Runx2 and acetylate it (C.Y. Wang et al., 2013). Moreover, it has been known that Twist1 has crucial role in regulating development and osteogenesis processes. Twist1 has an inhibitory effect on osteoblastic differentiation. Its increased expression is accompanied by down regulation of genes involved in osteoblastic differentiation. Twist1 is expressed in mesenchymal skeletal cells and plays a significant role in resolution of the gaps between skull bones of newborns (Bialek et al., 2004; Y. Huang et al., 2014). Genetic mutations in Twist1 lead to Saethre−Chotzen syndrome, a dysplasia caused by haploinsufficiency in the Twist locus. The disease causes incomplete fusion of premature skull bones in newborns. There are evidence indicating that Twist1 controls progression of differentiation of osteoprogenitors by regulating RUNX2 and FGF but the exact mechanism has not been fully understood to date (25). Both Twist proteins prevent osteogenesis but only Twist1 haploinsufficiency has been associated with bones fusion (synostosis). Twist1- and Twist2- haploinsufficiency in genetically engineered mice did not cause significant premature ossification and craniosynostosis, instead resulted in defective bone formation due to negative effect on the FGF signaling (Y. Huang et al., 2014). Knockdown of Twist1 promotes the osteoblastic differentiation of human adipose tissue-derived MSCs via endogenous induction of the BMP and ERK/FGF signaling pathways. Activation of the BMP and ERK/FGF pathways leads to upregulation of TAZ, a transcription factor that causes further induction of osteoblastic differentiation of MSCs (Quarto, Senarath-Yapa, Renda, & Longaker, 2015). Our GeneMANIA analysis also showed molecular links between Twist1 and CAT2B and TBX2. CAT2B and TBX2 themselves showed molecular links with BMP, HDAC, and RUNX series of genes. Twist1 can transiently inhibit the osteoblastic differentiation at the early stages by direct interaction with RUNX2. But osteoblast-like cells rapidly appears during osteoblastogenesis after downregulation of Twist proteins (Bialek et al., 2004). There are also some evidence in regulatory effect of Twist on Runx2 in differentiated bone cells; osteoblasts. The study reported that Twist haploinsufficiency leads to reduced expression of Runx2 (Cbfa1), indicating Runx2 as a target gene for Twist (Lu et al., 2012; Yousfi, Lasmoles, Kern, & Marie, 2002). In undifferentiated bone-marrow–derived MSCs cultured in a hypoxic condition, Twist repressed Runx2 expression by binding to promoter region of Runx2t1 (type 1 Runx2). Inhibition of Runx2 further resulted in repression of Runx2t1 downstream genes such as BMP2 and Runx2t2 (D.C. Yang et al., 2011). Suppression of Runx2 as one of the master regulators of osteoblastogenesis can inhibit the osteoblast differentiation and bone skeletogenesis (D. C. Yang et al., 2011). Recent findings have revealed that Twist1 is a critical regulator of mesenchymal cells fate during osteogenesis and skeletal development. Twist1 controls the differentiation of mesenchymal cells into chondrocytes, osteoblasts, or adipocytes via various mechanisms either by positive or negative effects. Twist1 stops the progression of osteoblast differentiation and freezes the cells in an osteoprogenitor-like state. In other words, it keeps the osteoblastogenesis procedures at their early-stages. Twist1 negatively regulates both Runx2 and FGFR2. Runx2 and FGFR2 have critical roles in induction of differentiation of MSCs into different lineages (Miraoui & Marie, 2010). Twist acts as the upstream regulator of Runx2. Runx2 itself as an upstream regulator, controls Osx (also called SP7) and stimulates differentiation of MSCs into osteo-chondro-progenitors. Osx induces osteo-chondro-progenitors to further differentiate into preosteoblasts by positive co-operation with β-catenin. However, preosteoblasts need other signals to complete differentiate into osteoblasts (W. Huang, Yang, Shao, & Li., 2007). On the other hand, we found increasing level of β-catenin expression in MSCs during osteoblastic differentiation. Over the time of induction of osteoblastic differentiation, the gene expression of osteoblastogenesis-related genes such as SP7 was also increased. The link between osteoblastogenesis-related genes and β-catenin was further confirmed by reduced expression of the osteoblastogenesis-related genes after treatment of MSCs with a β-catenin inhibitor, procaine. These evidence indicate that although the absence of Twist proteins and their downstream genes promotes the osteoblastic differentiation but their presence is not necessarily associated with full blocked osteoblastogenesis (antiosteogenic effect), instead is related to regulation of alternative pathways involved in osteoblastogenesis. Twist1 overexpression leads to osteoblast differentiation independent of Runx2 (Bialek et al., 2004). In other words, twist proteins determines the onset of osteoblasts differentiation (early stages of osteoblasts differentiation) rather than the subsequent progression procedures (Bialek et al., 2004). Therefore, it seems that there are several signaling pathways for each stage of osteoblast differentiation and also for bone formation. We found a reducing pattern in the Twist1 gene expression during the time of progression of osteoblastic differentiation of MSCs. The gene expression was reached to its minimum level on Days 14 and 21, suggesting a mainly late-stage inhibition of Twist1 gene expression. However, mRNA level of Twist1 at first 14 days of induction of osteoblastic differentiation was above 50% of the mRNA level in zero-day cells (control group) and gene methylation level on Day 7 was just 22.5%, suggesting a role for Twist1 gene at early stages of osteoblastic differentiation. Generally, it has been known that DNA methylation plays an important role in regulation of genes. Osteogenic differentiation of MSCs can also be regulated by methylation modifications or other epigenetic alterations at the chromatin and DNA levels (Bialek et al., 2004). We also found strong correlation between expression level and methylation status of both ZBTB16 and Twist1 genes during osteoblastic differentiation of MSCs which suggests methylation-mediated regulation of ZBTB16 and Twist1.
To prove our results, we used three agents: (a) Procaine, a local anesthetic drug as a WNT/β-catenin signaling pathway inhibitor (Gao et al., 2009; Herencia et al., 2016) and a DNA-demethylating agent (Villar-Garea, Fraga, Espada, & Esteller, 2003), (b) Metformin; an antihyperglycemic drug as a Twist1 inhibitor (Jang et al., 2011). (c) 5-azacytidine; a DNA-demethylating agent (Costa, Barra, Lentini, Cilluffo, & Di leonardo, 2016). Procaine decreases osteoblastic differentiation through inhibition of the WNT/β-catenin signaling pathway. Although we found that the gene expression of ZBTB16 was increased and conversely the methylation level was decreased during osteoblastic differentiation of MSCs, but ZBTB16 gene expression and methylation level were not changed significantly in procaine-treated MSCs compared to non-treated cells. Moreover, procaine increased the expression of Twist1 following inhibition of osteoblastic differentiation and also reduced the promoter methylation of this gene. But, the gene expression and methylation level of Twist1 between procaine-treated and non-treated cells was not significant. However, the gene expression of other osteoblastogenesis-associated genes such as BMP2, OC, OPN, RUNX2, and COL1A1 was changed significantly particularly on Days 14 and 21. Altogether, these findings indicate a possible relation between the WNT/β-catenin signaling pathway and regulation of osteoblastogenesis by some of the osteoblastogenesis-associated genes rather than by Twist1 axes. Previously it was shown that procaine has a demethylating activity at 1−10 mM ranges (Villar-Garea et al., 2003). Because we used very low doses (2 μM), therefore a low demethylation activity of procaine was observed. In addition, based on our findings, 5-azacytidine has been associated with a significant decrease in methylation level of both ZBTB16 and Twist1 genes. Whereas the methylation level was decreasing, the expression level of both genes was increased. The results indicate that the expression of both genes is mostly controlled by the promoter methylation of ZBTB16 and Twist1. Moreover, metformin accelerated the osteoblastic differentiation through inhibition of mRNA expression of Twist1 but not by increasing its methylation level. The results suggest that metformin acts through the mechanisms independent of Twist1-methylation which might be a probable direct physical interaction.
5 LIMITATIONS AND CONCLUSION
In this study we found upregulation of ZBTB16 and downregulation of Twist1 gene expression over the time of progression of osteoblastic differentiation of MSCs. We also measured DNA-methylation level by MS-qPCR and HRM analysis. Our results revealed that methylation regulation of ZBTB16 and Twist1 is the mechanism by which strongly correlates with gene expression during the osteoblastic differentiation of MSCs. Moreover, based on our observations during monitoring the gene expression and methylation status, we can conclude that ZBTB16 exerts a stimulatory effect whereas Twist1 exhibits an inhibitory effect on differentiation pathways of MSCs. MS-qPCR is a very specific and sensitive method for quantitative measuring methylation level in any type of biological samples in comparison with the other methods such as conventional methylation specific PCR (MSP) but however it suffers from few limitations. The biggest problem with this approach is that it can only identify methylated CpGs in binding sites of forward and reverse primers. So this method cannot identify methylated CpGs in other areas of DNA (Kurdyukov & Bullock, 2016). Therefore, we also used HRM analysis as a complementary method for evaluation of methylation status. However, for enhancing the accuracy and reliability of results, we suggest using some methylation-affecting chemicals such as 5-azacytidine in future in vivo and in vitro studies on osteoblastic differentiation of MSCs. In addition, we suggest using alternative methods capable of detecting multiple CpGs to obtain more reliable and accurate results. Moreover, further precise experiments such as sequencing methods for detection of methylation level are required to confirm epigenetic modifications as a mechanism involved in controlling the osteogenesis-associated genes expression. Also, further studies at the regulatory molecules level using novel knock-down (e.g. RNAi) or knockout methods are required to clear the signaling pathways and related regulatory molecules/modifications during the osteoblastic differentiation.
ACKNOWLEDGMENTS
All authors contributed to the conception and the main idea of the work. F. Marofi and G. Vahedi performed all of the experimental works, drafted the main text, figures, and tables. M. F. Hagh and S. Salarinasab supervised the work and provided the comments and additional scientific information. M. Alivand, M. Zadi Heydarabad and S. Salarinasab reviewed and revised the text. All authors read and approved the final version of the work to be published.
CONFLICTS OF INTEREST
There is no conflicts of interest


