Distinct Tie2 tyrosine phosphorylation sites dictate phenotypic switching in endothelial progenitor cells
Abstract
Angiogenesis is a regulated process involving the proliferation, migration, and remodeling of different cell types particularly mature endothelial and their progenitor cells, nominated as endothelial progenitor cells (EPCs). Tie2/Tek is a tyrosine kinase receptor expressed by endothelial cells that induces signal transduction pathways involved in endothelial biology. To address the potential importance of the various tyrosine residues of Tie2 in EPC development, we generated a series of Tie2 tyrosine mutated (Y1106F, Y1100F, and Y1111F) EPCs and then assess the biological features of these cells. Clonogenic, tubulogenic, proliferative, migratory, and functional properties of these cells were analyzed. Next, GFP-positive EPCs containing Tie2 tyrosine mutations were systemically transplanted into sublethaly irradiated mice to analyze the potency of these cells for marrow reconstitution. We found that mutation in the Tie2 tyrosine 1106 residue directed EPCs toward a mature endothelial phenotype, which was associated with augmented tubulogenic and migratory properties, and increased phosphorylation of the active site (tyrosine 992) as well as increased vascular perfusion in the in vivo Matrigel plug assay. Moreover, transplantation of 1106 Tie2 mutant EPCs failed to reconstitute the bone marrow after myeloablation, whereas transplantation of EPCs with the 1100 or 1111 Tie2 tyrosine mutation resulted in bone marrow engraftment, leading to improved survival of recipient mice. Our findings demonstrate that the tyrosine 1106 residue in Tie2 plays a key role to maintain the stemness features of EPCs.
1 INTRODUCTION
Development of a functional cardiovascular system is dependent on vasculogenesis, where in endothelial progenitor cells (EPCs) differentiate, migrate, and coalesce to form the primordial vessels (Herbert & Stainier, 2011). This phenomenon is subsequently remodeled through angiogenesis where endothelial cells in the primary vessels sprout and branch, forming the complex vascular system (Roca & Adams, 2007). Cellular events in vascular development are regulated by molecular signal transduction pathways, which are often mediated by cell surface receptor tyrosine kinases. A key regulator is the receptor tyrosine kinase Tie2, which is expressed exclusively in hemangioblast cells and is crucial for angiogenesis and for vascular maintenance in the embryo and in the adult (Tang, Harrington, Yang, Friesel, & Liaw, 2010). Tie2 deficient mice manifest avascular malformation including a lack of proper sprouting and remodeling of the primitive vessel network (Dumont et al., 1994).
Tyrosine phosphorylation is an essential, regulated posttranslational modification utilized by multicellular organisms for cell-to-cell communication (Hubbard, 2002). Tie2/Tek receptor consisted of an extracellular ligand binding domain and an intracellular catalytic tyrosine kinase domain, followed by a carboxy-terminal tail (Shewchuk et al., 2000). The carboxy-terminal tail partially occludes the substrate tyrosine-binding site (Tachibana, Jones, Dumont, Puri, & Bernstein, 2005). Four angiopoietin ligands namely Ang1–Ang4 are capable of binding to Tie2 (Valenzuela et al., 1999). Interestingly, these ligands can regulate each other’s effect on receptor activation as Ang1 and Ang4 stimulate tyrosine phosphorylation of the receptor whereas Ang2 and Ang3 inhibit this phosphorylation (Valenzuela et al., 1999).
Autophosphorylation of the tail region exposes its phosphotyrosine residues for substrate binding (Hubbard, 2002). The cytoplasmic tail of Tie2 contains three conserved tyrosine residues (Tyr), including Tyr1106, Tyr1100, and Tyr1111, which appear to function as autophosphorylation sites for the recruitment of downstream signaling proteins (Jones et al., 2003; Sturk & Dumont, 2010). In mature endothelial cells, Tyr1106 was shown to bind to the phosphotyrosine binding domain of docking protein Dok-R (Jones et al., 2003). On the other hand, Tyr1100 binding of the p85 regulatory subunit of phosphatidylinositol 3-kinase (PI3-kinase) activated PI3-kinase and regulated endothelial cell survival and motility (Tachibana et al., 2005). Meanwhile, Shp2 binds to the receptor at Tyr1111 (Tachibana et al., 2005). As these effects were found in mature endothelial cells, the functional significance of these interactions remains in EPCs unclear. EPCs are recognized as cells with partial expression of CD133, Tie2, and VEGF receptor 2 (KDR; Niederseer et al., 2016; Siavashi, Nassiri, Rahbarghazi, Vafaei, & Sariri, 2016a). The Tie2/angiopoietin pathway plays a role in cell proliferation, migration, maturation, and vascular endothelial adherence of EPCs (Salter et al., 2009; Siavashi et al., 2016a).
The aim of this study was to evaluate the role of putative phosphorylation sites of Tie2 on the EPC development.
2 MATERIALS AND METHODS
2.1 Animals
Male, nontransgenic and GFP-positive transgenic C57BL/6 mice were used in this study. The mice were treated in accordance with the published guideline of The Care and Use of Laboratory Animals (NIH Publication, 8th edition, revised 2011). All implementation phases of this study were also approved by the Animal Care Committee of the University of Tehran.
2.2 Bone marrow EPC culture
Isolation and culture of bone marrow EPCs was performed as previously described with some modifications (Siavashi et al., 2016a). In brief, femurs of mice were flushed with phosphate-buffered saline (PBS) and filtered through sterile 200 µm meshes (Cat No: 0.075, Damavand, Tehran, Iran). Subsequently, mononuclears were harvested through centrifugation on the Ficoll (Cat No: F5415; Sigma-Aldrich, Louis, MO) gradient. Before the seeding, the total cell count was performed using a cell counter machine (Model: MEK-6450k, Nihon Kohden, Japan). Bone marrow mononuclear cells were then seeded in the fibronectin-coated (Cat No: C-43050, Promocell; Heidelberg, Germany) 24-well culture plates and incubated at 37°C, 5% CO2, and 95% relative humidity in M199 containing EGM-2 Supplement Pack (Cat No: C-39211, Promocell) composed of fetal bovine serum (FCS), vascular endothelial growth factor (VEGF), insulin-like growth factors (IGF), basic fibroblast growth factor (bFGF), hydrocortisone, ascorbic acid, heparin, and epidermal growth factor (EGF).
For distinguishing these cells from hematopoietic cells, cells were analyzed by flow cytometry using a panel of antibodies, including APC-conjugated rat antimouse CD133/AC133 (Cat No: 17–1331, eBioscience, Inc., San Diego, CA), PE-conjugated rat antimouse Tie2 (Cat No: 12–5987-81, eBioscience, Inc.), Pacific Blue-conjugated rat antimouse VEGFR2 antibodies (Cat No: 121914; Biolegend, London, UK), PE-conjugated antimouse CD45 (Cat No: 12–0451-81, eBioscience, Inc.), PE-conjugated antimouse CD14 (Cat No: 123309, Biolegend, Inc.), PE-conjugated antimouse CD11b (Cat No: 12–0112-81; eBioscience, Inc.), and PE-conjugated antimouse CD105 antibodies (Cat No: 120407, Biolegend, Inc.). Relevant isotype controls were used for flow cytometry assays. Briefly, cells were blocked with 5% Bovine serum albumin (BSA) solution at 4°C for 20 min and incubated with above-mentioned antibodies at 4°C for 30 min. Finally, the cells were washed twice with PBS and analyzed by BD FACSAria II (BD Biosciences). Data were analyzed using FlowJo v7.6.5 software. To further distinguish these cells from hematopoietic progenitor cells, 4 × 10⁴ EPCs were plated in the methylcellulose semi-solid medium containing 100 ng/ml VEGF and 5 ng/ml GM-CSF for two weeks as described previously (Siavashi et al., 2016a). The colonies were finally imaged and counted. Then, the expression of endothelial lineage markers, including VE-cadherin and vWF were also examined in cultivated cEPCs. Moreover, the growth curve of these cells was drawn after counting the viable cells at distinct time points. Also, the ability of cells for 1,1′-dioctadecyl-3,3,3′,3′-tetramethylindocarbocyanine (Dil)-labeled acetylated low-density lipoprotein (Dil-Ac-LDL) (Cat No: L-3484, Thermo fisher) uptake as well as staining with FITC-labeled Ulex europaeus agglutinin (Cat No: L2895; Sigma Aldrich) was examined.
2.3 Expression vectors and transfections
Three pcDNA3.1 + Tie2/Tek plasmids (a gift from Daniel J. Dumont, Sunnybrook and Women’s College Research Institute, Toronto, Ontario, Canada) each containing a point mutation with resultant replacement of tyrosines 1100, 1106, and 1111 with phenylalanine (Jones et al., 2003) were received on Whatman filter papers. The plasmid vectors were then recovered in the Tris-EDTA (TE) buffer for transfecting to Escherichia coli (DH10B) by CaCl2. The vectors were sequenced to verify the specific mutations before experiments.
After fibronectin expansion of bone marrow EPCs from wild type or GFP-positive C57BL/6 mice, Tie2-positive, and Tie2-negative cells were sorted by magnetic-activated cell sorting (MACS) MicroBeads as described previously (Willasch et al., 2010). In brief, EPCs pre-expanded on fibronectin were pelleted by centrifugation for 5 min, resuspended in 800 μl PBS/1% fetal bovine serum (FBS) per 1 × 10⁸ cells, and then incubated with 100 μl fragment C receptor (FCR) blocking buffer. After washing with PBS, the cells were incubated with 0.5 µg of antimouse CD202b (Tie2) Biotin (Cat No: 13–5987-81; eBioscience, Inc.), washed and incubated with streptavidin-conjugated beads (Cat No: MSPB-6003-71; eBioscience, Inc.), then washed twice with PBS/1% FBS and finally resuspended in 5 ml PBS/1% FBS. Afterwards, Tie2-positive and Tie2-negative cells were magnetically selected by autoMACS™ Separator (MiltenyiBiotec, Bergisch Gladbach, Germany). Each sorted cell population were then grown on fibronectin-coated plates in the M199 medium containing EGM-2 with 5% FBS. The medium was changed every three day. The expression vector containing Tie2 mutant complementary DNAs (cDNAs) were introduced into Tie2-negative cells with Lipofectin transfection reagent (Gibco BRL) according to the manufacturer’s instructions. The surface expression of Tie2 was then analyzed in transfected cells by flow cytometry.
2.4 Gene expression profiles of Tie2+ and Tie2− cells
Real-time quantitative polymerase chain reaction (RT-qPCR) was performed to analyze the expression of some stemness and differentiation markers, including CD133, VEGFR2, CD31, CD34, c-kit, and vWF in cultivated Tie2+ and Tie2− EPCs. Briefly, total cellular RNA was extracted from 21-day-cultured cells using an RNeasy Micro Kit (Qiagen GmbH, Hilden, Germany) according to the manufacturer’s instructions. Total RNA was then quantified by a Nanodrop ND-1000 spectrophotometer (Nanodrop Technologies, Wilmington, DE). Reverse cDNA transcription of 1 μg RNA was performed using a PrimeScript RT reagent kit (Cat. No: RT5201, Cinnagen, Tehran, Iran) according to the manufacturer’s descriptions. Quantitative RT-PCR was then run using 10 ng cDNA and 0.5 mM primers in iQ SYBR Green Supermix (Bio-Rad) in Rotor-Gene Q Real-Time PCR cycler (Qiagen). The gene expression levels were finally compared between Tie2+ and Tie2− cells via 2−∆∆CT statistical method after normalization with the housekeeping gene β-actin. Primer sequences were provided in Supporting Information Supplementary Table 1.
2.5 Immunocytochemistry
Wild type or Tie2 mutant EPCs from GFP-positive mice were subjected to immunocytochemistry assay as previously described (Siavashi et al., 2016b). In brief, cells were washed with PBS, blocked with BSA and then incubated with Anti-CD31 antibody (Cat No: ab24590; Abcam) for 2 hr at 4°C. After washing with PBS, the cells were incubated with goat antimouse IgG-Texas red (1:1000, Cat No: ab6787; Abcam, Cambridge, UK) for 1 hr at room temperature, and then washed with PBS. Finally, the cells were investigated under an inverted microscope (Olympus) and scanned by a multiple fluorescence filter as we previously described (Rahbarghazi et al., 2013) to localize the position of the GFP-positive cells and to discriminate GFP-Texas red double-positive cells.
Wild type or Tie2 mutant EPCs from GFP-mice were also analyzed for the expression level of CD31 by flow cytometry. For this purpose, the cells were stained with an antimouse CD31 antibody. A Texas-red conjugated antimouse antibody was used as the secondary antibody.
2.6 EPC colony formation assay
Wild type or Tie2 mutant EPCs were seeded on fibronectin-coated plates (5 × 10⁴ cells/well) in M199 supplemented with EGM-2 for 7 days. For each well, the total number of colonies was manually counted under a phase contrast microscope and statistically compared between groups.
2.7 In vitro tube formation assay
Matrigel tube formation assay was performed on wild type or Tie2 mutant EPCs pre-expanded on fibronectin as previously described with some modifications (Siavashi et al., 2017a; Siavashi et al., 2017b). In brief, in 96-well plates, 50 µl Matrigel (Cat No: 354230, BD, New Jersey, NJ) was coated in each well and incubated at 37°C for 30 min to allow Matrigel to solidify. 1 × 10⁴ wild type or Tie2 mutant EPCs were then seeded in each well and incubated in the EGM-2MV medium with 1% FBS at 37°C for 15–24 hr. Quantitative assessment of tubulogenesis was performed using a colony scoring system according to our previous publications (Siavashi et al., 2016a). Briefly, 25 colonies were assessed in each well and a 0–4 score was assigned to each colony as follows: 0, aggregate colony with no sprouting; 1, colony sprouting without arborization; 2, with arborization; 3, with anastomosis; and 4, development of a complex tubular network. For each well, the total score was calculated by adding all the 25 scores to attain a maximum possible score of 100. The tube length of capillary-like structures was also determined with ImageJ Ver. 1.44p (NIH).
2.8 Cell proliferation assay
To compare the proliferative potential of wild type or Tie2 mutant EPCs, cells were stained for Ki-67 (Siavashi et al., 2016a). For this purpose, cells were washed with PBS, blocked with BSA, and then incubated with anti-Ki67 antibody (Cat No: ab15580, Abcam) for 2 hr at 4°C. After washing with PBS, the cells were incubated with goat antimouse IgG-Texas red (1:1000) for 1 hr at room temperature, then washed with PBS, and counterstained with 4′,6-diamidino-2-phenylindole (DAPI). Finally, the cells were analyzed using a multiple fluorescent filter to quantify the percentage of Ki-67 positive cells.
2.9 Migration assay
For the migration assay, 24-well polycarbonate membrane cell culture plate inserts with 8-μm-pore size were used (Cat No. 35224; SPL Life Science, Naechon-Myeon, Korea). At first, wild type or Tie2 mutant EPCs were serum starved overnight. After trypsinization, 2 × 10⁴ cells were suspended in 100 μl serum-free M199 and seeded on the top chamber of the transwell inserts (triplicate for each sample). The bottom chambers contained 750 μl serum-free M199 with 50 ng/ml Ang-1 (Cat No: 130-06; Peprotech) or 50 ng/ml Ang-2 (Cat No: 130-07; Peprotech, Rocky Hill, CT). After incubation for 24 hr in a CO2 incubator, the cells migrated into the bottom chambers were stained with DAPI and counted.
2.10 Western blot analysis
Wild type or Tie2 mutant cells were examined by western blot analysis to determine the phosphorylation level of Tie2 and ERK. For this purpose, cells were lysed in a lysis buffer (50 mM Tris-HCl, 1% Triton X-100, 150 mM NaCl, 1 mM ethylene glycol tetraacetic acid, 0.25% sodium deoxycholate, and 1 mM NaF) containing 1 mM Na3VO4, 1 mM phenylmethanesulfonyl fluoride or phenylmethylsulfonyl fluoride, and protease inhibitor cocktail (Cat No:SRE0055; Sigma Aldrich). Quantitation of proteins was measured using the Bradford assay. Lysates (20 μg) were then subjected to sodium dodecyl sulfate polyacrylamide gel electrophoresis (SDS-PAGE) after a 5 min boiling and subsequently transferred to 0.2 μm immune-Blot™ polyvinyli denedifluoride membranes (Cat No: 162–017777; Bio-Rad Laboratories, CA). The membranes were then blocked with 3% non-fat dry milk (Cat No: 1.15363.0500; Merck KGaA, Darmstadt, Germany) or 5% BSA (Cat No: A-7888; Sigma Aldrich) in Tris-buffered saline containing 0.1%Tween 20 (TBST) for 1 hr. Then, the membranes were incubated with each of the primary antibodies, including anti-Tie2 (Cat No: ab24859; Abcam), anti-992-phospho-Tie2 (Cat No: ab78142; Abcam), anti-ERK (Cat No: ab54230, Abcam), anti-phospho-ERK (Cat No: ab131438, Abcam), anti-beta actin-loading control (Cat No: ab8224; Abcam) for 1 hr at room temperature, washed three times with TBST, and incubated with HRP-conjugated secondary antibodies, including sheep antirabbit IgG-HRP (1:5000, Cat No: ab6795; Abcam) or rabbit antimouse IgG-HRP (1:4000; Cat No: ab6728; Abcam) for 1 hr at room temperature. The membranes were then incubated in a solution containing 0.006% 3, 3′-diaminobenzidine (Cat No: D5637; Sigma Aldrich) to visualize immunoreactive bands. The membranes were scanned using an HP Scanjet G3110 apparatus (Hewlett-Packard Company CA). Protein expression was normalized to β-actin. Densitometry of protein bands was performed using the ImageJ Version 1.44 software (NIH). The percentage area under the curve of each band was divided by the percentage area under the curve of its corresponding actin band, and the calculated values were compared statistically between groups as described previously (Mohammadi, Nassiri, Rahbarghazi, Siavashi, & Araghi, 2015).
2.11 Matrigel implantation in mice
5 × 10⁵ Tie2+ or Tie2− mutant EPCs were added to 500 μl of overnight precooled growth factor-depleted Matrigel and mixed by gentle vortexing for homogenization. The final volume for injection was 1000 μl. The mixture was loaded in a syringe and injected subcutaneously in the flank. Before injection, mice were anesthetized with ketamin (100 mg/kg im) and xylazine (10 mg/kg im), and the left flank was shaved and disinfected by a surgical disinfectant solution.
2.12 Ultrasonography imaging
All the cases were examined using Sonosite® ultrasonography machine equipped with a multifrequency linear probe. Previously injected locations were first clipped, cleaned with alcohol, and covered with an acoustic gel. The color Doppler technique was used to find and assess the perfusion in the injected site. The vascularity of injected site was evaluated with power Doppler and then saved ultrasonograms were processed with the ImageJ® software to estimate vascular index (%) as the ratio of the vascular area to the injected area. The mean velocity of the blood supply in the injected gel was also recorded by using pulse Doppler technique.
2.13 Reconstitution assay
EPCs from transgenic GFP-positive male C57BL/6 mice were transfected with the Tie2 mutant vectors and subsequently used for the competitive bone marrow reconstitution assay as described previously (Salter et al., 2009) to analyze whether Tie2 thyrosine residues in EPCs are effective on the potency of these cells to recover the irradiated bone marrow. Inbred nontransgenic male C57BL/6 mice were used as recipients. For the competitive reconstitution, whole bone marrow was obtained from normal non-GFP C57BL/6 mice under anesthesia (ketamine (100 mg/kg im) and xylazine (10 mg/kg im)). 6 hr after the irradiation, the recipients were injected with 5 × 10⁵ GFP-positive EPCs and 5 × 10⁵ normal bone marrow cells in 100 µl PBS via the tail vein. Survival was assessed every day and mice were killed if they exhibited excessive weight loss (≥50%) by cervical dislocation under anesthesia and then subjected to flow cytometry to track the fate of transplanted cells in the bone marrow (Siavashi et al., 2016a).
Mice with noncompetitive reconstitution assay were also subjected to immunofluorescence assay as previously described (Siavashi et al., 2016a). For each animal, the femur was collected after sacrifice, snap-frozen and then 7-µm sections were prepared with MC 4000 Cryostat (Histo-Line Laboratories, Italy). The sections were thawed at room temperature, then dried for 30 min, washed twice (5 min each) with 0.1% Triton X-100 containing PBS, rinsed with PBS three times (5 min each), blocked with 1% BSA solutions for 5 min, then with 5% goat serum for 30 min, and subsequently double stained with a FITC-conjugated goat anti-GFP (1:200, Cat No: ab6662; Abcam) antibody, and an anti-CD31 antibody for 2 hr at room temperature. The sections were, thereafter, washed with PBS, incubated with goat antimouse IgG-Texas red for 1 hr at room temperature, and washed three times (5 min each) with PBS-Tween 20 (0.1%). Finally, in the double-stained sections, DAPI was used for nuclear counterstaining. The sections were analyzed under a microscope (Olympus), and scanned by multiple fluorescence filters as we previously described (Rahbarghazi et al., 2014) to distinguish true double-positive cells from cells that expressed only a single marker (GFP or Texas red). Images were finally processed by DP2-BSWsoftware Ver.2.2.
2.14 Statistical analysis
Data are expressed as mean ± standard deviation (SD). After the evaluation of the homogeneity of variance and normal distribution of data, statistical analysis was performed using one-way analysis of variance (ANOVA). Tukey test was used as post hoc. For survival analysis, Kaplan–Meier curves were generated and the log-rank test was used for comparison of the groups. Statistical analyses were carried out using GraphPadInStat software version 2.02. Values of p ≤ 0.05 were considered statistically significant. In histograms, statistical difference between groups is shown by brackets with *p < 0.05, **p < 0.01, and ***p < 0.001.
3 RESULTS
3.1 Morphological characteristics of wild type or Tie2 mutant EPCs
EPCs were expanded on fibronectin from the bone marrow mononuclears and were found to be negative for mature and immature hematopoietic markers, with partial expression of Tie2, VEGFR-2, and CD133 (Figure 1a). Moreover, seeding the cells pre-expanded on fibronectin onto the VEGF/GM-CSF containing methylcellulose-based semi-solid medium consistently resulted in the outgrowth of colony-forming units of endothelial cells (CFU-EC) with no emergence of CFU-GM (Figure 1b,c), further excluding the mixture of hematopoietic cells (Siavashi et al., 2016a). Whereas these cells were positive for endothelial lineage markers, vWF, VE-cadherin, and CD31 after 21-day culture (Figure 1e,f). We further performed a specific function test of Dil-Ac-LDL/Lectin uptake to assert the function of EPC (Figure 1g). We also drew the growth curve of expanded cEPCs, signifying that these cells were under a perpetual state of expansion under our culture conditions (Figure 1d). Tie2-positive and Tie2-negative EPCs were then separated by MACS and cultivated on fibronectin. Both exhibited cobblestone morphology at Day 5 (Figure 2a) with no discernible difference between the morphology of Tie2-positive and Tie2-negative cells. 21-day-cultured Tie2-positive and Tie2-negative cells showed comparable expression levels of stemness and differentiation markers, although the expression of endothelial differentiation markers, including CD31 and vWF was slightly greater in Tie2− cells (Supporting Information Supplementary Figure 1).
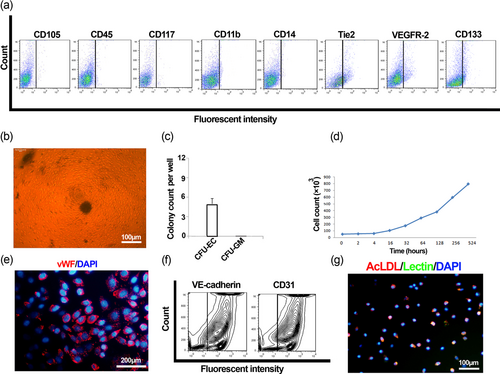
Endothelial progenitor cell characterization. Representative flow cytometry histograms of bone marrow EPCs for CD105, CD45, CD117, CD11b, CD14 Tie2, VEGFR-2, and CD133 (a). Outgrowth (b), and colony count (mean ± SD) (c) of colony-forming units of endothelial cells (CFU-EC) 14 days after seeding EPCs onto the methylcellulose semi-solid medium containing VEGF and GM-CSF. The colony is made up of spindle-shaped cells with sprouting from the cluster (b). Growth curve of bone marrow EPCs expanded on fibronectin (d). vWF immunofluorescence staining of 21-day cultured EPCs (e). Representative flow cytometry contour plots of 21-day cultured bone marrow EPCs for VE-cadherin and CD31 (f). Uptake of Dil-Ac-LDL and lectin by cultivated EPCs (g). EPCs: endothelial progenitor cells [Color figure can be viewed at wileyonlinelibrary.com]
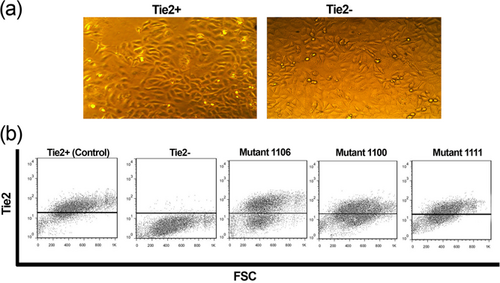
(a) Morphology of Tie2+ and Tie2− cells sorted from expanded bone marrow EPCs. (b) Flow cytometry analysis of Tie2 expression after transfection of Tie2-negative cells with Tie2 mutant vectors. EPCs: endothelial progenitor cells [Color figure can be viewed at wileyonlinelibrary.com]
To determine the impact of Tie2 thyrosine mutation on EPCs development, Tie2-negative cells were transfected with the expression vectors containing Tie2 mutant cDNAs for tyrosines 1100, 1106, or 1111. The transfection efficiency was analyzed through surface expression of Tie2 by flow cytometry (Figure 2b). Wild type Tie2-positive EPCs were used as control.
To address whether Tie2 phosphorylation residues play a role for EPC proliferation, Ki-67 staining of wild type and Tie2 mutant EPCs showed that mutation of all three C-terminal tyrosine residues of Tie2 significantly diminished the proliferative potential of EPCs (Supporting Information Supplementary Figure 2).
Next, clonogenic efficiency of wild type and Tie2 mutant EPCs was examined to recognize if distinct phosphorylation sites of Tie2 may influence the biological features of EPCs. We found that mutation of tyrosine 1106 resulted in significantly decreased colony-forming potency of EPCs (Figure 3a,b).
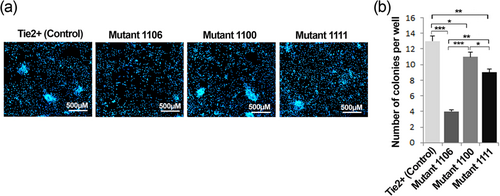
EPCs colony-forming units under Tie2 mutants. Colony formation of wild type Tie2+ and Tyr1100, Tyr1106, and Tyr1111 Tie2 mutant EPCs seeded on fibronectin-coated plate after 7 days (a) and EPC colony counts (b). Data are expressed as mean ± SD (three independent experiments were performed in triplicate). *p < 0.05, **p < 0.01, and ***p < 0.001 (one-way ANOVA with Tukey post hoc test). EPCs: endothelial progenitor cells [Color figure can be viewed at wileyonlinelibrary.com]
To assess the role of Tie2 phosphorylation residues on EPC tube formation properties, EPCs were subjected to the Matrigel tubulogenesis assay. Interestingly, we found that EPCs expressed tyrosine 1106 Tie2 mutant exhibited superior tube formation properties than EPCs expressed tyrosines1100 and 1111 Tie2 mutants. The length of tubes formed by tyrosine 1106 Tie2 mutant EPCs was found significantly increased (Figure 4a,c). Also, the mutation of Tie2 tyrosine 1106 significantly increased tubulogenesis scoring of EPCs (p < 0.001; Figure 4b). Overall, decreased clonogenic potency along with augmented angiogenic activity of the cells with Tie2 tyrosine 1106 mutation can be related to the loss of stemness, which was associated with differentiation of EPCs by the loss of tyrosine 1106. In support of this statement, we found the greatest number of CD31 positive mature cells within the EPC population possessing the tyrosine 1106 mutation compared with the other tyrosine mutations (Figures 5 and 4d).
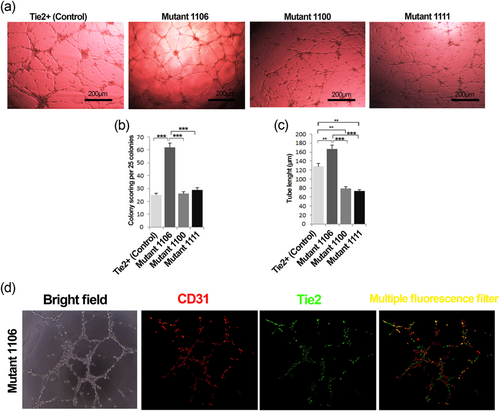
Matrigel tube formation of Tie2+ and Tyr1100, Tyr1106, and Tyr1111 Tie2 mutant EPCs. Representative tubulogenesis images of Tie2+ and Tie2 mutant EPCs (a). Colony tubulogenesis score (b) and tube length for each EPC group (c). Immunofluorescence double staining of EPCs with Tie2 Tyr1106 mutation for CD31 and Tie2 (d). Data are expressed as mean ± SD (three independent experiments were performed in triplicate). **p < 0.01 and ***p < 0.001 (one-way ANOVA with Tukey post hoc test). ANOVA: analysis of variance; EPCs: endothelial progenitor cells [Color figure can be viewed at wileyonlinelibrary.com]
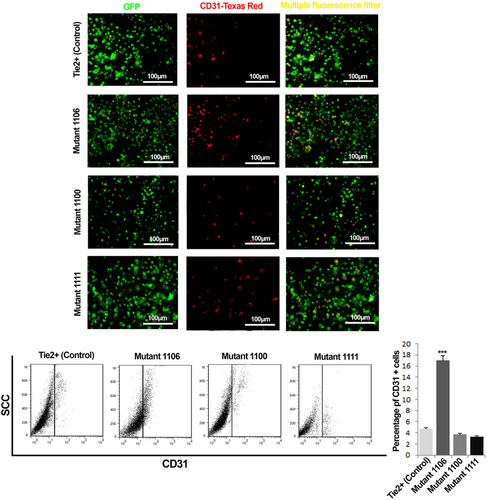
Assessment of the endothelial maturation potency of Tie2+ and Tyr1100, Tyr1106, and Tyr1111 Tie2 mutant EPCs. Representative images of CD31 staining of wild type Tie2+ and Tyr1100, Tyr1106, and Tyr1111 Tie2 mutant EPCs harvested from the bone marrow of GFP-positive mice (a). Flow cytometry analysis of CD31 expression of Tie2+ and Tie2 mutant EPCs (b). Data are expressed as mean ± SD (three independent experiments were performed in triplicate). ***p < 0.001 versus other groups. (one-way ANOVA with Tukey post hoc test). EPCs: endothelial progenitor cells [Color figure can be viewed at wileyonlinelibrary.com]
3.2 Ang-1 induced EPCs migration under tyrosine 1106 mutation
Migratory activity of wild type or Tie2 mutant EPCs toward Ang-1 and Ang-2 was analyzed via the modified Boyden chamber assay. We found that tyrosine 1106 mutation in Tie2 remarkably prompted the migration of EPCs toward Ang-1 (p < 0.001), whereas Ang-2 had an inferior effect on EPC migration (Supporting Information Supplementary Figure 3).
The EPC expression of Tie2, Tie2-pho, ERK, and ERK-pho was assessed by western blot analysis after the exposure of wild type Tie2+ or Tie2− mutant EPCs to Ang-1 (Figure 6a). We found that mutation in tyrosine 1106 resulted in significantly increased phosphorylation of Tie2 (as determined by a specific antibody against phosphorylated active site tyrosine 992) as well as downstream activation of ERK in Ang-1-treated EPCs compared with other tyrosine mutant sites and wild type Tie2 positive EPCs (Figure 6b,c).
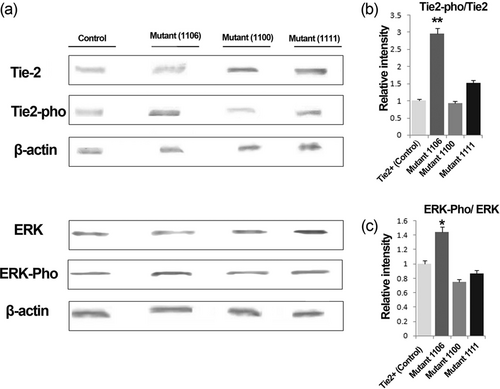
Effect of wild type Tie2+ and Tyr1100, Tyr1106, and Tyr1111 Tie2 mutant EPCs on activation of Tie2 and downstream ERK. Western blot images (a), and relative expression of Tie2-pho/Tie2 (b), and ERK-pho/ERK (c). For Tie2-pho, a specific antibody against active site tyrosine 992 was used. For densitometry, the percentage area under the curve of each protein band was divided by the percentage area under the curve of the corresponding β-actin band, and the normalized data were statistically compared between groups. Molecular weights of the immunoreactive bands are as follows: Tie2≃125, Tie2-pho≃125, ERK≃42, ERK-pho ≃42, and β-actin ≃44. Data are expressed as mean ± SD. (three independent experiments were performed in triplicate). *p < 0.05, **p < 0.01 versus other groups (one-way ANOVA with Tukey post hoc test). ANOVA: analysis of variance; EPCs: endothelial progenitor cells
3.3 In vivo angiogenesis induced by 1106 Tie2 mutant EPCs in the Matrigel plug
To assess the angiogenic potency of EPCs with or without Tie2 mutations, the in vivo Matrigel plug assay was performed by injecting Matrigel-EPCs mixtures subcutaneously into mice (Figure 7). Seven days after the injection, blood flow was detected at the peripheral aspects of Matrigel plugs (Figure 7a). Intriguingly, EPCs with tyrosine 1106 mutation had an augmentary effect on the vascular index of the Matrigel plug (Figure 7b). The mean perfusion velocity was also higher in the 1106 mutant group although it did not reach the significance level (Figure 7c). The ANOVA showed no significant difference between other Tie2 mutations and the wild type Tie2 group (Figure 7b).
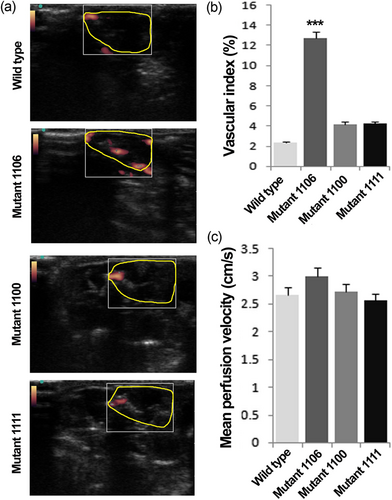
Matrigel plug assay. Representative images of vascular perfusion for wild type Tie2+ and Tyr1100, Tyr1106, and Tyr1111 Tie2 mutant EPCs after subcutaneous implantation with Matrigel (a). Yellow line in each panel indicates the outline of injected Matrigel. Vascular index (b) and mean perfusion velocity (c) in each group. Data are expressed as mean ± SD. n = 4 in each group. ***p < 0.001 versus other groups. (one-way ANOVA with Tukey post hoc test). ANOVA: analysis of variance; EPCs: endothelial progenitor cells [Color figure can be viewed at wileyonlinelibrary.com]
3.4 Effect of Tie2 mutation on the repopulating potency of EPCs after transplantation into irradiated mice
To determine the effects of Tie2 mutation on in vivo viability and reconstitution capacity of EPCs, EPCs from GFP-positive mice were expanded on fibronectin, transfected with the Tie2 mutant vectors, and transplanted into irradiated mice in a competitive manner. Our results showed that EPCs with tyrosine 1100 and 1111 mutations were enriched in the bone marrow after transplantation (Figure 8a). Meanwhile, CD31/GFP double-positive cells were readily detectable in the bone marrow of mice received intact Tie2 positive EPCs or tyrosine 1100/1111 mutant EPCs (Figure 8a), suggesting that these cells were capable of the reconstruction of the microvasculature, which was shown to be massively injured after irradiation (Siavashi et al., 2016a).
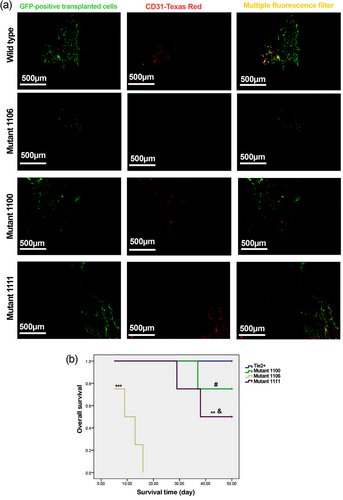
Transplantation of Tie2+ and Tyr1100, Tyr1106, and Tyr1111 Tie2 mutant GFP-positive EPCs for bone marrow reconstitution after total body irradiation. Immunofluorescence staining of the femur bone marrow for GFP and CD31 (a). Scanning via a multiple fluorescence filter showed occasional GFP/CD31 double-positive cells in the bone marrow of Tie2+, and Tie2 Tyr1100 and Tyr1111 mutant EPCs 50 days after the transplantation whereas transplanted cells were hardly detectable at the death time in the Tyr1106 Tie2 mutant EPC group. Representative images from four animals examined at each group. Kaplan–Meier survival analysis of mice transplanted with Tie2+ and Tyr1100, Tyr1106, and Tyr1111 Tie2 mutant EPCs (b). n = 4 in each group. ***p < 0.001 versus Tie2+, Tie2 Tyr1100, and Tie2 Tyr1111 mutant; **p < 0.01 versus Tie2+; &p < 0.05 versus Tie2 Tyr1100 mutant; #p < 0.05 versus Tie2+. EPCs: endothelial progenitor cells [Color figure can be viewed at wileyonlinelibrary.com]
Kaplan–Meier survival analysis revealed a significantly detrimental effect of Tie2 1106 tyrosine mutation on animal survival, indicating tyrosine 1106 is indispensable for keeping the stemness properties of EPCs for bone marrow reconstitution (Figure 8b).
4 DISCUSSION
In this study, we investigated the role of putative Tie2 tyrosine phosphorylation sites (1106, 1100, and 1111) in the development of EPCs. Our results showed that missense mutation with resultant change in tyrosine residue 1106 on the Tie2 receptor in EPCs led to activation of Tie2 signaling with subsequent increased tubulogenesis, differentiation, migration, and vascular perfusion. We also found that the stemness phenotype of bone marrow EPCs was changed by tyrosine 1106 mutation. Moreover, tyrosine 1106 mutated EPCs failed to repopulate the irradiation-ablated marrow, resulting in total animal death in contrast to mutation in tyrosines 1100 and 1111 (Supporting Information Supplementary Figure 4).
The cells expanded under our culture conditions were negative for hematopoietic markers; they were characterized as EPCs as we described previously (Siavashi et al., 2016a). Bone marrow EPCs expanded on fibronectin yielded only CFU-EC on the methylcellulose medium; further substantiating that these cells were not from hematopoietic origin (Salter et al., 2009). These cells were functionally characterized with Ac-LDL and lectin uptake (Siavashi et al., 2017a).
It has been demonstrated that the Ang1/Tie2 axis controls pericyte recruitment, endothelial cells survival, and maturation, thereby resulting in blood vessel formation and vascular stabilization (Chen, Cui, Zacharek, & Chopp, 2009). In this study, we showed the role of the cytoplasmic domain of Tie2 (Tyr1106) in differentiation of EPCs into endothelial cells. We showed an inhibitory role for tyrosine 1106 on active site of Tie2 (Tyr992). This mechanism is similar to the existence of auto-inhibitory domains in some tyrosine kinases, such as JAK2, insulin-like growth factor I receptor, c-Kit receptor, platelet-derived growth factor receptor B (PDGFRB), and Syk (Arias-Palomo, Recuero-Checa, Bustelo, & Llorca, 2009; Kelly, Buckley, Kiely, Adams, & O’Connor, 2012; Lahortiga et al., 2008; Laine, de Beauchêne, Perahia, Auclair, & Tchertanov, 2011; Lee, 2013; Matsumura, Mizuki, & Kanakura, 2008; Mizuki et al., 2003). Mutation of Tyr1106 resulted in increased phosphorylation of the active site tyrosine, leading to reduction of clonogenicity and increased differentiation of EPCs. Thus, the elevated phosphorylation of the Tie2 active site tyrosine is associated with transformation of EPC features from a stemness phenotype toward a functional differentiated phenotype. It has also been exhibited that tyrosine 1106 on Tie2 represents as an autophosphorylation site (Jones et al., 2003). It seems that the autophosphorylation of Tie2 Tyr1106 with subsequent Tie2 activation induces a downstream signaling pathway as was shown by the activation of ERK.
Our results revealed that EPC maturation after the loss of Tie2 Tyr1106 was associated with the activation of the ERK signaling pathway. Consistent with these findings, it was demonstrated that ERK signaling served as a key regulator of the endothelial differentiation of dental pulp stem cells (Bento et al., 2013).
A limitation of the current study is that we assessed three putative C-terminal tyrosine phosphorylation sites of Tie2; however, the potential role of other tyrosine sites of the Tie2 C-terminus in bone marrow EPC features remains unappreciated.
In conclusion, we found that distinct C-terminal tyrosine residues of Tie2 played a key role in the developmental dynamics of EPCs. Our results attested to the significance of tyrosine 1106 for the maintenance of stemness properties of EPCs for bone marrow reconstitution following myelosuppression, as missense mutation of its codon promoted a phenotypic switching in EPCs.
ACKNOWLEDGMENTS
We extend our appreciation to Dr. D. J. Dumont (University of Toronto) for generous providing the Tie2 plasmids. We are grateful to Dr. S. Keshavarz for technical assistance.


