Stable overexpression of p130/E2F4 affects the multipotential abilities of bone-marrow-derived mesenchymal stem cells
Abstract
Bone-marrow-derived mesenchymal stem cells (MSCs) have great potential in transplantation medicine due to their multiple advantages. However, the controlled differentiation of MSCs is one of the key aspects of effective clinical transplantation. Growing evidence suggests that the cell cycle plays an important role in regulating differentiation, while p130 and E2F4 are key to cell cycle checkpoints. The aim of the study is to evaluate the effects and mechanism of p130/E2F4 on the multidifferentiation of MSCs. Our data showed that the transduction efficiencies of p130 or E2F4 mediated by lentiviral vectors were 80.3%–84.4%. p130 and E2F4 mRNA expression was significantly higher in MSC-p130 and MSC-E2F4 cells than in MSC normal control (NC) cells. Similar results were also observed for p130 and E2F4 protein expression. After osteogenic or adipogenic differentiation, the G1 phase was significantly delayed in the MSC-p130 and MSC-E2F4 groups compared with that in the MSC-NC group. However, the G1 phase in the MSC-p130 and MSC-E2F4 groups did the opposite after chondrogenic differentiation. Moreover, overexpressing p130 or E2F4 significantly improved osteogenic differentiation while inhibiting adipogenic and chondrogenic differentiation of mouse MSCs (mMSCs). Moreover, overexpressing p130 or E2F4 significantly improved migration but not proliferation of mMSCs. Our data suggest that cell cycle regulation may be involved in p130/E2F4-mediated changes in the multipotential abilities of bone-marrow-derived mMSCs.
Abbreviations
-
- ALP
-
- alkaline phosphatase
-
- BSD
-
- blasticidin
-
- CCK-8
-
- cell counting Kit-8
-
- CDKs
-
- cyclin-dependent kinases
-
- FACS
-
- fluorescence-activated cell sorting
-
- FCM
-
- flow cytometry analysis
-
- GFP
-
- green fluorescent protein
-
- mMSC
-
- mouse mesenchymal stem cells
-
- MIF
-
- migration inhibitory factor
-
- pRb
-
- retinoblastoma gene product
-
- qRT-PCR
-
- quantitative real-time polymerase chain reaction
-
- Rb
-
- retinoblastoma
1 INTRODUCTION
Growing evidence suggests that stem-cell-based therapy holds substantial therapeutic promise for transplantation medicine (Matthay et al., 2010; Walter, Ware, & Matthay, 2014). Among stem cells, bone-marrow-derived mesenchymal stem cells have great potential in transplantation medicine due to their relative ease of isolation, self-renewal potential, lack of immunogenicity, migration ability to specific organs and multipotential differentiation (Cai et al., 2014). However, the controlled differentiation of mesenchymal stem cells (MSCs) is one of the key aspects of effective clinical transplantation, in addition to their proliferation and migration (Uccelli, Moretta, & Pistoia, 2008). Over the last decade, much research has been carried out on the role of the microenvironment, materials, genes and biofactors in guiding differentiation, while great interest has been shown in regulating the controlled differentiation of MSCs (Haugh & Heilshorn, 2016).
A previous study by our group showed that β-catenin and ROR2 gene modification mediated by lentiviral vectors achieves effective and stable Wnt signaling pathway regulation and further influences the differentiation, proliferation, and migration of mouse MSCs (mMSCs) in vitro (Cai et al., 2014). However, the mechanism by which this occurs is still not known. The differentiation of cells depends on efficient cell cycle control, and the checkpoints that regulate cell cycle progression and cell differentiation in the majority of cell lines occur at the G1/G0 phase. p130, as a member of the retinoblastoma gene product (pRb) family, controls the exit from the G1 phase (Fiorentino, Symonds, Macaluso, & Giordano, 2009). p130 forms a repressor complex with transcription factor E2F4, which is a key determinant of cell proliferation in response to extra- and intracellular signals (Mushtaq, Gaza, & Kashuba, 2016). E2F4 is a transcriptional repressor whose activity is critical for the engagement and maintenance of cell cycle arrest in G0/G1 in conjunction with members of the retinoblastoma (Rb) family (Hsu & Sage, 2016). Thus, p130 and E2F4 are the key elements in the regulation of stem-cell cycle and differentiation. To date, the effects and mechanisms regulating multidifferentiation of MSCs by p130/E2F4 have been unclear.
It is hypothesized that directional differentiation could be modulated by regulating transcription factors p130 or E2F4 in mMSCs, and the mechanisms are mainly related to cell cycle regulation. Therefore, we constructed MSCs with permanent and stable overexpression of p130/E2F4 in vitro. The goal of this study is to evaluate the effects and mechanisms of p130/E2F4 on the multidifferentiation of MSCs.
2 MATERIALS AND METHODS
2.1 Cell culture
mMSCs isolated from the bone marrow of C57BL/6 mice were purchased from Cyagen Biosciences, Inc. (Guangzhou, China), and 293 T cells were supplied by Zoonbio Biotechnology Co., Ltd. (Nanjing, China). The supplier identified mMSCs according to cell surface phenotypes by the following markers: CD34+, CD44+, CD29+, SCA-1+, and CD117−, characterized by fluorescence-activated cell sorting (FACS) analysis, which has been described by Liu et al., (2013). The multipotency for differentiation into the adipogenic, osteogenic, and chondrogenic lineages is described later in this section.
Either mMSCs or 293 T cells were cultured in a 1:1 mix of Dulbecco’s modified Eagle’s medium/nutrient mixture F-12 (DMEM/F12; Wisent, Inc., St-Bruno, Montreal, Canada) containing 10% FBS (Wisent, Inc.) and 1% antibiotic-antimycotic (streptomycin, penicillin and amphotericin B; Wisent, Inc.) and incubated at 37°C in a humidified atmosphere of 5% CO2.
2.2 Recombinant lentivirus vector construction and package
The full-length coding sequences of p130 (NM_178690.4, 2946 bp) and E2F4 (NM_148952.1, 1233 bp) were transferred into cytomegalovirus (CMV)-promoter-dependent lentivirus vector PDS087_pL6-TO-V5-GIM (Zoonbio Biotechnology Co., Ltd.; Tarantal et al., 2005). Subsequently, the lentivectors CMV-eGFP_IRES-p130 (overexpressing p130) and CMV-eGFP_IRES-E2F4 (overexpressing E2F4) were obtained, and the empty vector CMV-eGFP_IRES was used as an empty vector control. Then, the recombinant plasmids CMV-eGFP_IRES, CMV-eGFP_IRES-p130, and CMV-eGFP_IRES-E2F4 were separately cotransfected with packaging plasmids PDS042-PMD2G and PDS041-PSPAX2 into 293 T cells at the indicated concentrations using Lipofectamine 2000 (Invitrogen Life Technologies) according to the manufacturer’s instructions.
2.3 Lentiviral vector transduction and eGFP reporter gene detection
The mMSCs (1 × 10⁶ per well) were seeded in six-well cell culture plates and cultured for 24 hr. The lentiviral vectors were then added to the wells at a multiplicity of infection value of 320:1. After 24 hr of coculture with mMSCs, the stable cell lines were selected with 6 μg/ml blasticidin (BSD; InvivoGen). The BSD-resistant mMSCs were then collected and cultured in normal culture media for 20 passages after transduction. Finally, the long-term transfection efficiency of mMSCs and the percentage of green fluorescent protein (eGFP) positive cells were evaluated by fluorescence microscopy and flow cytometry (FCM) analysis using a FACSCalibur flow cytometer (Becton-Dickinson, Franklin Lakes, NJ).
2.4 RNA isolation and quantitative real-time polymerase chain reaction
Total RNA was isolated from the cells using TRIzol reagent (Invitrogen, Austin, TX) according to the manufacturer’s protocol, and the purity of the RNA (260/280 nm absorbance ratio of 1.8–2.2) was assessed by a spectrophotometer (Tecan, Switzerland). Reverse transcription was completed using the RevertAid First Strand cDNA Synthesis Kit (Thermo Scientific) with 1 mg of RNA according to the manufacturer's instructions. The quantitative real-time polymerase chain reaction (qRT-PCR) reaction was performed by a CFX96TM Real-Time system (Bio-Rad). Relative changes in gene expression were normalized to the expression of actin and calculated by the 2-ΔΔCT method. The primer sequences used for PCR amplification in our study were designed based on the sequences of the genomic clones and are as follows:
| Gene | Primer | Primer sequence | PCR amplified products (bp) |
|---|---|---|---|
| Actin | Forward | 5′-ATGTGGATCAGCAAGCAGGA-3′ | 99 |
| Reverse | 5′-AAGGGTGTAAAACGCAGCTCA-3′ | ||
| p130 | Forward | 5′-GTGTGAGCACGAGGAGGAAA-3′ | 142 |
| Reverse | 5′-AGCCCGCTGAGCATTCAC-3′ | ||
| E2F4 | Forward | 5′-ATTGCAGTGAGTGGTAGCCC-3′ | 269 |
| Reverse | 5′-TCTCTCGTGGGGTCGAAGAT-3′ | ||
| OSX | Forward | 5′-GGAAAGGAGGCACAAAGA-3′ | 161 |
| Reverse | 5′-AGGGAAGGGTGGGTAGTC-3′ | ||
| Runx2 | Forward | 5′-ACCAGCCTCACCATACA-3′ | 146 |
| Reverse | 5′-TACTGACATCAGCTACCG-3′ | ||
| PPAR-γ | Forward | 5′-GATGGAAGACCACTCGC-3′ | 273 |
| Reverse | 5′-CCACAGACTCGGCACTC-3′ | ||
| C/EBPα | Forward | 5′-GGCTCCTAATCCCTTGC-3′ | 245 |
| Reverse | 5′-GGCTGGCGACATACAGT-3′ | ||
| Sox9 | Forward | 5′-AGAAAGACCACCCCGATTA-3′ | 122 |
| Reverse | 5′-CGCCTTGAAGATAGCATTAG-3′ | ||
| Col2α1 | Forward | 5′-CCCAACACCGCTAACGTC-3′ | 244 |
| Reverse | 5′-CGGTCTTGCCCCACTTAC-3′ |
2.5 Western blotting analysis
Total cellular protein was extracted by radioimmunoprecipitation assay (RIPA) lysis buffer (Beyotime Institute of Biotechnology, Haimen, China) containing an antiprotease cocktail (1 mmol/L PMSF, 1 mmol/L NaF, and 1 mmol/L Na3VO4; US Biological Inc., Swampscott, MA) according to the manufacturer's instructions, separated by sodium dodecyl sulfate polyacrylamide gel electrophoresis (10%), electrotransferred to polyvinylidene difluoride (PVDF) membranes (Millipore, Bedford, MA) and then incubated with primary antibodies against p130 (1:1000 dilution; Abcam Incorporated, Cambridge, MA), E2F4 (1:500 dilution; Proteintech), OSX (1:1000 dilution; Abcam Incorporated), Runx2 (1:1000 dilution; Abcam Incorporated), PPAR-γ (1:1000 dilution; Abcam Incorporated), C/EBPα (1:1000 dilution; Abcam Incorporated), Sox9 (1:1000 dilution; Abcam Incorporated), Col2α1 (1:200 dilution; Santa Cruz Biotechnology, Inc., Dallas, TX), or β-actin (1:3000 dilution; Abcam Incorporated) at 4℃ overnight. The blots were washed three times with tris buffered saline Tween 20 (TBST) and then incubated with goat anti-rabbit or goat anti-mouse IgG conjugated with horseradish peroxidase (1:5000 dilution; Zoonbio Biotechnology) for 1 hr at room temperature. Immunoreactive complexes were visualized by chemiluminescence reagents (Thermo Fisher Scientific Inc., Waltham, MA).
2.6 Osteogenic differentiation and alkaline phosphatase activity determination
For osteogenic differentiation, the cells were seeded in six-well plates and cultured in 2 ml of DMEM/F12 supplemented with 10% FBS. After reaching approximately 80%–90% confluence, the cells were switched to C57BL/6 mMSC osteogenic differentiation medium (Cyagen Biosciences, Inc.) for 2–3 weeks. The calcium deposition was assessed by staining the cells with 40 mM Alizarin red S solution at room temperature for 10 min, and the Alizarin red S concentrations were determined by a quantitative destaining procedure by 10% cetylpyridinium chloride for 15 min at room temperature. Then, the absorbance value at 490 nm was measured.
Alkaline phosphatase (ALP) activity in the cells was determined using an Alkaline Phosphatase Assay Kit (Beyotime Institute of Biotechnology) according to the manufacturer’s instructions; this assay is based on the conversion of colorless p-nitrophenyl phosphate to colored p-nitrophenol after coincubation for 10 min at 37°C. Finally, the ALP activity was determined at a wavelength of 405 nm. Production of 1 μmol p-nitrophenol at 37°C per minute was designated as 1 unit (U; Cai et al., 2014).
2.7 Adipogenic differentiation
For adipocytic differentiation, the cells were seeded in six-well plates. After reaching confluence, the cells were treated with mMSC adipogenic differentiation basal medium A (Cyagen Biosciences Inc.) for 3 days, which was then exchanged with mMSC adipogenic differentiation basal medium B (Cyagen Biosciences Inc.) for 24 hr and then switched back to basal medium A. After five to six cycles, the cells were cultured in basal medium B for 3 days until lipid vacuoles were enlarged. To assess the accumulation of neutral lipid vacuoles, the cells were stained with filtered oil red O solution for 10 min at room temperature, and the incorporated oil red O was extracted by adding 1 ml of isopropanol to each well at room temperature for 15 min. The absorbance value at 490 nm was then measured.
2.8 Chondrogenic differentiation
For chondrogenic differentiation, 2.5 × 10⁵ cells were centrifuged in a 15 ml tube at 150g for 5 min to form a pellet. Chondrogenic differentiation was processed by the three-dimensional culture method and C57BL/6 mMSC chondrogenic differentiation medium (Cyagen Biosciences, Inc.). After 28 days, the pellets were embedded in paraffin and then fixed in dimethylbenzene and ethanol. Five-micrometer slides were cut and stained with alcian blue to determine polysaccharide amine combination.
2.9 Cell cycle analysis
For cell cycle analysis, the cells were centrifuged at 1500 rpm and washed twice with ice-cold phosphate buffered saline (PBS). Cells were fixed with 70% ethanol and incubated at 4°C for 30 min. After fixation, cells were incubated with RNase A (20 μg/ml) for 30 min (37°C) and stained with propidium iodide (50 μg/ml; BD Bioscience, San Diego, CA) for 30 min in the absence of light. Then, samples were acquired by BD FACS flow cytometer (Capasso et al., 2014).
2.10 Cell proliferation assay
To further investigate the effects of overexpressing p130 or E2F4 on mMSC proliferation, the Cell Counting Kit-8 (CCK-8; Beyotime Institute of Biotechnology) assay was used according to the manufacturer’s instructions. Briefly, cells were seeded in 96-well plates at 2 × 10³ cells per well in 100 μl of growth medium. After staining with CCK-8 (10 μl per well), the cells were incubated for 4 hr at 37°C. Absorbance was assessed at 450 nm with a microplate reader (Tecan).
2.11 In vitro scratch assay
In vitro scratch assays were used to further investigate the effects of overexpressing p130 or E2F4 on the horizontal migration of mMSCs. Cells were seeded in six-well culture plates. After reaching approximately 100% confluence, a scratch was made with a 10 μl sterile pipette tip. Then, the cells were cultured in serum-free DMEM/F12 for another 12 hr. The images of the wound area were recorded by a light microscope immediately after scratching and 12 hr later. The horizontal migration ability of the cells was quantified by measuring the wound area in each group using ImageJ analysis software (Liang, Park, & Guan, 2007).
2.12 Transwell migration assay
A transwell migration assay was used to further investigate the effects of overexpressing p130 or E2F4 on the vertical migration of mMSCs. Transwell inserts (6.5 mm diameter and 8 mm pore size; Millipore, Billerica, MA) that were seeded with 2 × 10⁴ cells in 100 μl of serum-free DMEM/F12 were loaded into lower chambers containing 600 μl of DMEM/F12 supplemented with 10% fetal bovine serum (FBS). After incubation for 12 hr, the cells remaining on the upper surface of the inserts were removed with cotton swabs, and the cells that had migrated to the lower surface were stained with crystal violet (Beyotime Institute of Biotechnology) for 20 min. The stained cells from four randomly chosen areas were measured under a light microscope (Cai et al., 2014).
2.13 Statistical analysis
The data were presented as the means ± standard deviation. Statistical analyses were performed by SPSS 22.0 and GraphPad Prism 6. Comparisons among multiple groups were performed by one-way analysis of variance followed by Bonferroni’s post hoc test. A p < 0.05 was considered to be statistically significant.
3 RESULTS
3.1 The efficiency of lentiviral-vector-mediated p130 or E2F4 overexpression in mMSCs
Transduction efficiency of the target gene in mMSCs was reflected by the eGFP-positive cell ratio in our study. The transduction efficiencies mediated by the lentiviral vectors after 20 passages were detected by fluorescence microscopy and FCM analysis. It was found that the transduction efficiencies of overexpressing p130 or E2F4 were 80.3%–81.1% (Figure 1a). The p130 or E2F4 mRNA levels in mMSCs were detected by qRT-PCR. The results showed that p130 or E2F4 mRNA expression was significantly higher in the MSC-p130 (overexpressing p130) or MSC-E2F4 (overexpression E2F4) group than in the MSC normal control (MSC-NC) group (p < 0.05). However, there was no significant difference between the MSC and MSC-NC group (p > 0.05; Figure 1b,d). Western blotting analysis also showed similar results for p130 or E2F4 protein expression in mMSCs (Figure 1c,e). Thus, lentivirus-mediated p130 or E2F4 transduction is stable and efficient.
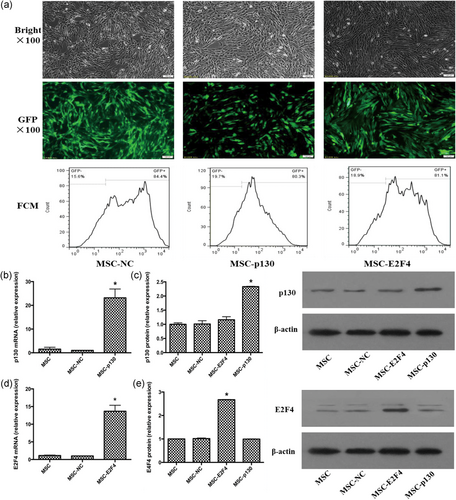
Measurement of p130 and E2F4 expression in mMSCs after lentiviral vector transduction. (a) The MSC-NC, MSC-p130, and MSC-E2F4 were cultured for 20 passages and observed with light microscopy (top) and fluorescence microscopy with green fluorescent protein (middle), 100×; the percentage of GFP-positive cells was analyzed by flow cytometry (bottom) at passage 20 after transduction. (b) Evaluation of p130 mRNA expression in mMSCs after transfection (n = 3; *p < 0.05 vs. MSC-NC). (c) Detection of p130 protein levels in mMSCs after transfection by Western blot analysis (n = 3; *p < 0.05 vs. MSC-NC). (d) Evaluation of E2F4 mRNA expression in mMSCs after transfection (n = 3; *p < .05 vs. MSC-NC). (e) Detection of E2F4 protein levels in mMSCs after transfection by Western blot analysis (n = 3; *p < 0.05 vs. MSC-NC). FCM: flow cytometry; GFP: green fluorescent protein; mRNA: messenger RNA; mMSC: mouse mesenchymal stem cells; MSC: mesenchymal stem cells; NC: normal control [Color figure can be viewed at wileyonlinelibrary.com]
3.2 Cell division cycle of mMSCs overexpressing p130 or E2F4 before and after induced differentiation
To investigate the phasic changes of mMSCs overexpressing p130 or E2F4, the cell cycle was analyzed by FCM analysis both after transduction and at the end of osteoblast, lipoblast, and chondroblast differentiation.
As shown in Figure 2a, there were no significant changes in any cell cycle phase among the MSC, MSC-NC, MSC-p130, and MSC-E2F4 groups before induced differentiation (p > 0.05).
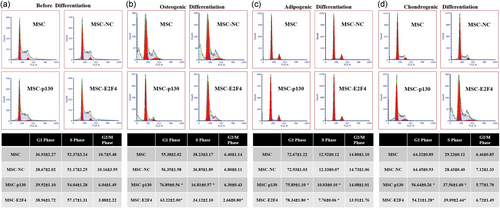
The effects of overexpressing p130 or E2F4 on the cell division cycle before and after induced differentiation of mMSCs, as shown by flow cytometry analysis. (a) The table shows the percentage of cell cycle phases in different mMSC groups (n = 3). (b) The table shows the percentage of osteogenesis in different mMSC cell cycle phases (n = 3; *p < 0.05 vs. MSC-NC). (c) The table shows the percentage of adipogenesis in different mMSC cell cycle phases (n = 3; *p < 0.05 vs. MSC-NC). (d) The table shows the percentage of chondrogenesis in different mMSC cell cycle phases (n = 3; *p < 0.05 vs. MSC-NC). A representative flow cytometry analysis is shown for each experimental condition. mMSC: mouse mesenchymal stem cells; MSC: mesenchymal stem cells; NC: normal control [Color figure can be viewed at wileyonlinelibrary.com]
At 21 day post-induction of osteogenic differentiation, the percentage of cells in the G1 phase in the MSC-p130 group was 76.89 ± 0.56, significantly higher than that in the MSC-NC group (p < 0.05), while fewer MSC-p130 group than MSC-NC group cells were in the S phase (p < 0.05). However, a significantly higher percentage of cells was in the G1 phase in the MSC-E2F4 group (p < 0.05), but fewer cells were in the G2/M phase than in the MSC-NC group (p < 0.05; Figure 2b).
Twenty-eight days post-induction of adipogenic differentiation, the percentage of G1 phase cells was significantly higher in the MSC-p130 group than in the MSC-NC group (p < 0.05), while the percentage of cells in the S phase decreased significantly (p < 0.05). We detected more cells in the G1 phase but fewer cells in the S phase in the MSC-E2F4 group than in the MSC-NC group (p < 0.05; Figure 2c).
Twenty-eight days post-induction of chondrogenic differentiation, fewer cells in the G1 phase but more cells in the S phase were detected in the MSC-p130 group compared with the MSC-NC group (p < 0.05). In the MSC-E2F4 group, similar effects were also observed in the G1 and S phases (Figure 2d).
3.3 The effects of overexpressing p130 or E2F4 on the osteogenic differentiation of mMSCs
In this study, calcium deposition examined by Alizarin red S staining, ALP activity and the detection of osteogenic gene OSX and Runx2 mRNA and protein were used to evaluate the role of p130 or E2F4 overexpression on the osteogenic differentiation of mMSCs. The results showed that overexpression of either p130 (MSC-p130) or E2F4 (MSC-E2F4) promoted the osteogenic differentiation of mMSCs as mirrored by increased calcium deposition, ALP activity, and OSX and Runx2 gene and protein expression in mMSCs compared with the MSC-NC group (p < 0.05). No significant difference between the MSC and MSC-NC groups was observed (Figure 3). These results suggest that overexpressing p130 or E2F4 in mMSCs had a positive effect on osteogenic differentiation.
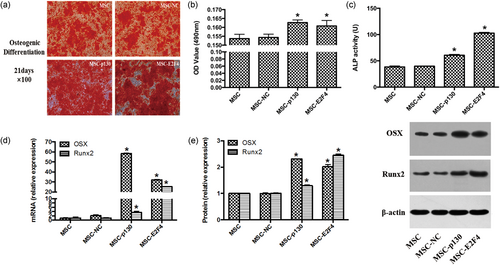
The effects of overexpressing p130 or E2F4 on the osteogenic differentiation of mMSCs. (a) The cells were stained with Alizarin red S at Day 21 to detect calcium deposition, 100×. (b) Alizarin red S concentrations were determined by a quantitative destaining procedure using CPC, and the absorbance value at 490 nm was measured (n = 9; *p < 0.05 vs. MSC-NC). (c) The ALP activity was assessed by conversion of colorless p-nitrophenyl phosphate (pNPP) to colored p-nitrophenol after coincubation and determined at the wavelength of 405 nm. Production of 1 μmol p-nitrophenol at 37°C per minute was designated 1 unit (U) (n = 3; *p < 0.05 vs. MSC-NC). (d) Osteogenic-specific gene OSX and Runx2 mRNA expressions were detected by qRT-PCR (n = 3; *p < 0.05 vs. MSC-NC). (e) Osteogenic-specific OSX and Runx2 protein expressions were detected by Western blotting (n = 3; *p < 0.05 vs. MSC-NC). ALP: alkaline phosphatase; CPC: cetylpyridinium chloride; mMSC: mouse mesenchymal stem cells; MSC: mesenchymal stem cells; NC: normal control; qRT-PCR: quantitative real-time polymerase chain reaction [Color figure can be viewed at wileyonlinelibrary.com]
3.4 The effects of overexpressing p130 or E2F4 on the adipogenic differentiation of mMSCs
To evaluate the effects of mMSCs with p130 or E2F4 gene overexpression on adipogenic differentiation, we measured lipid accumulation, as examined by Oil red O staining experiments, and the adipogenic gene and protein expression of peroxisome proliferator-activated receptor gamma (PPAR-γ) and CCAAT/enhancer-binding protein alpha (C/EBPα), as measured by qRT-PCR and Western blotting, respectively. Overexpression of either p130 (MSC-p130) or E2F4 (MSC-E2F4) inhibited the adipogenic differentiation of mMSCs, as shown by reduced accumulation of neutral lipid vacuoles and both gene and protein expression of PPAR-γ and C/EBPα, in mMSCs compared with the MSC-NC group (p < 0.05). However, there was no significant difference between the MSC and MSC-NC groups (Figure 4). This finding indicated that overexpressing p130 or E2F4 may suppress the adipogenic differentiation of mMSCs.
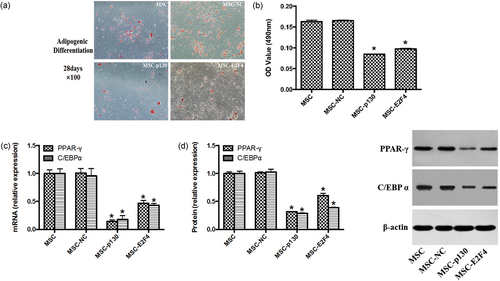
The effects of overexpressing p130 or E2F4 on the adipogenic differentiation of mMSCs. (a) The cells were stained with Oil red O after 28 days of adipogenic differentiation to detect the accumulation of neutral lipid vacuoles, 100×. (b) The incorporated Oil red O was extracted with isopropanol, and the absorbance value at 490 nm was then measured (n = 9; *p < 0.05 vs. MSC-NC). (c) Adipogenic-specific gene PPAR-γ and C/EBPα mRNA expressions were detected by qRT-PCR (n = 3; *p < 0.05 vs. MSC-NC). (d) Adipogenic-specific PPAR-γ and C/EBPα protein expressions were detected by Western blotting (n = 3; *p < 0.05 vs. MSC-NC). C/EBPα: XXX; mMSC: mouse mesenchymal stem cells; MSC: mesenchymal stem cells; NC: normal control; PPAR-γ: XXX; qRT-PCR: quantitative real-time polymerase chain reaction [Color figure can be viewed at wileyonlinelibrary.com]
3.5 The effects of overexpressing p130 or E2F4 on the chondrogenic differentiation of mMSCs
To investigate the effect of p130 or E2F4 overexpression in mMSCs on chondrogenic differentiation, we observed polysaccharide amine combination by alcian blue staining and the chondrogenic gene and protein expression of Sox9 and Col2α1 by qRT-PCR and Western blotting, respectively. As Figure 5 shows, overexpression of either p130 (MSC-p130) or E2F4 (MSC-E2F4) inhibited the chondrogenic differentiation of mMSCs, as reflected by decreased polysaccharide amine combination and both gene and protein expression of Sox9 and Col2α1 in mMSCs compared with the MSC-NC group (p < 0.05). However, no significant difference was observed between the MSC and MSC-NC groups. The results confirm an inhibitory effect on chondrogenic differentiation of mMSCs overexpressing p130 or E2F4.
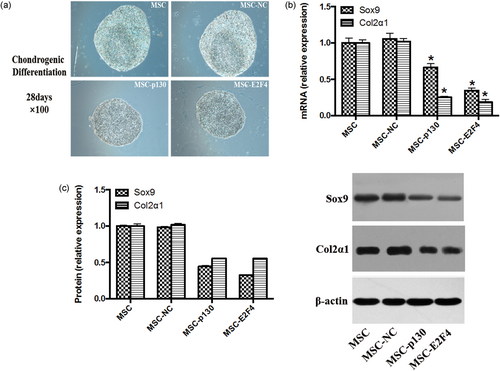
The effects of overexpressing p130 or E2F4 on the chondrogenic differentiation of mMSCs. (a) The cells were stained with Alcian Blue after 28 days of chondrogenic differentiation with three-dimensional culture method to detect polysaccharide amine combination, 100×. (b) Chondrogenic-specific gene Sox9 and Col2α1 mRNA expression was detected by qRT-PCR (n = 3; *p < 0.05 vs. MSC-NC). (c) Chondrogenic-specific protein Sox9 and Col2α1 expressions were detected by Western blotting (n = 3; *p < 0.05 vs. MSC-NC). mMSC: mouse mesenchymal stem cells; MSC: mesenchymal stem cells; NC: normal control; qRT-PCR: quantitative real-time polymerase chain reaction [Color figure can be viewed at wileyonlinelibrary.com]
3.6 The effects of overexpressing p130 or E2F4 on the proliferation of mMSCs
A CCK-8 assay was used to evaluate the effects of overexpressing p130 or E2F4 on cell proliferation. By comparing the growth curves of different cells, it was found that overexpression of p130 or E2F4 had no significant effects on cell proliferation compared with the MSC-NC group from days 1 to 7. There was also no significant difference between the MSC and MSC-NC groups (Figure 6).
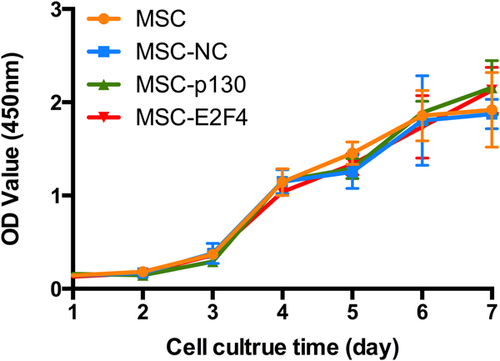
The effects of overexpressing p130 or E2F4 on the proliferation of mMSCs. The growth curves of the cells after transduction for days were evaluated by CCK-8 assay (n = 3). CCK-8: cell counting kit-8; mMSC: mouse mesenchymal stem cells; MSC: mesenchymal stem cells; NC: normal control [Color figure can be viewed at wileyonlinelibrary.com]
3.7 The effects of overexpressing p130 or E2F4 on the migration of mMSCs
The scratch assay and transwell assay were used to indicate the horizontal and vertical migration abilities of mMSCs. The wound area in the scratch assay decreased in the MSC-p130 and MSC-E2F4 groups compared with the MSC-NC group (p < 0.05) after 12 hr of incubation. No significant difference between the MSC and MSC-NC groups was observed (Figure 7a).
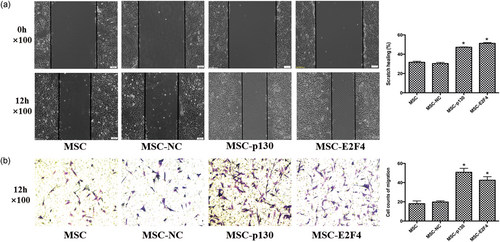
The effects of overexpressing p130 or E2F4 on the migration of mMSCs. (a) The horizontal migration ability of mMSCs after transduction was examined by in vitro scratch assay. The wound areas were photographed at 0 and 12 hr and quantified by measuring the wound area in each group, 100× (n = 3; *p < 0.05 vs. MSC-NC). (b) The vertical migration ability of mMSCs after transduction was examined by transwell assay. The migrated cells on the lower surface of transwell inserts were stained with crystal violet and measured under a light microscope form four randomly chosen areas, 100× (n = 4; *p < 0.05 vs. MSC-NC). mMSC: mouse mesenchymal stem cells; MSC: mesenchymal stem cells; NC: normal control [Color figure can be viewed at wileyonlinelibrary.com]
Similar results were also detected in the transwell assay. More cells migrated in the MSC-p130 and MSC-E2F4 groups than in the MSC-NC group (p < 0.05), while there was no significant difference between the MSC and MSC-NC groups (Figure 7b).
4 DISCUSSION
Despite the growing body of data demonstrating that MSCs provide a potential therapeutic method for a variety of clinical domains, the encouraging preclinical findings of in vivo research do not guarantee efficacy in clinical trials (Walter,Ware & Matthay, 2014). The therapeutic efficiency of MSCs depends on migration, proliferation and especially the controlled differentiation of MSCs. In the present study, the major findings were as follows: (a) mMSCs overexpressing p130 or E2F4 can significantly improve the efficiency of their osteogenic differentiation while inhibiting adipogenic and chondrogenic differentiation efficiency. (b) The potential mechanism by which mMSCs overexpressing p130 or E2F4 change the multipotential differentiation may be associated with the phasic changes of the G1 phase. (c) Overexpressing p130 or E2F4 can significantly improve the migration but not the proliferation of mMSCs.
p130, also named Rbl2, belongs to the Rb family, which is characterized by a pocket domain involved in protein–protein interactions. Unlike other Rb family member proteins, p130 is active in G0-arrested cells, where it forms a complex with E2F4. This complex binds DNA and modulates E2F target genes. In response to mitogenic stimuli, p130 is inactivated by cyclin-dependent kinases (CDKs; Rayman et al., 2002; Takahashi, Rayman, & Dynlacht, 2000). This allows E2F factors to activate S-phase gene transcription, allowing the cell cycle to proceed. In contrast, under cellular stresses such as DNA damage, CDKs are inhibited by CDK inhibitors, and p130 remains active. Thus, cell cycle progression is arrested and cells are driven to enter the G0 phase (Dimova & Dyson, 2005; Weinberg, 1995). Therefore, there are now suggestions for a role of p130 during the initiation, or triggering, of the differentiation process.
E2F4, a member of the E2F transcription factor family, associates with all three Rb family proteins, including p130, under physiological conditions. Potential mechanisms of action of E2F4 in stem cells have been reported by Hsu and Sage, 2016, which are as follows: First, E2F4 may regulate developmental genes to establish cell fate during differentiation, either as a repressor in conjunction with Rb to prevent the expression of aberrant transcripts or as an activator to directly drive cellular differentiation. E2F4 can play a role as a repressor that blocks the expression of aberrant transcripts when binding with Rb or as an activator that directly drives cell differentiation, regulating the developmental genes to establish cell fate during differentiation. Second, E2F4 may inhibit genes relating to G2/M progression and DNA damage repair due to its utilization in G2 arrest in response to cell stress, resulting from a lack of the G1/S checkpoint in rapidly cycling cells. Third, to support higher metabolic needs, E2F4 may turn from a repressor of cell cycle genes into an activator. In conclusion, all of the above may involve Rb family or non-Rb family cofactors, facilitating E2F4 to translocate into the nucleus, bind to target genes and make a difference.
p130 and E2F4 can significantly improve the directional differentiation potential of MSCs by affecting the cell cycle. In this study, we constructed mMSC cell lines stably expressing p130 or E2F4 for the first time and found that they had a significant effect on the directional differentiation of mMSCs in different induction environments. The results showed that high expression of p130 or E2F4 significantly improved osteogenic differentiation of mMSCs. In a preliminary study by our research group, Cai et al., (2014) also found that β-catenin or ROR2 gene overexpression promoted mMSC differentiation into osteoblasts. Meanwhile, Wnt/β-catenin and pRb signaling pathways interact with each other and form a common p130/Gsk3b/ β-catenin complex during MSC cycle progression (Petrov, Zhidkova, Serikov, Zenin, & Popov, 2012). Therefore, this study suggests that the Wnt pathway may regulate MSC differentiation by regulating p130 and E2F4 in the nucleus. Moreover, overexpressing p130 or E2F4 may inhibit adipogenic differentiation of mMSCs. Capasso et al., (2014) showed that inhibiting p130 can significantly increase adipogenic differentiation of MSCs, the mechanism of which is related to cell cycle regulation. mMSCs with high expression of p130 or E2F4 can also inhibit chondrogenic differentiation, which is first reported here. This may be related to the relatively limited detection methods for chondrogenic differentiation.
p130 and E2F4 may have effects on cell proliferation. However, the present study showed that overexpressing p130 or E2F4 did not influence the proliferation of mMSCs. A previous study has proved that high-grade tumors presented a significantly lower number of cells expressing pRb2/p130 (Sanseverino et al., 2006). Claudio et al., (2000) also reported that retrovirus-mediated delivery of wild-type RB2/p130 to the lung tumor cell line H23 potently inhibited tumorigenesis in vitro and in vivo. Although E2F4 is categorized as a major repressor of cell cycle progression, loss of E2F4 in the cycling actually decreases proliferation and DNA replication. Furthermore, knockdown of E2F4 in human intestinal epithelial cells leads to decreased proliferation and a downregulation of direct E2F targets (Deschênes, Alvarez, Lizotte, Vézina, & Rivard, 2004; Garneau, Paquin, Carrier, & Rivard, 2009; Paquin, Cagnol, Carrier, Leblanc, & Rivard, 2013). However, in our study, as there were no changes in the cell cycle phase after overexpressing p130 or E2F4 in mMSCs, the proliferation of mMSCs was not affected. The main reason may be that the appropriate extent of overexpression by lentivirus-transduced cell lines is still insufficient to affect the cell cycle or proliferation, which may be helpful in subsequent animal experiments. Finally, overexpressing p130 or E2F4 significantly improved both horizontal migration and vertical migration of mMSCs, which has rarely been reported before and may have been first discovered by our research center. Petrenko and Moll, (2005) proved that migration inhibitory factor (MIF)-deficient cells exhibit E2F-dependent growth alterations and reduced susceptibility to oncogenic transformation. Thus, overexpressed E2F-mediated improvement in the migration of mMSCs may be associated with MIF. However, this question requires further investigation.
There are several limitations to this study. First, we only investigated the ability of mMSCs to differentiate into osteoblasts, lipoblasts, and chondroblasts, but did not induce further differentiation into other cell types, such as endothelial cells, epithelial cells, or immune cells. Second, although the basic functions of mMSCs after lentivirus transduction were detected, such as proliferation, migration, and differentiation, the microenvironment of the exact disease in vitro was not simulated. Based on the above two points, the constructed cell lines still need to be further tested in both in vitro and in vivo studies.
mMSCs with high expression of p130 or E2F4 improved osteogenesis while inhibiting adipogenesis and chondrogenesis, the mechanism of which is related to the regulation of the G1 phase. The construction of these cell lines provides a theoretical and cell basis for subsequent studies with different microenvironments and can be used in clinical treatment of bone injuries, autoimmune osteopathy, and osteoporosis.
ACKNOWLEDGMENT
The authors would like to thank Dr. Liu Ling for her assistance with the experimental techniques.
CONFLICTS OF INTEREST
The authors declare that they have no conflict of interests.
AUTHOR CONTRIBUTIONS
Z. X. W. participated in the study design, performed laboratory work, and statistical analysis; prepared the drafts of the manuscript; and revised it according to advice from the other authors. C. J. X. participated in the laboratory work, performed statistical analysis, and drafted the manuscript. L. A. R., X. X. P., X. M., and X. J. Y. participated in the study design and assisted in statistical analysis. Y. Y. participated in the study design and helped to revise the manuscript. Q. H. B. and G. F. M. were responsible for the study design and revised the manuscript for important intellectual content.
FUNDING INFORMATION
The study was supported by the National Natural Science Foundation of China (No. 81471843, 81571874, 81671892, and 81670074), Jiangsu Provincial Key Medical Discipline (Laboratory) (No. ZDXKA2016025), the Fundamental Research Funds for the Central Universities and the Research Innovation Program for College Graduates of Jiangsu Province (No. KYZZ16_0129).
DECLARATIONS
Consent for publication
All authors have given final approval of the version to be published and agree to be accountable for all aspects of this work.
Availability of data and material
All data generated or analyzed during this study are included in this published article.


