Long non-coding RNA screening and identification of potential biomarkers for type 2 diabetes
Qi Ma and Li Wang have contributed equally to this work.
Funding information
This study was supported by State Key Laboratory of Pathogenesis, Prevention and Treatment of High Incidence Diseases in Central Asia (SKL-HIDCA-2019-39), National Natural Science Foundation of China (82060589, 81960258, and 81860179), and Natural Science Foundation of Xinjiang Uygur Autonomous Region (2018D01C177).
Abstract
Background
To investigate new lncRNAs as molecular markers of T2D.
Methods
We used microarrays to identify differentially expressed lncRNAs and mRNAs from five patients with T2D and paired controls. Through bioinformatics analysis, qRT-PCR validation, ELISA, and receiver operating characteristic (ROC) curve analysis of 100 patients with T2D and 100 controls to evaluate the correlation between lncRNAs and T2D, and whether lncRNAs could be used in the diagnosis of T2D patients.
Results
We identified 68 and 74 differentially expressed lncRNAs and mRNAs, respectively. The top five upregulated lncRNAs are ENST00000381108.3, ENST00000515544.1, ENST00000539543.1, ENST00000508174.1, and ENST00000564527.1, and the top five downregulated lncRNAs are TCONS_00017539, ENST00000430816.1, ENST00000533203.1, ENST00000609522.1, and ENST00000417079.1. The top five upregulated mRNAs are Q59H50, CYP27A1, DNASE1L3, GRIP2, and lnc-TMEM18-12, and the top five downregulated mRNAs are GSTM4, PODN, GLYATL2, ZNF772, and CLTC. Examination of lncRNA-mRNA interaction pairs indicated that the target gene of lncRNA XR_108954.2 is E2F2. Multiple linear regression analysis showed that XR_108954.2 (r = 0.387, p < 0.01) and E2F2 (r = 0.368, p < 0.01) expression levels were positively correlated with glucose metabolism indicators. Moreover, E2F2 was positively correlated with lipid metabolism indicators (r = 0.333, p < 0.05). The area under the ROC curve was 0.704 (95% CI: 0.578–0.830, p = 0.05) for lncRNA XR_108954.2 and 0.653 (95% CI: 0.516–0.790, p = 0.035) for E2F2.
Conclusions
This transcriptome analysis explored the aberrantly expressed lncRNAs and identified E2F2 and lncRNA XR_108954.2 as potential biomarkers for patients with T2D.
1 INTRODUCTION
Patients with type 2 diabetes (T2D) have continuously elevated circulating glucose levels, which is the pathological basis of various diseases.1, 2 Patients with T2D are at a higher risk of heart disease and cerebrovascular disease, accompanied by a higher risk of low-position amputation than healthy individuals.3, 4 A large proportion of public medical resources, greater than that needed for patients with hypertension, stroke, and coronary artery disease combined, is required to care for patients with T2D.5, 6 T2D is an insidious disease, and delayed diagnosis and treatment lead to a failure in controlling the blood glucose levels. Therefore, new biomarkers and diagnostic approaches are urgently required for clinical therapy.
In recent years, intensive studies pertaining to long non-coding RNAs (lncRNAs) have shown that they are widely involved in biological processes.7 lncRNAs participate in the regulation of gene expression by binding to homologous DNA, RNA, and a variety of proteins.8 lncRNAs have also been associated with many human diseases, including cancer,9 cardiovascular disease,10 diabetes,11 and mental disorders.12 Gao et al. found that compared with the control groups, the expression of lncRNA H19 was significantly reduced in patients with T2D as well as in insulin-resistant mice.13 Our previous research has shown that lncRNA MEG3 is significantly downregulated in endothelial cells cultured in high glucose concentrations. Additionally, MEG3 knockdown promotes endothelial cell proliferation and reduces apoptosis at high glucose concentrations.14 Moreover, there is increasing evidence suggesting that lncRNAs may function as novel diagnostic and therapeutic targets for many diseases.15, 16 Therefore, systematic identification of differentially expressed lncRNAs in T2D, elucidation of the underlying mechanism, and evaluation of their clinical significance are necessary in patients with T2D.
In the present study, we analyzed aberrantly expressed lncRNAs in patients with T2D and performed functional enrichment and metabolic pathway analysis to explore their pathogenesis. One of the lncRNA-mRNA pairs was chosen to validate the observed expression patterns, and the ROC curve was used to provide references for the diagnosis and treatment of T2D.
2 MATERIALS AND METHODS
2.1 Participants
In the screening stage, five patients with T2D and five healthy controls were recruited for the analysis of differentially expressed lncRNA/mRNA using microarray assay. Then, 100 patients and paired controls were assessed for validation by qRT-PCR. T2D was evaluated according to the World Health Organization definition: fasting plasma glucose ≥7.0 mmol/l; 2-h post-load venous plasma glucose ≥11.1 mmol/l. The exclusion criteria were as follows: type 1 diabetes mellitus (T1DM) with chronic diseases, family history of T2D, and other types of chronic diseases. All subjects were enrolled at the First Clinical Affiliated Hospital of Xinjiang Medical University (Urumqi, China) from October 2016 to February 2017.
2.2 Biochemical indicator detection
Fasting plasma glucose (FPG), total cholesterol (TC), high-density lipoprotein (HDL), low-density lipoprotein (LDL), glycated serum protein (GSP), and triglyceride (TG) levels were measured in the Laboratory Medicine of the First Affiliated Hospital of Xinjiang Medical University.
2.3 Sample preparation and RNA purification
Density gradient centrifugation was used to purify peripheral blood mononuclear cells (PBMCs) from the blood obtained from the patients. TRIzol (Invitrogen, Carlsbad, CA, USA) was used to extract total RNA according to the manufacturer's instructions and quantified using a NanoDrop spectrophotometer (ND-2000, NanoDrop Products, Wilmington, DE, USA).
2.4 Microarray assay
An Agilent Microarray (V4.0, CapitalBio; Beijing, China) was used to analyze the samples from the screening stage. A total of 41,000 lncRNAs and 34,000 mRNAs were evaluated by each slide (4 × 180 K format). Following the manufacturer's standard protocols, the samples were tagged, hybridized, and eluted. This process included reverse transcription of total RNA into double-stranded cDNA, synthesis of cRNA, synthesis of cDNA by cRNA reverse transcription and fragmentation, hybridization, and cleaning with the chip after fluorescent labeling.10 The Agilent chip scanner (G2565CA) was used to obtain hybrid pictures.
Data were normalized and analyzed using GeneSpring GX software (Agilent Technologies, USA) and visualized using Agilent software (Feature Extraction, version 11.0.1.1). Differentially expressed genes were identified as those with fold change (FC) > 2 and p-value <0.05.
2.5 Bioinformatics analysis
Gene ontology (GO) analysis was used to analyze gene function. Kyoto Encyclopedia of Genes and Genomes (KEGG) was used to identify biological pathways. The lncRNA-mRNA co-expression network was constructed using Cytoscape (v3.1.1, National Institute of General Medical Sciences, Washington, DC, USA). lncRNA-mRNA co-expression prediction analysis (correlation >0.99 or correlation <−0.99, p < 0.05) was used to screen the lncRNA-mRNA pairs within a 10-kb genomic location and similar sequences in the 3'-UTR.
2.6 qRT-PCR validation
Differentially expressed lncRNAs and mRNAs were determined using qRT-PCR. Briefly, total RNA (1 µg) was extracted following the manufacturer's instructions. PCR was performed on an ABI 7500 System (Applied Biosystems, Carlsbad, CA, USA) using SYBR (TaKaRa Bio, Dalian, China). The 2−△△CT method was used to calculate the fold change, and β-actin was used for normalization. All experiments were repeated thrice.
2.7 Detection of plasma E2F2 protein
Peripheral blood (2 ml) was collected in EDTA tubes from each participant, and plasma was separated by centrifugation. Plasma concentrations of E2F2 were measured using an ELISA kit (Shanghai Hengyuan Biological Technology Co., Ltd., China) following the manufacturer's protocol.
2.8 Statistical analysis
All statistical analyses were performed using SPSS (v22.0, Chicago, IL, USA) and GraphPad Prism (v5.0, GraphPad Software Inc., San Diego, CA, USA). χ 2 and independent t tests were used to determine the differences between the population characteristics of patients with T2D and controls. The Mann–Whitney U test was used for abnormally distributed data. Significant GO terms and KEGG pathways were screened using Fisher's exact test. The lncRNA-mRNA co-expression network and clinical significance were constructed using multiple linear regression. Statistical significance was set at p ≤ 0.05. The specificity and sensitivity of lncRNAs were determined using receiver operating characteristic (ROC) curves.
3 RESULTS
3.1 Participant demographics and clinical characteristics
A total of 105 patients with T2D and paired controls were enrolled in our study with two stages. The χ2-test and t test results revealed no significant differences between the T2D and control groups in terms of age or sex distribution, except for FPG. In stage one, FPG was an average of 10.85 mmol/l in patients with T2D and 4.87 mmol/l in the control group. In stage two, FPG was an average of 9.49 mmol/l in patients with T2D and 4.96 mmol/l in the control subjects (Table 1).
| T2D | Controls | Comparison | ||
|---|---|---|---|---|
| Statistics | p-value | |||
| Stage One | n = 5 | n = 5 | ||
| Age (y) | 53.00±4.06 | 57.00±5.74 | t = −1.271 | 0.239 |
| Sex (Female/Male) | 2/3 | 2/3 | χ 2 = 0.000 | 1.000 |
| FPG (mmol/l) | 10.85±2.52 | 4.87±0.63 | t = 6.514 | <0.0001 |
| Ethnicity | Han | Han | ||
| Stage Two | n = 100 | n = 100 | ||
| Age (y) | 57.58±8.64 | 55.11±6.57 | t = −1.489 | 0.140 |
| Sex (Female/Male) | 43/57 | 39/61 | χ2 = 0.331 | 0.565 |
| FPG (mmol/l) | 9.49±2.53 | 4.96±0.40 | t = −11.863 | <0.0001 |
| Ethnicity | Han | Han | ||
3.2 lncRNA and mRNA microarray expression profiling
In stage one, ten blood samples were used for microarray profiling. Screening data can be obtained from the Gene Expression Omnibus (GEO) database (https://www.ncbi.nlm.nih.gov/geo/query/acc.cgi?acc=GSE163980).
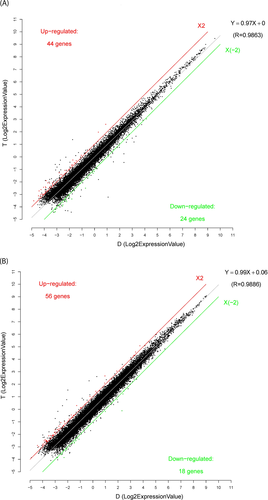
We identified 68 differentially expressed lncRNAs (44 upregulated and 24 downregulated lncRNAs; FC > 2.0, p < 0.05) and 74 differentially expressed mRNAs (56 upregulated and 18 downregulated mRNAs; FC > 2.0, p < 0.05) from the peripheral blood cells (Figure 1). The top five differentially expressed lncRNAs and mRNAs are listed in Table 2.
| Seqname | FC | P | Regulation | Type | chr |
|---|---|---|---|---|---|
| ENST00000381108.3 | 3.855 | 0.036 | Up | lncRNA | chrX: 3771050-3781615 |
| ENST00000515544.1 | 3.269 | 0.010 | Up | lncRNA | chr4: 80413746-80497612 |
| ENST00000539543.1 | 3.216 | 0.001 | Up | lncRNA | chr1: 148928344-148951595 |
| ENST00000508174.1 | 3.179 | 0.017 | Up | lncRNA | chr4: 80413569-80497614 |
| ENST00000564527.1 | 3.105 | 0.002 | Up | lncRNA | chr15: 99679521-99685575 |
| TCONS_00017539 | 2.952 | 0.032 | Down | lncRNA | chrX: 119264663-119269975 |
| ENST00000430816.1 | 2.618 | 0.035 | Down | lncRNA | chr9: 138506141-138507354 |
| ENST00000533203.1 | 2.578 | 0.005 | Down | lncRNA | chr11: 36408070-36409800 |
| ENST00000609522.1 | 2.498 | 0.007 | Down | lncRNA | chr7: 38365670-38369244 |
| ENST00000417079.1 | 2.402 | 0.002 | Down | lncRNA | chr13: 30916596-30939898 |
| Q59H50 | 3.253 | 0.042 | Up | mRNA | chr21: 046327961-046327902 |
| CYP27A1 | 2.995 | 0.019 | Up | mRNA | chr2: 219679951-219680010 |
| DNASE1L3 | 2.856 | 0.017 | Up | mRNA | chr3: 58178414-58178355 |
| GRIP2 | 2.797 | 0.012 | Up | mRNA | chr3: 14530795–14530736 |
| lnc-TMEM18-12 | 2.631 | 0.017 | Up | mRNA | chr2: 945382-945323 |
| GSTM4 | 5.397 | 0.027 | Down | mRNA | chr1: 110201628-110201686 |
| PODN | 2.963 | 0.008 | Down | mRNA | chr1: 53547711-53547770 |
| GLYATL2 | 2.449 | 0.041 | Down | mRNA | chr11: 58602251-58602192 |
| ZNF772 | 2.324 | 0.017 | Down | mRNA | chr19: 57984876-57984817 |
| CLTC | 2.268 | 0.001 | Down | mRNA | chr17: 57774258-57774317 |
- Abbreviation: FC: fold changes; up: upregulation; down: downregulation.
3.3 Bioinformatics analysis
Genes perform their biological functions through coordination. This is especially true for complex diseases, such as T2D, which may be the result of a phenotypic difference caused by mutations in multiple genes.17 To investigate enriched genes in biological processes (BP), cellular components (CC), and molecular functions (MF), GO analysis was performed with the differentially expressed mRNAs. The top five most significant GO terms for each module based on the FDR ≤ 0.05 (Bonferroni correction) and P-value are listed in Figure 2A. The most enriched BP term was detection of visible light. The most enriched CC term was endocytic vesicle membrane, while the most enriched MF term was lipoprotein transporter activity.
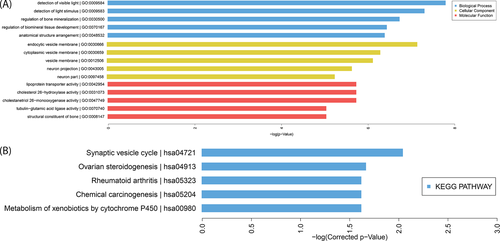
Additionally, we analyzed the significant pathways associated with consensus mutations in T2D patients using KEGG. The top five pathways are represented in a histogram image in Figure 2B; the most highly enriched pathway was observed to be the synaptic vesicle cycle.
3.4 Co‑expression analysis and target prediction
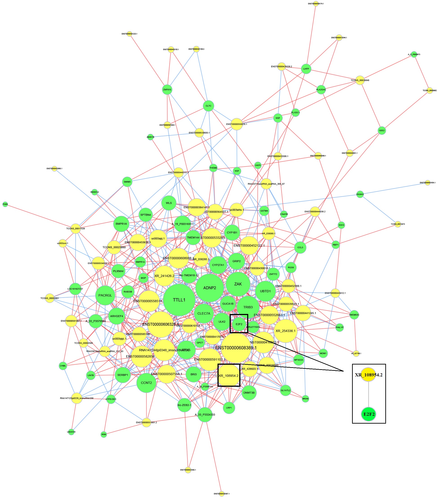
Next, we constructed lncRNA-mRNA co-expression network to investigate the correlation between differentially expressed lncRNAs and targeted mRNAs. Co-expression analysis, based on mathematical correlation, was used to identify lncRNA-mRNA pairs with similar expression profiles. The top 1000 pairs with the highest levels of correlation were selected, and Cytoscape software was used to draw the network diagram (Figure 3). Based on lncRNA and mRNA co-expression, cis-prediction was performed to identify lncRNA-mRNA pairs with genome locations within 10 kb. The blat tool was used for trans-prediction, and sequences of lncRNAs and mRNAs (3'-UTR) were compared to screen lncRNA-mRNA pairs with similar sequences. The results showed that the target gene of lncRNA XR_108954.2 is E2F2 (Figure 3).
The chip test results revealed that the lncRNA XR_108954.2 expression levels were higher in the T2D group as compared to the control group (79.54 ± 15.11 vs. 36.28 ± 9.24; p < 0.05) (Figure 4A); we also observed similar results for E2F2 mRNA expression (223.33 ± 38.75 vs. 111.97 ± 15.10; p < 0.05) (Figure 4B).

3.5 Validation of differential expression using qRT-PCR and ELISA assay
The expression of lncRNA XR_108954.2 and E2F2 was verified in 100 patients with T2D and 100 healthy controls using qRT-PCR. We found that the expression of XR_108954.2 and E2F2 in T2D group was higher compared with that in the control group (XR_108954.2: 2.54 ± 0.48 vs. 1.09 ± 0.19, p < 0.01; E2F2: 2.80 ± 0.45 vs. 1.57 ± 0.25, p < 0.05) (Figure 5A, B). These data were consistent with those obtained from microarray analysis. The ELISA showed that plasma E2F2 in the T2D patients was higher than that in healthy controls (86.67 ± 5.83 vs. 57.19 ± 4.89 ng/l, p < 0.01) (Figure 5C).

3.6 Correlation between lncRNA XR_108954.2 and E2F2 and clinical biochemical indicators
Multiple linear regression analysis was used to evaluate the correlation between lncRNA XR_108954.2 and E2F2. The results showed that XR_108954.2 and E2F2 expression levels were positively correlated (r = 0.461, p < 0.01). Moreover, the correlation between biochemical indicators and lncRNA XR_108954.2 and E2F2 was also analyzed. The multiple correlation coefficient between XR_108954.2 expression levels and glucose metabolism indicators, including FPG and GSP, was 0.387 (p < 0.01), and E2F2 expression levels were positively correlated with glucose (r = 0.368, p < 0.05) and lipid metabolism indicators (r = 0.333, p < 0.05) (Table 3).
| XR_108954.2 | E2F2 | |||
|---|---|---|---|---|
| r | p | r | p | |
| XR_108954.2 | 1.000 | — | 0.461 | ≤0.001 |
| E2F2 | 0.461 | 0.000 | 1.000 | — |
| Indicators of glucose metabolism | ||||
| FBG (mmol/l) | 0.387 | 0.003 | 0.368 | 0.003 |
| GSP (mmol/l) | ||||
| Indicators of lipid metabolism | ||||
| TG (mmol/l) | 0.214 | 0.506 | 0.333 | 0.049 |
| TC (mmol/l) | ||||
| HDL (mmol/l) | ||||
| LDL (mmol/l) | ||||
3.7 Identification of novel T2D biomarkers
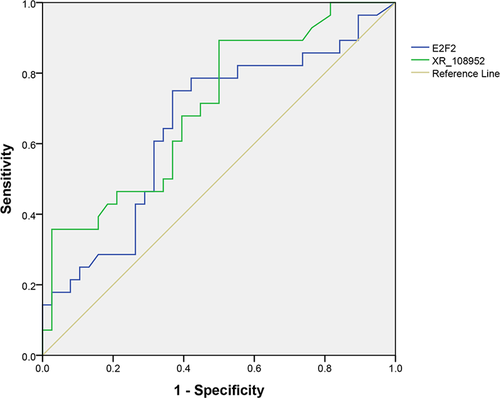
The diagnostic value of XR_108954.2 and E2F2 was evaluated using ROC curve analysis. The AUC of XR_108954.2 was 0.704 (95% CI: 0.578–0.830, p = 0.05), and that of E2F2 was 0.653 (95% CI: 0.516–0.790, p = 0.035) (Figure 6). These findings suggested that E2F2 has better clinical significance in terms of discriminating patients with T2D from healthy controls than XR_108954.2.
4 DISCUSSION
lncRNAs were once considered "junk DNA" due to their non-coding function and were thought to have accumulated during the evolution of genes.18 However, the rapid development of molecular biology and the application of next-generation sequencing technologies have illustrated that lncRNAs play important roles in diverse biological functions including chromatin modification, transcriptional regulation, post-transcriptional regulation, cellular proliferation, differentiation, and apoptosis.19-22 Our study determined 68 differentially expressed lncRNAs and 74 differentially expressed mRNAs in patients with T2D.23 Bioinformatics analysis indicated that these lncRNAs may function in most biological processes associated with diabetes.
The role of lncRNAs in diabetes is gathering increasing amounts of attention, and numerous evidences have revealed that lncRNAs play important roles in many of the pathophysiological mechanisms.24-26 The lncRNAs may also serve as biomarkers in the diagnosis, prognosis, and clinical management of the disease.27-29 Abhishek et al. reviewed the numerous functions of lncRNA NONRATT021972 in different diabetes-related diseases and found that NONRATT021972 is both a potential diagnostic and targeted therapy tool for diabetes-associated diseases.30 Previously, lncRNA ENST00000588707.1 and TCONS_00004187 were observed to be at significantly lower levels in peripheral blood mononuclear cells of patients with T2D. The AUC values of ENST00000588707.1 and TCONS_00004187 were 0.816 (95% CI: 0.764–0.869, sensitivity 72.0%, specificity 80.3%) and 0.826 (95% CI: 0.774–0.879, sensitivity 81.6%, specificity 61.3%), respectively, which indicated that lncRNA ENST0000588707.1 and TCONS_00004187 may serve as potential biomarkers for T2D.23 In this study, we used bioinformatics approach to predict lncRNA-mRNA pairs. Our results showed that E2F2 was the target gene of lncRNA XR_108954.2 and that E2F2 mRNA and lncRNA XR_108954.2 expression levels were higher in the T2D group. Moreover, E2F2 and lncRNA XR_108954.2 expression correlated with glucose metabolic indicators, and E2F2 expression correlated with glycolipid metabolic indicators. The AUC values of XR_108954.2 and E2F2 were 0.704 (95% CI: 0.578–0.830, p = 0.05) and 0.653 (95% CI: 0.516–0.790, p = 0.035), respectively. These results indicate that XR_108954.2 and E2F2 function in the glucose and glycolipid metabolic pathways during T2D progression and have potential diagnostic value in T2D.
E2F transcription factors are thought to play important roles in cell growth control as well as in the pathogenesis of many diseases.31, 32 Several studies have revealed that E2F proteins play important roles in the development of some mental disorders. In schizophrenia and bipolar disorder, cell cycle regulation is significantly altered and these changes include changes in the transcriptional complex controlling the expression of E2F/DP-1 target genes critical for G2/M progression.33 Claire et al showed that significantly lower peripheral blood E2F1 mRNA levels were observed in patients with depression than that in controls.34 Ainhoa et al showed that E2F1/E2F2 compound-mutant mice developed non-autoimmune insulin-deficient diabetes and exocrine pancreatic dysfunction.35 E2F1 and E2F2 transcription factors-deficient mice developed a chronic pancreatitis-like syndrome and became diabetic.36 Moreover, E2F1 and E2F2 transcription factors play important roles in the regulation of pancreatic exocrine cell cycle and maintenance of pancreatic beta cells.37 Anderson et al. pointed that about 25% of people with diabetes suffers from mental illness.38 China Guidelines for Type 2 Diabetes (2017) state that assessment of psychological status should be performed throughout the treatment of diabetes and that improving depression and anxiety in patients with diabetes is conducive to the control of diabetes.39 E2F may be a part of the underlying pathological mechanism of the comorbidity of diabetes and mental illness. In our study, we predicted that E2F2 to be the target gene of lncRNA XR_108954.2, and a positive correlation between E2F2 and XR_108954.2 expression levels (r = 0.461, p < 0.01) was identified. This indicates that E2F2 expression is regulated by lncRNA XR_108954.2, which provides new significant insights for the mechanistic study of diabetes.
However, some limitations of this study need to be considered. The validity of E2F2 and lncRNA XR_108954.2, as molecular markers of T2D, needs to be verified through additional experiments. The lack of indicators reflecting islet function means that the relationship between lncRNA XR_108954.2, E2F2, and islet function was not examined in this study. The correlations revealed between lncRNA XR_108954.2, E2F2, and lipid metabolism are preliminary and require a more comprehensive analysis for confirmation. Another limitation of this study is that target prediction was based on known chip sites, and additional mechanisms of interaction between lncRNAs and mRNAs remain to be explored.
5 CONCLUSIONS
In this study, 68 differentially expressed lncRNAs and 74 differentially expressed mRNAs were identified in patients with T2D. Bioinformatics analysis showed that these lncRNAs may function in the biological processes associated with diabetes. Additionally, we identified that the target gene of lncRNA XR_108954.2 is E2F2, which may be involved in glucose and lipid metabolism by regulating insulin secretion. Moreover, E2F2 and lncRNA XR_108954.2 may be potential biomarkers for the diagnosis and treatment of T2D.
ACKNOWLEDGMENTS
This study was supported by State Key Laboratory of Pathogenesis, Prevention and Treatment of High Incidence Diseases in Central Asia (SKL-HIDCA-2019-39), National Natural Science Foundation of China (82060589, 81960258, and 81860179), and Natural Science Foundation of Xinjiang Uygur Autonomous Region (2018D01C177). We thank all the subjects for participating in the research reported.
CONFLICT OF INTEREST
The authors have no conflicts of interest to declare.
INFORMED CONSENT
Signed informed consent was collected from all participants prior to the recruitment.
Open Research
DATA AVAILABILITY STATEMENT
The datasets used and/or analyzed during the current study are available from the corresponding author on reasonable request.


