The biotin interference within interference suppressed immunoassays
Abstract
Background
Reports of false laboratory findings due to a biotin supplementation have raised concerns about the safety of immunoassays. According to current research, biotin is known to cause interference in immunoassays. Since up to 70% of medical decisions are based on laboratory results and the significantly increased intake of biotin supplements in the recent years, the reliability of immunoassays is essential.
Methods
To evaluate this reliability two experiments were conducted. In the first experiment 59 interference suppressed immunoassays of the manufacturer Roche Diagnostics were examined regarding their sensitivity to a biotin interference. In the second experiment the pharmacokinetic of biotin was examined by supplementing volunteers with biotin.
Results
A combination of the results of both experiments suggests that a biotin interference in laboratory findings is probable. Contrary to the current state of research on sandwich immunoassays, falsely elevated test results occur more frequently than falsely low results.
Conclusion
The interference suppressed immunoassays have shown in the experiment that they are susceptible to a biotin interference. Therefore, laboratory institutions, medical staff and patients must be aware of the possibility of a biotin interference. As a result, Roche Diagnostics may consider reviewing the interference suppression and their indications of the tests.
1 INTRODUCTION
The intake of biotin supplements has increased significantly in the recent years.1-3 According to current research, biotin is known to cause interference in immunoassays.4-6 Reports of false laboratory findings due to a biotin supplementation have raised concerns about the safety of immunoassays.7 However, the reliability of immunoassays is essential since up to 70% of medical decisions are based on laboratory results.5, 8 The interference suppressed immunoassays provide limits and guidelines to exclude a biotin interference.9 In the study, 59 interference suppressed immunoassays of the manufacturer Roche Diagnostics were examined with regard to their sensitivity to a biotin interference.
Biotin, vitamin H or vitamin B7 are water-soluble vitamins, that are contained in various animal foods such as eggs or liver as well as in vegetable products such as oats and nuts.2, 4, 8, 10 The human organism cannot synthesize biotin itself and is dependent on the food intake.11-13 A biotin intake of 0.03–0.06 mg/day is recommended for adults, while the recommended intake for children and adolescents is significantly lower.2, 6, 8, 10, 14 A balanced diet without caloric restriction basically ensures a sufficient biotin intake.1, 2 A biotin deficiency occurs with healthy humans only very rarely and usually takes place in pregnancy.2, 4, 8, 15, 16 Furthermore, biotin is renal eliminated, and the indications for biotin supplementation are limited.2 In the case of defects in the biotin metabolism, for example in holocarboxylase synthetase and biotinidase deficiency, a substitution therapy is required.1, 7, 10 A high-dose biotin therapy with a biotin dose of up to 300 mg/day is sometimes recommended for patients suffering from multiple sclerosis.5, 7, 10 However, biotin in increased doses is present in many dietary supplements. It is advertised as a dietary supplement product stimulating skin, hair and nail growth despite the low evidence of benefits for healthy individuals.8, 10, 17 The over-the-counter formulations often contain supraphysiologic biotin doses up to 10–30 mg.5, 8, 18, 19
A study of the National Health and Nutrition Examination Survey performed between 2011 and 2012 found that 29% of the U.S. population consumes biotin supplements.4 Biotin forms a non-covalent bond with the protein streptavidin. The binding is strong, forms quickly and is insensitive to pH and temperature.1, 8 This is used in laboratory medicine in Western blot analysis, immunohistochemistry and immunoassays. In immunoassays biotin builds usually the link between the antibody and streptavidin.1, 2, 4 A high biotin concentration in the patient’s serum and plasma can competitively influence this biotin–streptavidin binding and cause a displacement of the antibodies at the solid phase from their antibody–streptavidin binding. This displacement results in an increased washout of the labeled antibody that subsequently leads to a decrease of the measurement signal.1, 4 The result can be a falsification of the test results.6
The sandwich immunoassay is also considered to be theoretically less susceptible to biotin interference.19 Results of competitive immunoassays may be falsely elevated by a high biotin concentration in the patient’s serum while results of immunoassays based on the sandwich method (non-competitive) may be falsely reduced.4-6 Biotin–streptavidin immunoassays are used for the determination of various parameters, which are important for various medical fields.2, 9
There is no routine determination or elimination of biotin in the patient’s serum before immunoassays are performed, making it difficult to examine the test result with regard to a biotin interference.2, 7 Additionally, biotin taken by patients as a dietary supplement without medical indication is not listed in the pre-medication and cannot be considered in the diagnosis.4, 5, 19 Especially in case of discrepancies between clinical presentation and biochemical results, a biotin interference should be considered.20
In this study, two experiments were conducted. The aim of the first experiment was to evaluate the sensitivity of the biotin interference suppressed immunoassays to a biotin interference. For this purpose, 59 biotin interference suppressed immunoassays of the manufacturer Roche Diagnostics were tested. The aim of the second experiment was to examine the pharmacokinetic of biotin by supplementing volunteers with biotin. A combination of the results of both experiments indicates that a biotin interference in laboratory findings is probable. Contrary to the mentioned assumptions, falsely elevated test results occur more frequently than falsely low results in the sandwich immunoassays.
2 MATERIALS AND METHODS
In the first experiment, all the interference suppressed immunoassays of the manufacturer Roche Diagnostics available at the MVZ Laboratory Dr. Stein and Colleagues, Mönchengladbach, Germany, were tested for their sensitivity to biotin interference. For each test, blood samples of patients, which already have been tested with this method, were selected. These were then spiked with biotin solution and measured again. The measured values were collected and analyzed. The development of the measured values with increasing biotin concentration was compared to their ‘known original value’ (Figure 1).
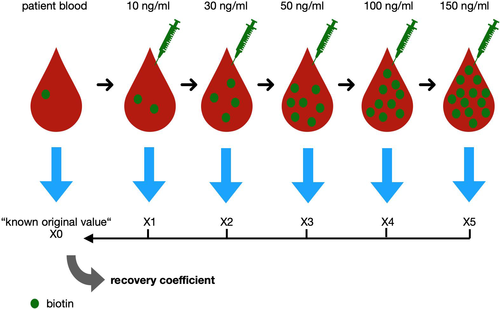
Blood samples sent to MVZ Laboratory Dr. Stein and Colleagues, Mönchengladbach, Germany were recorded with age and sex. Up to 10 patients’ samples for each tested immunoassay of the manufacturer Roche Diagnostics were selected. These samples have been previously tested with this test procedure. In total we selected blood from 533 patients and conducted 3128 measurements. The results of these previous tests were set as the ‘known original value’.
The parameters of the chosen blood samples for each immunoassay were scattered as widely as possible over the entire measurement spectrum to include biotin interferences on parameters near the upper and lower measurement limit. Each patient’s serum was divided into five samples of 180 µl and spiked with 20 µl biotin solution of 100, 300, 500, 1000 or 1500 ng/ml. The used biotin solution consisted of lyophilized biotin powder obtained from of Sigma-Aldrich, (≥99%, #B4501, Lot. SLBZ5374) and standard NaCl solution. This procedure resulted in an increase of the biotin concentration by 10, 30, 50, 100 or 150 ng/ml. These concentrations are mostly located in the interference suppressed range of 30 ng/ml up to 100 ng/ml (varying according to the measured parameter).6, 9
The pre-existing biotin concentration in the patient’s serum was not recorded beforehand. However, the physiological biotin level ranged from 200 to 800 pg/ml and was in comparison with the resulting biotin concentration low enough to remain unconsidered.21 The original immunoassays were repeated with a Cobas e801 and the measured values were noted, multiplied by 1.1 to compensate for the dilution and then put into relation to the ‘known original value’. Afterwards the recovery coefficient was calculated. For each immunoassay the mean value of the recovery coefficient for each biotin concentration and the standard deviation was calculated. These mean recovery coefficients for the sandwich immunoassays and competitive immunoassays are listed in Tables S1 and S2.
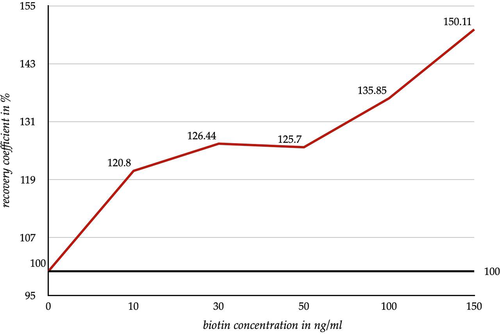
To give a comprehensive overview of the test form the obtained data were summarized for the sandwich immunoassay and competitive immunoassay. The mean values for each biotin concentration were calculated. These are depicted in Figures 2 and 3, and the related standard deviation is listed in Tables 2 and 3. Thus, the 100% line in the graphic shows the ‘recovery coefficient of the known original value’ (abbreviated with rc1). The course of the graph reflects the average development of the measured values and their deviation from rc1. The examined parameters are listed below the Figures. Due to this summary, the individual biotin interference of each immunoassay is not shown.
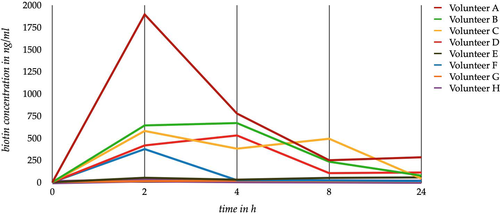
In order to examine the pharmacokinetics of supplemented biotin, an experiment was performed on eight volunteers. The volunteers were divided into groups of two. Each participant of a group was given the same dose of biotin for a single intake. The four groups were provided with concentrations of 150 mg (Volunteers A and B), 50 mg (Volunteers C and D), 10 mg (Volunteers E and F) and 5 mg (Volunteers G and H), respectively. The volunteers were not currently taking any dietary supplements. Therefore, our data only reflect the pharmacokinetics of the ingested single dose. Based on our experiment, we cannot make any statements about accumulation or the achievement of a plateau level during regular intake.
Blood was collected five times from each volunteer: (i) at time point 0, directly before biotin intake, to determine the ‘base level’ of biotin; (ii) 2 h after intake; (iii) 4 h after intake; (iv) 8 h after intake; and (v) 24 h after intake.
Since the objective was to determine the peak level of biotin after ingestion of high- and low-dose biotin supplements, blood sampling of the volunteers was stopped 24 h after ingestion. Furthermore, this time period reproduces a situation where the patient stopped the biotin supplementation the day before blood collection.
The automated enzyme-linked immunosorbent assay (ELISA) test procedure ‘IDK Biotin ELISA’, manufactured by Immundiagnostik AG, was used to determine the biotin concentration in the volunteer's serum. Samples containing biotin levels above the upper measurement limit of 1200 ng/l had to be repeatedly diluted by the factor 20, 100 or 1000 and reassayed with the same test procedure. The dilution was calculated and compensated subsequently. Nevertheless, it can be assumed that due to the higher dilution required with increasing biotin levels an increasing measurement inaccuracy has been achieved. The dietary biotin intake of the volunteers during the experiment period was not taken into account and should not play a significant role when considering the "base level" of biotin.
3 RESULTS
After the biotin intake all volunteers showed an increased concentration of biotin, depending on the dose taken for each volunteer (Figure 2). The peak level was reached after 2–4 h. After that peak a rapid elimination of biotin was observed. This corresponded to the current data situation.2 One day after ingestion an individually increased biotin concentration was proven in the blood; hence, after 24 h the elimination was not yet complete. After this period of time, a biotin concentration above 50 ng/ml has been observed in the majority of the volunteer’s blood samples (Table 1). Participants receiving the same biotin dose had an overall low variation in measured serum concentration (Table 1). After an ingestion of 50 mg, the measured peak doses in the volunteer's blood held an already higher amount of biotin than the most spiked sample, which contained 150 ng/ml of biotin. A high biotin concentration above 50 ng/ml was already reached by a 10 mg biotin supplementation.
| Volunteer |
Biotin intake (mg) |
24 h after Intake (ng/ml) |
Peak dose (ng/ml) |
|---|---|---|---|
| A | 150 | 282 | 1895 |
| B | 150 | 74 | 668 |
| C | 50 | 41 | 579 |
| D | 50 | 110 | 528 |
| E | 10 | 54 | 50.1 |
| F | 10 | 130 | 372 |
| G | 5 | 10 | 17.1 |
| H | 5 | 5 | 20.7 |
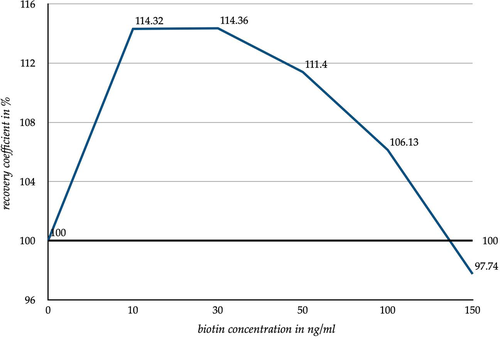
Figure 3 pictures an increase in the measured values especially at a low biotin concentration. An increase of the biotin concentration in the samples by 10 ng/ml led to an average increase in the measured values by 14.32% regarding their known original value. By further increasing the biotin concentration up to 150 ng/ml, an approximation of the measured values compared to their known original value was observed. With a biotin concentration increased by 150 ng/ml, the difference to the known original value was almost reversed (difference to known original value 2.26%). In general, the biotin spiked samples tested with a sandwich method showed an increase of their values. As mentioned in the introduction a depression of the values was expected.4-6 The resulting standard deviation of the recovery coefficient are shown in Figure 3 and listed in Table 2.
|
Biotin concentration (ng/ml) |
Standard deviation recovery coefficient |
|---|---|
| 10 | 0.22 |
| 30 | 0.21 |
| 50 | 0.21 |
| 100 | 0.22 |
| 150 | 0.23 |
The competitive immunoassays showed an increase in the measured values due to increasing biotin concentrations in the samples. Furthermore, an elevation of the biotin concentration by 10 ng/ml already showed an average increase in the measured values by 20.8% (Figure 4). Especially for a biotin concentration ≥50 ng/ml, a strong increase in the measured values was observed. With an elevation of the biotin concentration by 100 ng/ml, the measured values increased by 35.8% in average. If the biotin concentration was elevated by 150 ng/ml, the measured values were increased by 50.1% in average. The increasing standard deviation of the recovery coefficient for competitive immunoassays is listed in Table 3.
|
Biotin concentration (ng/ml) |
Standard deviation recovery coefficient |
|---|---|
| 10 | 0.40 |
| 30 | 0.59 |
| 50 | 0.51 |
| 100 | 0.73 |
| 150 | 1.02 |
4 DISCUSSION
With an increasing biotin concentration, each test method showed an individual course (Tables S1 and S2). Some test methods appeared to be more susceptible to biotin interference while others appeared to be less susceptible. This was also reflected in the standard deviation (Tables 2 and 3). Thus, the changes in the measured values of the competitive immunoassays and the sandwich immunoassays are not binding for the tested methods (Figures 3 and 4). The increasing standard deviation of the competitive immunoassays (Table 3) also indicates that the biotin interference is a non-calculable influencing factor. Rather, it leads to an increasing scattering of the measured values which leads to an increase in the measurement uncertainty.
Nevertheless, we were able to show clear trends and tendencies in both graphs, (Figures 3, 4, Tables S1 and S2). Based on the measured biotin peak dose of the volunteers, especially after a high-dose intake (≥50 mg), the volunteer's blood contains an already higher amount of biotin than the most spiked sample. Based on the graphs (Figures 3 and 4) two scenarios can be assumed. In the sandwich immunoassays a further increase of the biotin concentration will lead to further decreases in the measured results. In the competitive immunoassays, however, an increasing biotin concentration will lead to a further increase of the measured results. This would apply to patients taking high-dose biotin for medical purposes (up to 300 mg/day). However, since such a high dose of biotin is usually only taken under special circumstances,1, 2, 10 it is easier to take the biotin interference into account when evaluating the measured results in the everyday clinical practice.
The over-the-counter supplements available on the market contain biotin doses of up to 10–30 mg.8, 18, 19 Therefore, it can be assumed that the biotin level of these patients is within the range of 10–50 ng/ml (Figure 2 and Table 1). Hence this range has the most clinical importance.
Based on the results depicted in Figures 3 and 4, it can be concluded that a low dose of biotin intake (up to 10 mg) can lead to false high results in sandwich immunoassays and in competitive immunoassays. False high findings play the most important clinical role with regard to biotin interference in the competitive immunoassays and the sandwich immunoassays. Roche Diagnostics states the used immunoassays as interference suppressed up to plasma biotin concentrations of 30 ng/ml up to 100 ng/ml (varying according to parameter).6, 9 However, this statement is not reflected by the measured values of the conducted experiment.
In sandwich immunoassays the risk of a false positive result plays a role especially with regard to infection parameters such as syphilis, toxoplasmosis, rubella and hepatitis. The danger of false negative results seems only to be given by a biotin intake above or equal to 50 mg on the day of blood collection. In this case the intake of high doses of biotin is likely to cause false negative findings.
In competitive immunoassays a biotin concentration of 10 ng/ml causes a lower value increase (20.8%) compared to the value increase caused by a high biotin concentration of 150 ng/ml (50.11%). Due to the rare intake of high-dose biotin (≥ 50 mg/d) the lower value increase affects a larger range of patients.
The lower value increases tend to appear less important compared to the high deviations at more elevated biotin levels but can be of therapeutic and diagnostic importance. In particular with the evaluation of thyroid hormones (T3, T4, fT3, fT4), steroid hormones (cortisol, progesterone, testosterone, dehydroepiandrosterone sulfate, estradiol) as well as the vitamin B12 and folic acid in case of an existing biotin interference it can be problematic to differentiate between lack, normal quantity and surplus of these parameters. This should be considered in therapy and substitution. The mentioned parameters are often tested individually therefore an implausible finding is potentially not obvious. Hence, a biotin interference could be unnoticed.
As indicated by Roche Diagnostics, for the interference suppressed immunoassays there should be at least eight hours between the last biotin supplementation and the blood collection.6, 9 Based on the presented data it is obvious that this indicated period of time is not precise enough to avoid a biotin interference neither in the sandwich immunoassays nor in the competitive immunoassays. The lowest time limit of 8 h is selected too short considering that the volunteers still had an elevated biotin level 24 h post intake.
However, the initial increase in the measured results for the lower biotin concentrations in the sandwich immunoassays is still unexplained (Figure 3). A plausible cause may be the interference suppression of the immunoassays by the manufacturer Roche Diagnostics. The manufacturer refers the tests as interference suppressed up to biotin concentrations between 30 and 100 ng/ml.6, 9 By observing the measuring range of these biotin concentrations, the measured values approach the original value noticeably.
One assumption is that the high initial increase in the measured values, especially at low biotin concentrations, represents an overcorrection of the interference suppression of the tests. In order to be able to prove this, further information from the manufacturer about the exact mode of operation of the interference suppression of the immunoassays is needed. However, the current interference suppression is an unreliable tool to avoid a biotin interference.
In order to prevent a biotin interference, the use of streptavidin-coated microparticles can be considered.22, 23 The usage of these particles resulted in an adequate depletion of biotin in serum/plasma without affecting the precision of the used method.22 Furthermore, these diagnostic tools offer a possibility to avoid a biotin interference without affecting a patients medication because a suspension of the biotin intake is not needed.22, 23 The list price can range between $2.50 and $20 per treated sample.23 As the method has to be adapted to the routine operation of a laboratory and is a potential expense, it represents especially a solution for suspicious patient samples.
The medical staff as well as the patients should be sensitized for biotin interference. In case of implausible or abnormal findings a biotin interference and a biotin depletion with re-assaying should be considered.6, 18 During the medical anamnesis it is always recommended to ask specifically about the use of lifestyle products and dietary supplements.6, 18 It is also important to inform patients with no medical need for biotin to suspend the biotin intake over 48 h before blood collection.11 Moreover, it is substantial to encourage the exchange between laboratorians and clinicians in case of a suspected biotin interference.
5 CONCLUSIONS
The interference suppressed immunoassays of the manufacturer Roche Diagnostics are susceptible to a biotin interference. Therefore, measurement distortions due to a biotin interference cannot be excluded in the test results. Contrary to previous assumptions in the sandwich immunoassays, falsely elevated test results occur more frequently than falsely low results. Furthermore, Roche Diagnostics’ indicated time period between the biotin intake and the blood collection is not precisely enough defined since the period of at least 8 h is not sufficient. Laboratory institutions and medical staff must be aware of these issues. In addition to this, Roche Diagnostics may consider reviewing the interference suppression and their indications of the immunoassays.
CONFLICT OF INTEREST
The authors declare no conflict of interest.
AUTHOR CONTRIBUTIONS
Conceptualization, PK and JvH.; methodology, PK and JvH; formal analysis, PK.; investigation, PK; resources, JvH; data curation, PK; writing-original draft preparation, PK; writing-review and editing, PK, RW, JvH; visualization, PK and RW; supervision, RW and JvH. All authors have read and agreed to the published version of the manuscript.
INSTITUTIONAL REVIEW BOARD STATEMENT
The study was conducted according to the guidelines of the Declaration of Helsinki and approved by the Institutional Review Board (or Ethics Committee) of University Hospital RWTH Aachen protocol code EK158/18, date of approval: 26.07.2018.
Open Research
DATA AVAILABILITY STATEMENT
Data presented in this study are available upon request from the corresponding author.


