Effect of metformin on myotube BCAA catabolism
Abstract
Metformin has antihyperglycemic properties and is a commonly prescribed drug for type II diabetes mellitus. Metformin functions in part by activating 5′-AMP-activated protein kinase, reducing hepatic gluconeogenesis and blood glucose. Metformin also upregulates peroxisome proliferator-activated receptor-gamma coactivator-1α (PGC-1α). Several population studies have shown levels of circulating branched-chain amino acids (BCAA) positively correlate with insulin resistance. Because BCAA catabolic enzyme content is regulated by PGC-1α, we hypothesized metformin may alter BCAA catabolism. Therefore, the purpose of this work was to investigate the effect of metformin at varying concentrations on myotube metabolism and related gene and protein expression. C2C12 myotubes were treated with metformin at 30 uM (physiological) or 2 mM (supraphysiological) for up to 24 hours. Metabolic gene expression was measured via quantitative real time polymerase chain reaction, protein expression was measured using Western blot, and mitochondrial and glycolytic metabolism were measured via oxygen consumption and extracellular acidification rate, respectively. Supraphysiological metformin upregulated PGC-1α mRNA expression along with related downstream targets, yet the reduced expression of electron transport chain components as well as basal and peak cell metabolism. Supraphysiological metformin also suppressed branched-chain aminotransferase 2 (BCAT2) and branched-chain-alpha-keto acid dehydrogenase E1a (BCKDHa) mRNA expression as well as BCAT2 protein expression and BCKDHa activity, which was accompanied by decreased Kruppel-like factor 15 protein expression. Physiological levels of metformin suppressed BCKDHa and cytochrome c oxidase mRNA expression at early time points (4-12 hours) but had no effect on any other outcomes. Together these data suggest metformin may suppress BCAA catabolic enzyme expression or activity, possibly reducing levels of circulating gluconeogenic substrates.
Abbreviations
-
- AMPK
-
- 5′ adenosine monophosphate-activated protein kinase
-
- ATP Syn
-
- ATP synthase
-
- BCAA
-
- branched-chain amino acid
-
- BCAT2
-
- branched-chain aminotransferase 2
-
- BCKDHa
-
- branched-chain-alpha-keto acid dehydrogenase E1a
-
- BCKDK
-
- branched-chain-alpha-keto acid dehydrogenase kinase
-
- COX
-
- cytochrome c oxidase
-
- CS
-
- citrate synthase
-
- KLF15
-
- Krüppel like factor 15
-
- NRF1/2
-
- nuclear respiratory factor 1/2
-
- OCR
-
- oxygen consumption rate
-
- PGC-1α
-
- peroxisome proliferator-activator receptor gamma coactivator-1α
-
- PPAR
-
- peroxisome proliferator-activator receptor
-
- TBP
-
- TATA-binding protein
-
- TFAM
-
- mitochondrial transcription factor A
1 BACKGROUND
In recent years, the incidence of type 2 diabetes has dramatically increased in developed nations. In fact, the CDC reported an increase from 8.3% in 2010 to 9.4% in 2015,1 and an estimated 1.5 million people were newly diagnosed with diabetes.1 Similar trends have been reported in the United Kingdom.2 As a result of the rising prevalence of diabetes, use of antidiabetic medications has also increased. For example, the use of first-line pharmaceutical metformin rose from 55.4% of diabetics in 2000 to 83.6% in 2013.2 By 2013, metformin was prescribed as first-line therapy for 91% of newly diagnosed patients with type II diabetes mellitus and as an add-on for 79.9% of patients.2 Another study reported that 40.6% of outpatient visits with a diabetes diagnosis either initiated or continued metformin prescription.3 Thus, while estimates of the exact frequency of metformin use vary, it is clear that metformin is a commonly used and highly effective medication in the regulation of blood glucose.
Metformin acts as an antihyperglycemic agent through several potential mechanisms. First, metformin has been shown to activate 5′-AMP-activated protein kinase (AMPK) in the liver,4 which reduces gluconeogenesis. In peripheral tissues, metformin-mediated AMPK activation may increase mitochondrial biogenesis and muscle glucose uptake while reducing expression of lipogenic genes.4 For example, cultured C2C12 myotubes given metformin at 2 mM during days 3 to 8 of myotube differentiation exhibited strongly induced peroxisome proliferator-activated receptor-gamma coactivator-1α (PGC-1α) expression,5 a master regulator of mitochondrial biogenesis.6-8 The same report demonstrated PGC-1α expression was also upregulated in skeletal muscle of mdx mice given 2 mg/mL in drinking water for 42 days.5 Similar findings have been observed in C2C12 myotubes treated with 2.5 mM metformin for 24 hours, which exhibited increased PGC-1α, nuclear respiratory factor 1 (NRF1), and mitochondrial transcription factor A (TFAM) protein expression, as well as elevated pAMPK expression.9 The same report also demonstrated that high-fat fed C5BL/6 mice given metformin for 16 weeks could reverse high-fat-induced suppression of gastrocnemius PGC-1α protein expression.9 Moreover, a report by Hasan et al10 showed that high-fat fed male albino rats given metformin at 320 mg/day via oral gavage for 4 weeks exhibited rescued levels of muscle PGC-1α mRNA expression vs high-fat only rats. Similarly, metformin (400 mg·kg−1 day−1 for 4 weeks) was shown to induce both messenger RNA (mRNA) and protein expression of PGC-1α, as well as activate both AMPK and extracellular signal–regulated kinases signaling in skeletal muscle in both wild-type and Ob/Ob mice.11 Similar findings have been obtained in rats given 300 mg/kg body weight which also induced PGC-1α expression in the soleus, white gastrocnemius, and red gastrocnemius vs saline-treated rats.12 Interestingly, a report using C2C12 cells treated with very low-dose (2 nM) metformin for 24 hours reported significant elevations in myotube PGC-1α expression,11 to a similar extent as those shown by Ljubicic et al.5
Along with the rising incidence of diabetes, an increasing interest in branched-chain amino acids (BCAAs) and their relationship with the severity of insulin resistance has developed. Several population studies have correlated circulating BCAAs with the severity of insulin resistance.13-20 Reduced BCAA catabolism has been suggested as a likely contributor to the accumulation of circulating BCAAs in obese and diabetic populations. Interestingly, the expressional regulation of BCAA catabolic enzymes appears to be regulated by PGC-1α.21 In fact, the activation of either PGC-1α or peroxisome proliferator-activator receptor α (PPARα) induces BCAA catabolic enzymes branched-chain aminotransferase (BCAT2) and branched-chain-alpha-keto acid dehydrogenase (BCKDH).21-23 BCKDH represents the committed and rate-limiting step of BCAA catabolism and is negatively regulated by branched-chain-alpha-keto acid dehydrogenase kinase (BCKDK) by phosphorylation.24 Other PPAR family members (PPARδ and PPARγ) have also been implicated in the regulation of BCAA catabolism.21 Not surprisingly, activities which promote PGC-1α such as exercise or fasting also promote BCAA metabolism.25, 26
Despite several studies demonstrating metformin's ability to induce PGC-1α, to our knowledge the effect of metformin on indicators of BCAA catabolism remains relatively unexplored. Given metformin is known to activate PGC-1α, which as described above is a positive regulator of BCAA catabolic gene expression,21-23 one might expect metformin to induce BCAA catabolic gene expression. However, one report demonstrated metformin suppressed BCAT2 expression in both C2C12 myotubes and in a mouse model of maple syrup urine disease, however, the effects of metformin on BCKDH expression remains unknown.27 One possible mechanism that explains an upregulation of PGC-1α by metformin, with a concurrent decrease in BCAA metabolism, is the simultaneous downregulation of Kruppel-like factor 15 (KLF15), which is recognized as a coordinating transcription factor in the metabolism of BCAA (including the expression of muscle BCAT2).28 Interestingly, metformin was previously shown to significantly increase PGC-1α in primary mouse hepatocytes, and reduced PGC-1α acetylation (the indication of PGC-1α activation and Sirt1 activity), while suppressing KLF15 expression in HepG2 cells.29
Thus, given metformin is such a commonly used antidiabetic therapy, and the strong link between elevated circulating BCAA and severity of insulin resistance, it seems important to investigate the effect of metformin on BCAA metabolism.21-23 Additionally, it has been suggested that the dose of metformin used in basic experimental research likely plays a vital role in determining the mechanisms by which metformin functions.30 In fact, several in vitro studies have used concentrations of metformin that far exceed physiological concentrations in the blood.30 Large variability in metformin pharmacokinetics have been observed, however steady-state metformin plasma levels likely range from 54 to 4133 ng/mL (400 nM-31 µM).4 Therefore, the aim of this study is to examine the effect of metformin (both physiological and supraphysiological) on indicators of BCAA catabolism. Our hypothesis is that metformin will inhibit mitochondrial metabolism thereby increasing AMPK activation and PGC-1α expression leading to increased expression of regulators of mitochondrial biogenesis and BCAA catabolism. However, it is unclear if these expressional changes will alter cell metabolism or BCAA catabolism.
2 METHODS
2.1 Cell culture
C2C12 mouse myoblasts (CRL-1772; ATCC, Manassas, VA) were cultured in Dulbecco's modified Eagle's medium (DMEM) containing 4500 mg/L glucose and supplemented with 10% heat-inactivated fetal bovine serum and 100 U/mL penicillin/streptomycin, in a humidified 5% CO2 atmosphere at 37°C. Cells were seeded overnight and grown to confluency with growth media changed every 2 to 3 days. Differentiation was accomplished by replacing growth media with DMEM supplemented with 2% horse serum (HS) and 100 U/mL penicillin/streptomycin for 6 to 8 days. Metformin was dissolved in media to final treatment concentration of either 30 µM (representing physiologically attainable concentrations) or 2 mM (representing a supraphysiological concentration), which were both investigated because of the potential impact of high concentrations of metformin on in vitro cell response.30 The 30 µM physiological concentration was selected because 30 µM has previously been shown to be the highest steady-state concentration of circulating metformin in a diabetic population given 1 g of metformin twice daily.4 The 2 mM supraphysiological concentration was selected because past reports have used 2 mM5, 29 in various cell culture models (including C2C12 myotubes5, 27) and have shown an induction of PGC-1α mRNA as early as 24 hours.29 And while several of these reports also explored treatment durations longer than 24 hours, we observed reductions in cell viability of cells treated with 2 mM for 24 hours (described more below), and thus we did not extend our experiments beyond 24 hours. However, time-course experiments of baseline, 4-, 8-, and 12-hour treatments were conducted to characterize the timeline of metabolic gene expression. Similarly, the covalent activation of key enzymes involved in BCAA catabolism and cell energetics were explored using treatments for up to 4 hours. For each experiment, differentiation media served as a control.
2.2 Quantitative real time polymerase chain reaction
Total mRNA was extracted using the TRIzol method and complementary DNA (cDNA) was synthesized using the iScript cDNA Synthesis Kit from Bio-Rad (Hercules, CA) according to manufacturer's instructions. Polymerase chain reaction (PCR) primers were synthesized by Integrated DNA Technologies (Coralville, IA). Amplification of target genes was normalized to the housekeeping gene, TATA-binding protein (Table 1). Quantitative real-time (qRT)-PCR reactions were performed using the CFX Connect System from Bio-Rad. SYBR Green-based PCR was performed using final primer concentrations at 3.75 µM in a total volume of 20 µL using 125 ng of sample cDNA per well (determined via NanoDrop from Thermo Fisher Scientific, Wilmington, DE). The following cycling parameters were used: 95°C for 3 minutes followed by 40 cycles of 95°C for 15 seconds, and 60°C for 30 seconds. qRT-PCR reactions were performed using 5 to 6 replicate samples per experiment for 24-hour experiments or 3 replicate samples for time-course data. Relative quantification was determined via ΔΔCt method.
| Gene abbreviation | Forward sequence | Reverse sequence |
|---|---|---|
| ATP syn | 5′-AGGCCCTTTGCCAAGCTT-3′ | 5′-TTCTCCTTAGATGCAGCAGAGTACA-3′ |
| BCAT2 | 5′-CGGACCCTTCATTCGTCAGA-3′ | 5′-CCATAGTTCCCCCCCAACTT-3′ |
| BCKDHa | 5′-CCAGGGTTGGTGGGATGAG-3′ | 5′-GGCTTCCATGACCTTCTTTCG-3′ |
| COX | 5′-GCTGCATCTGTGAAGAGGACAAC-3′ | 5′-CAGCTTGTAATGGGTTCCACAGT-3′ |
| CS | 5′-TGAGAGGCATGAAGGGACTTGTGT-3′ | 5′-ATCTGTCCAGTTACCAGCAGCCAA-3′ |
| KLF15 | 5′-TCTCGTCACCGAAATGCTCA-3′ | 5′-GAGTCAGGGCTGGCACAAGA-3′ |
| NRF1 | 5′-ACCCTCAGTCTCACGACTAT-3′ | 5′-GAACACTCCTCAGACCCTTAAC-3′ |
| PGC-1α | 5′-GACAATCCCGAAGACACTACAG-3′ | 5′-AGAGAGGAGAGAGAGAGAGAGA-3′ |
| TBP | 5′-GGGATTCAGGAAGACCACATA-3′ | 5′-CCTCACCAACTGTACCATCAG-3′ |
| TFAM | 5′-GAAGGGAATGGGAAAGGTAGAG-3′ | 5′-ACAGGACATGGAAAGCAGATTA-3′ |
- Abbreviations: ATP syn, ATP synthase; BCAT2, branched-chain aminotransferase 2; BCKDHa, branched-chain alpha-keto acid dehydrogenase; COX, cytochrome c oxidase; CS, citrate synthase; KLF15, Krüppel like factor 15; NRF1, nuclear respiratory factor 1; PGC-1α, peroxisome proliferator-activated receptor-gamma coactivator-1α; TBP, TATA-binding protein; TFAM, mitochondrial transcription factor A.
2.3 Western blot
Following treatment as described above, whole-cell lysates were prepared by harvesting the cells on ice in radioimmunoprecipitation assay buffer from Bio-Rad supplemented with protease inhibitor mix (0.1%) from Bio-Rad, followed by incubation on ice for 60 minutes. Insoluble material was removed, and protein concentrations were determined by the Bradford assay (Bio-Rad). Total protein (50 μg per sample) of lysates was size-separated by 10% sodium dodecyl sulfate polyacrylamide gel electrophoresis and electrotransferred to polyvinylidene fluoride membranes. After blocking in TBST-5% nonfat milk powder for 1 hour, membranes were probed at 4°C overnight with primary rabbit anti-p-BCKDHa polyclonal antibody (Cat #ab200577; RRID:AB_2687944; Abcam, Cambridge, MA), rabbit anti-BCKDHa polyclonal antibody (Cat #31-325; RRID:AB_10943362; ProSci Inc, Poway, CA), rabbit anti-BCAT2 polyclonal antibody (Cat #bs-6589R; RRID:AB_11105428; Bioss, Woburn, MA), rabbit anti-KLF15 polyclonal antibody (Cat #NBP2-24635; Novus Biologicals, Centennial, CO) or rabbit anti-p-AMPK (Cat #sc-101631; RRID:AB_2169723; Santa Cruz Biotechnology, Santa Cruz, CA), rabbit anti-AMPK(Cat #sc-25792; RRID:AB_2169546; Santa Cruz Biotechnology), rabbit anti-PGC-1α (Cat #sc-13067; RRID:AB_2166218; Santa Cruz Biotechnology), or rabbit anti-β-actin (Cat #sc-130656; RRID:AB_2223228; Santa Cruz Biotechnology) polyclonal antibodies from Santa Cruz Biotechnologies at a dilution of 1:1000 in TBST-5% nonfat milk powder. Bound antibodies were detected by horseradish peroxidase-conjugated secondary antibodies (Cat #ab6721; RRID:AB_955447; Abcam) at a dilution of 1:5000 in TBST-5% nonfat milk powder for 1 hour at room temperature while shaking. Protein signal intensities were determined by chemiluminescence using the Clarity Western ECL Substrate Kit from Bio-Rad and imaged using the ChemiDoc Touch from Bio-Rad. Relative signal intensities were measured in at least duplicate per target for each sample, normalized to β-actin, and quantified using Image Lab from Bio-Rad.
2.4 Seahorse oxidative and glycolytic metabolic assay
Cells were seeded into Seahorse XFe96 culture plates and differentiated for 6 days once reaching confluence. Following 24-hour treatment with metformin at either 30 µM or 2 mM, the media was replaced with XF Assay Media obtained from Agilent Technologies (Santa Clara, CA). Baseline measurements of oxygen consumption rate (OCR) and extracellular acidification rate (ECAR) were recorded as indicators of basal oxidative metabolism and glycolytic metabolism, respectively. Following basal measurements, each well was infused with oligomycin (an inhibitor of ATP synthase [ATP Syn]) at a final concentration of 2 μM to induce maximal glycolytic metabolism. Cells were then exposed to carbonyl cyanide p-(trifluoromethoxy)-phenyl-hydrazone (FCCP) at 2 μM to uncouple electron transport and induce peak OCR. Maximal respiration measurements were followed by the injection of rotenone at 0.5 μM to reveal non-mitochondrial respiration. Basal and peak oxidative metabolism were normalized to non-mitochondrial OCR from each respective well. The Seahorse XFe96 Analyzer was run using a 6 minutes cyclic protocol command (mix for 3 minutes and measure for 3 minutes) as previously performed.31
2.5 Cell viability
Cells were treated as described above for 24 hours. Media was then replaced with media containing 10% WST-1 reagent (vol/vol) from Cayman Chemical (Ann Arbor, Michigan). Absorbance at 450 nm was measured temporally for 60 minutes.
2.6 Statistical analyses
Data are presented as group mean ± SE. Relative gene and protein expression for 24-hour experiments were analyzed via the Student t test using 5 to 6 replicates per treatment condition per experiment. Time-course gene and protein expression experiments were analyzed using a one-way analysis of variance (ANOVA) with Dunnett's correction for multiple comparisons to compare each time point with baseline with n = 3 per group. Basal and peak mitochondrial and glycolytic metabolism were analyzed using one-way ANOVA with Bonferroni's correction for multiple comparisons using n = 46 for control and n = 23 for metformin-treated groups. One-way multivariate analysis of variance was used to determine differences in basal and peak cell metabolism using n = 46 for control and n = 23 for metformin-treated groups. Cell viability was analyzed using two-way ANOVA with treatment and time as independent variables, and area under the curve was used to summarize the trial and was analyzed using one-way ANOVA with 7 to 8 replicates per group. Values of P ≤ .05 were used to identify significant differences between groups.
3 RESULTS
3.1 Supraphysiological metformin treatment induces regulators of mitochondrial biogenesis while suppressing indicators of BCAA catabolism
To investigate the effect of metformin on cell energetics, indicators of mitochondrial biogenesis and BCAA catabolism were measured following supraphysiological metformin (2 mM) treatment. Metformin significantly increased PGC-1α mRNA expression by 129.7% ± 78.1% compared to control (Figure 1A). Several downstream targets of PGC-1α were also upregulated. Specifically, NRF1 increased by 37.1% ± 28.8%, TFAM increased by 91.5% ± 30.8%, and citrate synthase (CS) increased by 72.0% ± 39.7% (Figure 1A). And although slightly elevated, a significant induction of PGC-1α was not observed at the protein level (Figure 1B). Interestingly, BCAA catabolic gene expression was shown to be depressed, despite PGC-1α mRNA upregulation. Specifically, BCAT2 mRNA decreased by 35.4% ± 25.9% and BCKDHa mRNA decreased by 90.0% ± 6.8% vs control cells (Figure 1B). BCAT2 also was significantly suppressed (decreased by 24.3% ± 21.0%) at the protein level (Figure 1C). Because we observed an induction of several metabolic genes following 24-hour metformin treatment, we next explored the effect of 2 mM metformin at earlier time points. Similar to 24-hour treatment, 2 mM metformin significantly induced mRNA expression of PGC-1α, TFAM, and CS (Figure 1D). We also investigated the effect of metformin at earlier time points on both BCAT2 and BCKDHa expression. Interestingly, BCAT2 was subtly but significantly induced (increased 32.1% ± 20.6%), while BCKDHa expression remained unaltered (Figure 1E). Additionally, we explored the temporal effect of metformin on BCKDHa and AMPK phosphorylation in a 4-hour time course. Treatment with metformin at 2 mM led to the suppression of BCKDHa activity at both 3 and 4 hours (Figure 2A). This inactivation of BCKDHa activity was paralleled by concurrent increases in AMPK activation, which was significantly elevated at the 4-hour time point (Figure 2B).
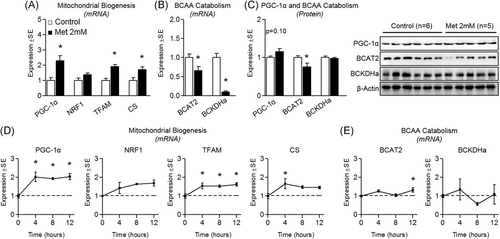
Effect of supraphysiological metformin treatment on mitochondrial biogenesis and BCAA catabolism. A, Effect of metformin at 2 mM for 24 hours on myotube mRNA expression of peroxisome proliferator-activated receptor-gamma coactivator-1α (PGC-1α), nuclear respiratory factor 1 (NRF1), mitochondrial transcription factor A (TFAM), and citrate synthase (CS). B, Effect of metformin on mRNA expression of branched-chain amino acid transaminase 2 (BCAT2) and branched-chain keto acid dehydrogenase E1 alpha (BCKDHa). C, Protein expression of PGC-1α, BCAT2, and BCKDHa following treatment as described in “A”. D, Time course of metabolic gene expression including PGC-1α, NRF1, TFAM, and CS following treatment with metformin at 2 mM for up to 12 hours. E, Time course gene expression of BCAT2 and BCKDHa following treatment with metformin at 2 mM for up to 12 hours. Notes: t test was used to determine differences between groups for 24-hour experiments. One-way analysis of variance with Dunnett's comparisons was used to compare each time point with baseline. *P ≤ .05 vs control/baseline. Target gene expression was normalized to TATA-binding protein (TBP) using n = 5 to 6 per group (24-hour experiments) or using n = 3 (time course experiments). Protein expression was measured in at least duplicate for each experiment using n = 5 to 6 per group

Effect of supraphysiological metformin treatment on branched-chain keto acid dehydrogenase E1 alpha (BCKDHa) activity. A, Effect of metformin at 2 mM for up to 4 hours on myotube phospho-BCKDHa (p-BCKDHa) expression normalized to total BCKDHa. B, Effect of metformin on 5′-AMP-activated protein kinase (AMPK) activity indicated by pAMPK:AMPK. Notes: A one-way analysis of variance with Dunnett's correction for multiple comparisons was used to compare each time point with baseline. *P ≤ .05 vs baseline. Time course data was performed using three replicates per group measured in duplicate
3.2 Physiological metformin does not alter regulators of mitochondrial biogenesis or BCAA catabolism
To explore the effect of physiological metformin on myotube BCAA catabolism, these experiments were repeated following treatment of metformin at a physiological concentration (30 µM). No changes were seen in indicators of mitochondrial biogenesis at either the mRNA (Figure 3A) or protein level (Figure 3C) following 24-hour treatment, or following shorter treatment durations (Figure 3D). Similarly, 24-hour treatment resulted in no change in mRNA or protein expression of BCAA catabolic enzymes (Figure 3B and 3C, respectively), however, BCKDHa (but not BCAT2) mRNA was suppressed by 30 µM metformin following shorter treatment durations (4, 8, and 12 hours; Figure 3E). We also assessed BCKDHa and AMPK activation following up to 4-hour treatment, and activities of both enzymes remained unaltered by 30 µM metformin across a 4-hour time course (Figure 4).
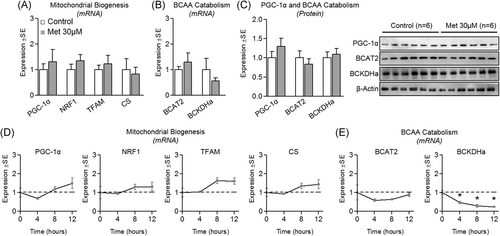
Effect of physiological metformin treatment on mitochondrial biogenesis and branched-chain amino acids (BCAA) catabolism. A, Effect of metformin at 30 µM for 24 hours on myotube messenger RNA expression of peroxisome proliferator-activated receptor-gamma coactivator-1α (PGC-1α), nuclear respiratory factor 1 (NRF1), mitochondrial transcription factor A (TFAM), and citrate synthase (CS). B, Effect of metformin on mRNA expression of branched-chain amino acid transaminase 2 (BCAT2) and branched-chain keto acid dehydrogenase E1 alpha (BCKDHa). C, Protein expression of PGC-1α, BCAT2, and BCKDHa following treatment as described in “A”. D, Time course of metabolic gene expression including PGC-1α, NRF1, TFAM, and CS following treatment with metformin at 30 µM for up to 12 hours. E, Time course gene expression of BCAT2 and BCKDHa following treatment with metformin at 30 µM for up to 12 hours. Notes: t test was used to determine differences between groups for 24-hour experiments. One-way analysis of variance with Dunnett's comparisons was used to compare each time point with baseline. *P ≤ .05 vs control/baseline. Target gene expression was normalized to TATA-binding protein (TBP) using n = 5 to 6 per group (24-hour experiments) or using n = 3 (time course experiments). Protein expression was measured in duplicate for each experiment using n = 6 per group

Effect of physiological metformin treatment on branched-chain keto acid dehydrogenase E1 alpha (BCKDHa) and 5′-AMP-activated protein kinase (AMPK) activity. A, Effect of metformin at 30 µM for up to 4 hours on myotube phospho-BCKDHa (p-BCKDHa) expression normalized to total BCKDHa. B, Effect of metformin on AMPK activity indicated by pAMPK:AMPK. Notes: A one-way analysis of variance with Dunnett's correction for multiple comparisons was used to compare each time point with baseline. *P ≤ .05 vs baseline. Time course data was performed using three replicates per group measured in duplicate
3.3 Supraphysiological but not physiological metformin suppresses myotube metabolism
Next, we investigated the effect of metformin on myotube metabolism at both physiological and supraphysiological concentrations. Basal and peak mitochondrial metabolism were suppressed by 2 mM metformin. Specifically, basal oxygen consumption decreased by 55.7% ± 3.6% and peak metabolic capacity decreased by 45.1% ± 7.6% vs control cells (Figure 5A). Similarly, glycolytic metabolism during peak ECAR was decreased (by 30.0% ± 5.9%) following 2 mM metformin treatment (Figure 5B). Two millimolar treatment also led to a significant depression in basal (P < .001) and peak (P < .001) cell metabolism (Figure 5C). Conversely, physiological metformin concentrations did not alter any type or level of myotube metabolism (Figure 5).
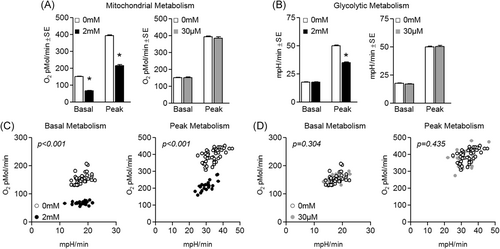
Effect of metformin on myotube metabolism. A, Effect of metformin at 2 mM (left) or 30 µM (right) for 24 hours on myotube basal and peak mitochondrial metabolism. B, Effect of metformin at 2 mM (left) or 30 µM (right) for 24 hours on myotube basal and peak glycolytic metabolism. C, Effect of 2 mM metformin on basal metabolism (left) and peak metabolism (right). D, Effect of 30 µM metformin on basal metabolism (left) and peak metabolism (right). Notes: A one-way analysis of variance with Bonferroni's correction for multiple comparisons was used to determine differences between groups for basal and peak mitochondrial and glycolytic metabolism vs control. One-way multivariate analysis of variance was used to determine differences in basal and peak metabolism. *P ≤ .05 vs control. Experiments were completed using n = 46 for control and n = 23 for metformin-treated groups
In alignment with the observed suppression in cell metabolism, 24-hour 2 mM metformin also caused significant reduction in the mRNA expression of key electron transport chain components including cytochrome c oxidase (COX; decreased by 77.1% ± 23.6%) and ATP Syn (decreased by 44.6% ± 6.5%) vs control cells (Figure 6B). Shorter treatment periods only resulted in subtle, insignificant changes in electron transport chain component expression (Figure 6A). Interestingly, 30 uM metformin reduced mRNA expression of COX at 4, 8, and 12 hours, but did not alter ATP Syn expression (Figure 6C). And following 24-hour treatment, gene expression of these respiratory components had returned to control levels (Figure 6D).

Effect of metformin on mitochondrial respiratory component expression. A, B, Effect of metformin at 2 mM for (A) up to 12 hours or (B) 24 hours on myotube gene expression of respiratory components including cytochrome c oxidase (COX) and ATP synthase (ATP Syn). C, D Effect of metformin at 30 µM for (C) up to 12 hours or (D) 24 hours on myotube respiratory gene expression. Notes: t test was used to analyze gene expression using n = 5 to 6 per group for 24-hour experiments. Time-course gene expression was performed using n = 3 per group and analyzed using one-way analysis of variance with Dunnett's comparisons to compare each time point with baseline. *P ≤ .05 vs control/baseline
3.4 Supraphysiological metformin suppresses myotube KLF15 protein expression
Because we saw decreases in BCAT2 and BCKDHa despite also observing significant elevation of PGC-1α mRNA expression, we measured KLF15 mRNA and protein expression (as KLF15 is a recognized regulator of BCAA catabolism28). Interestingly, while KLF15 mRNA expression was increased at each time point following 2 mM metformin treatment (Figure 7A), KLF15 protein expression was decreased by 28.9% ± 12.0% (P = .08) following 24-hour treatment (Figure 7C). And consistent with previous experiments using physiological levels of metformin, 30 µM did not alter KLF15 mRNA expression (Figure 7B).
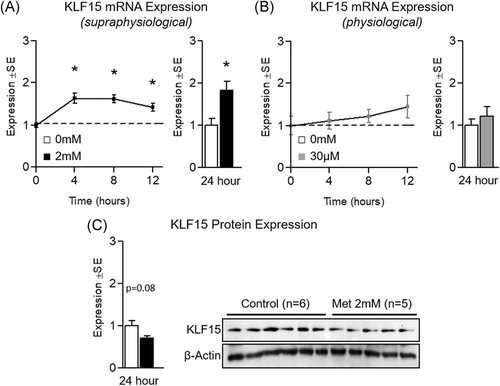
Effect of metformin on KLF15 expression. A, Effect of metformin at 2 mM for up to 12 hours (left) or 24 hours (right) on myotube Kruppel-like factor 15 (KLF15) gene expression. B, Effect of metformin at 30 µM for up to 12 hours (left) or 24 hours (right) on KLF15 gene expression. C, Effect of metformin at 2 mM for 24 hours on KLF15 protein expression. Notes: t test was used to analyze gene and protein expression using n = 5 to 6 per group for 24-hour experiments. Time-course gene expression was performed using n = 3 per group and analyzed using one-way analysis of variance with Dunnett's comparisons to compare each time point with baseline. *P ≤ .05 vs control/baseline. Protein expression was measured in duplicate for each experiment
4 DISCUSSION
Metformin represents a highly effective and commonly used pharmacological tool in the regulation of blood glucose levels among diabetic populations. In this report, we investigated the effects of metformin on indicators of BCAA catabolism in cultured myotubes as dysregulated BCAA catabolism has been previously reported in diabetics. While past reports have investigated the effect of metformin on similar indicators, to our knowledge, a comprehensive investigation on the effects of metformin on enzymatic mRNA and protein expression, as well as activation of the BCKDH complex has yet to be performed. In our report, we identify several interesting effects of metformin on myotube metabolism. First, we observed a significant induction of PGC-1α at the mRNA (but not protein, P = .10) level by metformin at 2 mM. Other reports have demonstrated a significant induction of PGC-1α at the protein level using cultured C2C12 myotubes.5 While our report failed to find a significant induction of PGC-1α at the protein level, we suspect differences in treatment duration may have been responsible for discrepancies between findings by Ljubicic et al5 and those in the present report. We did however observed a significant induction in PGC-1α at the mRNA level at several time points which corresponded with the upregulation of several downstream targets of PGC-1α which regulate mitochondrial biogenesis. Interestingly, we observed suppressed mRNA expression of both BCAT2 and BCKDHa by metformin despite upregulation of PGC-1α expression. This is surprising given ectopic PGC-1α overexpression has previously been linked with upregulation of both BCAT2 and BCKDHa.21 We next investigated the protein expression of BCAT2 and BCKDHa following 2 mM metformin treatment and observed reduced BCAT2, but not BCKDHa levels in the metformin group. Because the BCKDH complex is negatively regulated by BCKDK, we next temporally measured the phosphorylation status of both AMPK (as an indicator of cell energetics) and BCKDHa. Not surprisingly, metformin activated AMPK following 4 hours. More interestingly, metformin treatment led to significantly greater phosphorylation of BCKDHa, suggesting metformin suppresses BCKDH complex activity. Similarly, reductions in mRNA expression of electron transport components, mitochondrial metabolism (both basal and peak), and cellular metabolic rate and capacity were observed in cells treated with 2 mM metformin. Interestingly, physiological levels of metformin (30 µM) also resulted in reduced mRNA expression of BCKDHa and COX, suggesting physiological levels of metformin may stimulate some, but not all of the same adaptations as 2 mM metformin, and may do so at a different magnitude and timeline.
Because we observed a significant increase in PGC-1α expression, yet a perplexing reduction of BCAT2 and BCKDHa expression/activity, we next measured the effect of metformin on KLF15 which was previously shown to play an important role in metabolic flexibility in the muscle (including the upregulation of BCAA catabolic enzymes).28 Given previous observations have shown metformin (and other AMPK activators such as AICAR) suppress KLF15 mRNA expression, we expected to find similar results.29 To our surprise, KLF15 mRNA was induced in cells treated with metformin at 2 mM, which is in opposition to similar observations in hepatocytes treated with metformin at 1 mM for 12 or 24 hours.29 However, at the protein level, 2 mM metformin reduced KLF15 protein expression following 24-hour treatment, which is in line with our initial hypothesis. These results suggest a disconnection between the mRNA induction and protein expression of KLF15, which may be a byproduct of the difference in mRNA and protein response at a single time point (ie, mRNA levels may reflect current cell response while protein levels may be slightly delayed). Taken together, our observations demonstrate that metformin may suppress BCAA catabolic enzyme expression in cultured myotubes, despite an upregulation in PGC-1α. Our current working hypothesis based on the presented data (and past observations) is shown in Figure 8. Briefly, metformin inhibits mitochondrial metabolism, promoting an activation of AMPK and subsequently PGC-1α. PGC-1α activation leads to the increased expression of numerous metabolic targets including PGC-1α and markers of mitochondrial biogenesis. Despite upregulation in these genes, the expression of electron transport chain components is suppressed in metformin-treated cells. Additionally, metformin appears to reduce KLF15 protein levels which may contribute to reduced expression of BCAA catabolic enzymes. Although speculation, this process may also contribute to metformin's ability to reduce blood glucose by reducing circulating hepatic gluconeogenic substrates.
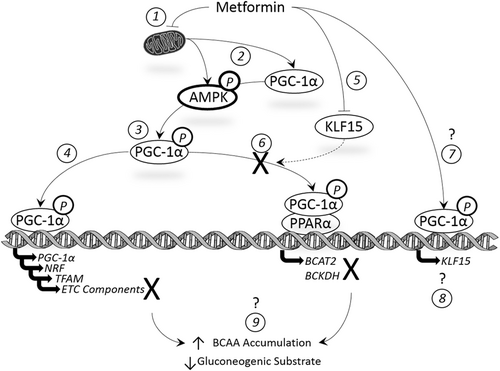
Summary of the current working hypothesis of the effect of metformin on cell energetics. (1) Metformin inhibits mitochondrial metabolism promoting an activation of (2) AMPK and subsequently (3) PGC-1. PGC-1α activation leads to the increased expression of numerous metabolic targets including (4) PGC-1α and markers of mitochondrial biogenesis (but not electron transport chain components). Metformin appears to (5) reduce KLF15 protein levels leading to (6) reduced expression/activation of BCAA catabolic enzymes. Interestingly, metformin (7 and 8) enhanced KLF15 mRNA expression, the implications of which are unknown as are the effects of metformin on BCAA clearance/accumulation and (9) gluconeogenic substrate availability. AMPK, 5′-adenosine monophosphate-activated protein kinase; BCAA, branched-chain amino acid; BCAT2, branched-chain aminotransferase 2; BCKDH, branched-chain-alpha-keto acid dehydrogenase; ETC, electron transport chain; KLF15, Kruppel-like factor 15; NRF, nuclear respiratory factor; PGC-1α, peroxisome proliferator-activator receptor gamma coactivator-1α; PPARα, peroxisome proliferator-activator receptor alpha; TFAM, mitochondrial transcription factor A
Despite these interesting findings, our report is not without limitations. First, the in vitro nature of our study limits several aspects of the study design, which may reduce the generalizability of our findings in vivo. For example, while we tested both physiological and supraphysiological levels of metformin, cells were exposed to a constant dose for up to 24 hours which does not account for physiological fluctuations in circulating levels of metformin that occur when metformin is taken orally in vivo. Second, our study did not determine if alterations in BCAA catabolic enzyme expression following metformin treatment result in a diminished capacity to oxidize BCAA. However, based on the metabolic assay results from our report, we believe that metformin-suppression of mitochondrial respiration is a strong indicator that metabolism (including that of BCAA) is lower in metformin-treated cells. Importantly, others have shown KLF15 is vital for the maintenance of blood glucose (using KLF15 KO mice), especially during times of low carbohydrate consumption.32 The importance of KLF15 was attributed to its role in the production of carbon skeletons from amino acid catabolism as gluconeogenic substrates.32 The report also demonstrates that KLF15 KO mice display reduced skeletal muscle BCAT2 expression as well as elevated circulating BCAA.32 For this reason, it is curious if metformin-mediated suppression of BCAT2 and amino acid catabolism in skeletal muscle results in reduced hepatic gluconeogenic substrates, further contributing to metformin's inhibition of hepatic glucose production (speculation which requires further investigation). Additionally, during our experiments, we cannot exclude the possibility that metformin was cytotoxic to myotubes. Although metformin reduced cell viability at 2 mM (Figure S1), the viability assay utilized in this report is based on the activity of mitochondrial dehydrogenases, which could conceivably be dampened by metformin treatment (through reduction of cell metabolism) without causing significant cell death. Thus, it is unclear if 2 mM metformin is cytotoxic or simply slowing cell metabolism. We selected 2 mM metformin because it has been used during previous experiments,5, 27 while other experiments used metformin concentrations ranging from 1-2.5 mM for various durations (up to 5 days) for in vitro experiments.9, 29 It is also worthy of discussion that the majority of changes in metabolic gene/protein expression and changes in metabolism occurred following treatment with 2 mM metformin, which far exceeds physiologically attainable levels when metformin is consumed orally.4, 30 Thus, it is unclear if these observations are of significance in vivo given the exceedingly high concentrations used during our experiments to produce the observed effects. Furthermore, it is also difficult to distinguish if the effects of high-concentration metformin are a product of only the specific molecular targets measured in the present study, or if additional targets that we did not measure played a role in these observations. Finally, the in vitro nature of our study lacks the measurement of chronic metformin consumption, which is relevant because many people rely on metformin continually to regulate blood glucose. Therefore, the effect of chronic metformin on regulators of BCAA metabolism in skeletal muscle (and other tissues) remains unclear.
These limitations aside, our report demonstrates that high levels of metformin can upregulate transcription factors in skeletal muscle that govern mitochondrial biogenesis while suppressing mitochondrial metabolism. The report also describes how supraphysiological levels of metformin suppress the expression and activity of BCAA catabolic enzymes in skeletal muscle, possibly through suppression of KLF15. However, it is unclear if KLF15 suppression is directly responsible for suppressed BCAA catabolic gene expression. It is also unclear if metformin alters circulating levels of BCAA in insulin-resistant populations, which requires further investigation.
ACKNOWLEDGMENTS
Support for this work was provided by the Department of Exercise Science within the Congdon School of Health Sciences. We would like also to thank the Department of Physical Therapy (Congdon School of Health Sciences) for the use of shared lab space and equipment. MER conducted experiments and assisted with manuscript preparation. ESL conducted experiments and assisted with manuscript preparation. RAV conceived the study, conducted and oversaw experiments, performed all statistical analyses, and oversaw manuscript preparation. All authors have read and approved the final manuscript.
CONFLICT OF INTERESTS
The authors declare that there are no conflict of interests.


