MicroRNA-194 reduces inflammatory response and human dermal microvascular endothelial cells permeability through suppression of TGF-β/SMAD pathway by inhibiting THBS1 in chronic idiopathic urticaria
Qu Shengming and Yang Lei contributed equally to this work.
Abstract
Chronic idiopathic urticaria (CIU) is a polyetiological dermatologic disease. Reports have stated that some microRNAs (miRNAs) have their roles to play in inflammatory response. In this present study, we aim to investigate whether miR-194 has an effect on attenuating inflammatory response and human dermal microvascular endothelial cells (HDMECs) permeability of CIU mast cells through TGF-β/SMAD pathway by binding to thrombospondin 1 (THBS1). The Gene Expression Omnibus database was used to obtain the CIU-related microarray data, and then the analysis of differentially expressed genes was conducted and the miRNA regulated by THBS1 was predicted. After transfection of different mimic, inhibitor, or small interfering RNA, the effect of miR-194 on inflammatory reaction, mast cell degranulation, histamine release rate, HDMECs permeability, and the expression of THBS1, interferon γ (IFN-γ), TGF-β, Smad3, and interleukin 4 (IL-4) were detected. THBS1 was verified to be the miR-194 target. After transfected with overexpressed miR-194 and si-THBS1, the degranulation rate, histamine release rate, and HDMECs permeability were significantly reduced, while the expression of IFN-γ was higher, and the expression of THBS1, TGF-β, Smad3, IL-4 was significantly lower, accompanied with alleviated inflammatory reaction. Our study provides evidence that miR-194 negatively modulates THBS1 and inhibits the activation of TGF-β/SMAD pathway, thereby alleviating the inflammatory response and HDMECs permeability of mast cells in CIU.
Abbreviations
-
- ANOVA
-
- analysis of variance
-
- BCA
-
- bicinchoninic acid
-
- BSA
-
- bovine serum albumin
-
- CIUCIU
-
- chronic idiopathic urticaria
-
- DAB
-
- diaminobenzidine
-
- ECL
-
- enhanced chemiluminescence
-
- ELISA
-
- enzyme-linked immunosorbent assay
-
- FBS
-
- fetal bovine serum
-
- GAPDH
-
- glyceraldehyde-3-phosphate dehydrogenase
-
- GL
-
- germ-line
-
- HDMEC
-
- human dermal microvascular endothelial cell
-
- miRNA
-
- microRNA
-
- MUT
-
- mutant type
-
- OD
-
- optical density
-
- RT-qPCR
-
- reverse transcription quantitative polymerase chain reaction
-
- TGF-β
-
- transforming growth factor β
-
- THBS1
-
- thrombospondin 1
-
- WT
-
- wild type
1 INTRODUCTION
Chronic idiopathic urticaria (CIU) is a major health problem characterized by wheals and angioedema.1 CIU lays a heavy burden on the health conditions of its patients as it shares resemblant damage to ischemic heart disease.2 Researchers found that the peak age of CIU patients ranges from 20 to 40 years old, and a major part of CIU patients suffer from the disease for more than a year.3 In the beginning, the wheals in CIU patients was red but as time goes by they gradually turn pink, and active wheals exhibit degranulated mast cells.4 Mast cells, a sign of an inflammatory response, have the functions of improving human dermal microvascular endothelial cells (HDMECs) permeability and a majority of pathological processes in human body occur simultaneously when an inflammatory response develops.5 The etiology of CIU is not clear, though some researchers suggest that psychologic distress might attribute to it.6 There is a need to find a new treatment for CIU. What is more, previous studies reported that microRNA (miRNA) has its role to play in inflammatory response.7, 8
miRNAs are composed of RNA molecules of approximately 22 nucleotides that commonly serve as a repressor of gene activity.9 MiR-194 has been demonstrated to have an effect on suppressing tumor in a variety of cancers.10, 11 miR-194 counterbalances transcriptional activation of the antiangiogenic factor thrombospondin 1 (THBS1),12 and miR-194 has been found to inhibit THBS1 and promotes angiogenesis in colon cancers.13 THBS1, a pathological inhibitor of endogenous angiogenesis, is widely studied in the development of drug targets for the treatment of cancer and connected to several cellular functions.14, 15 A study demonstrated that THBS1 is relevant to chronic ocular surface inflammation after refractive surgery.16 Additionally, the apoptosis, proliferation, and differentiation of cells and some other cellular processes were controlled by transforming growth factor β (TGF-β).17 The SMAD-dependent canonical pathway is initiated by TGF-β that activated the serine-threonine receptors.18 A former research found that TGF-β/SMAD pathway could regulate miR-486-3p19 and TGF-β is involved in tumorigenesis as a significant part.20 Thus, we conduct the current experiment to explore whether miR-194 could decrease inflammatory response and HDMECs permeability of CIU mast cells through TGF-β/SMAD pathway by targeting THBS1.
2 METHODS AND MATERIALS
2.1 Microarray analysis
Gene Expression Omnibus (GEO) database of the National Center for Biotechnology Information (http://www.ncbi.nlm.nih.gov/geo) was used to retrieve the CIU-related microarray data, which included five normal samples, six lesional CIU samples, and seven nonlesional CIU samples. The difference between normal samples and lesional CIU samples in microarray data were analyzed with the threshold value of |logFC| > 2 and P < 0.05. R language “pheatmap” package was used for drawing the infrared image of differential gene expression.
2.2 Construction of gene interaction network
The interaction between differentially expressed genes (DEGs) was analyzed by the application of the STRING database (https://string-db.org/). The core degree of the DEGs was analyzed by using Cytoscape, and the gene interaction network was constructed.
2.3 Analysis of THBS1-involved pathway analysis and prediction of THBS1-regulated miRNA
The Kyoto Encyclopedia of Genes and Genomes (KEGG) database (http://www.kegg.jp/kegg/pathway.html) was applied for searching THBS1 and obtain the pathway involved in THBS1. The databases of DIANA (http://diana.imis.athena-innovation.gr/DianaTools/index.php?r=microT_CDS/index), starBase (http://starbase.sysu.edu.cn/), mirDIP (http://ophid.utoronto.ca/mirDIP/index.jsp#r), miRNApath (http://lgmb.fmrp.usp.br/mirnapath/tools.php), and TargetScan (http://www.targetscan.org/vert_71/) were all searched to predict the regulatory miRNA of THBS1. The first 50 miRNAs (all miRNAs if the miRNAs were less than 50) were performed with Venn analysis (http://bioinformatics.psb.ugent.be/webtools/Venn/) for the acquirement of the intersection of the predicted results of the five databases. The binding capacity of miRNA and THBS1 in the intersection was analyzed by using microRNA.org database (http://34.236.212.39/microrna/home.do).
2.4 Subjects and grouping
Fifty-three patients with CIU were collected. There were 28 females and 25 males with average of 34 years. Patients were enrolled if they fit in the following items: (1) the course of disease was greater than or equal to 8 weeks; (2) patients were in a stage of disease activity with wheal occurred every day or nearly every day; (3) patients volunteered to carry out autologous serum skin test. Patients were excluded in these conditions: (1) the enrolled patients were lactating women and pregnant women; (2) patients were diagnosed with drugs or food as allergens and with other inducible urticaria; (3) patients had severe immune system diseases of liver, kidney, cardio-cerebral vascular, and hematopoietic system and primary diseases; (4) patients systematically used glucocorticoids or immunosuppressive agents; (5) patients had family history of allergies and other systemic allergic diseases. Fourty healthy volunteers, including 19 females and 21 males with the average age of 37 years and without history of allergic diseases were selected as a control. This study was permitted by the ethics committee of the Second Hospital of Jilin University and patients all provided written informed consents.
2.5 Autologous serum skin test
Five mL of venous blood of each human subject was collected and placed in a sterile glass tube. The blood was centrifuged for 10 minutes at 580 × g with supernatant reserved. Histamine hydrochloride, normal saline and prepared autologous serum (each for 0.05 ml) were intradermally injected into flexor side of forearm respectively with the gap between wheals being 5 cm. Histamine was used as the positive control and normal saline as the negative control. At 40 minutes after injection, a specific man read the result, used a black marker to mark the sideline of three fine wheals and pasted them in a paper by using scotch tape, and measure the maximum diameter (d1) and the vertical diameter (d2) of wheals. Wheal diameter equals to (d1 + d2)/2.
2.6 Serum globulin assay
Five milliliters of peripheral blood of patients in the CIU and control groups were collected. Two milliliters of them were used for the detection of immunoglobulin. The contents of serum immunoglobulin IgG, IgM, and IgA were determined by using immunoturbidimetric method. The contents of serum immunoglobulin IgG, IgM, and IgA of the subjects in the two groups were measured by using the OlympusAU680 automatic biochemical analyzer (Beckman Coulter, Inc; Kraemer Boulevard Brea, CA).
2.7 Immunohistochemistry
Parts of skin tissue of the subjects were collected, fixed by 4% paraformaldehyde, dehydrated by gradient ethanol and normal butanol and sliced into 5 μm sections. Afterward, the sections were supplemented with 100 μL 5% bovine serum albumin, 100 μL primary antibody THBS1 (1:200; ab93653; Abcam Inc., Cambridge, MA) and biotin-labeled goat anti-rabbit secondary antibody working solution (1:100; HY90046; Hengyuan Biological Technology Co Ltd, Shanghai, China), and streptomycin anti biotin peroxidase solution (Zhongshan Biotechnology Co, Beijing, China). Next, the sections were developed by using diaminobenzidine (Bioss Biotech, Beijing, China). After soaked in hematoxylin for 5 minutes, the sections were socked in 1% hydrochloric ethanol for 4 seconds. Under high power lens, Image-Proplus (Media Cybernetics Inc., Rockville, MD) was used for the average optical density (OD) of positive THBS1. The criterion for judging protein positive cells: the normal positive cells are brownish yellow.21 The criterion for judging positive protein expression was as follows: each section was randomly selected with five high magnification field, 100 cells in per field were counted, and the positive cells were rated according to its percentage. The positive expression rate was positive sample size/total sample size.
2.8 Enzyme-linked immunosorbent assay
Referring to the instructions of ELISA kit (Thermo Fisher Scientific, Sunnyvale, CA,), the OD value was evaluated at the wavelength of 450 nm by using the enzyme-linked immunosorbent assay (ELISA) instrument (Synergy 2, Bio Tek, VT) within 3 minutes. Standard curves was drawn in accordance with the OD value. The contents of C5a (ab193695), C3 (ab108822), C4 (ab108824), CRP (ab99995), IL-4 (ab215089), interferon γ (IFN-γ; ab46025), and IgE (ab195216, all from Abcam) of peripheral blood of CIU were analyzed. And the content of IL-6 (ab46027), IL-8 (ab46032), IL-1β (ab46052), and TNF-α (ab181421) in the supernatant of mast cells was also studied.
2.9 Dual-luciferase reporter gene assay
Whether there were binding sites for miR-194 and THBS1 was predicted by the biological website microRNA.org, and luciferase reporter method was used to testify that THBS1 was a miR-194 target. Fragments of synthetic THBS1 3′UTR were introduced into pMIR-reporter (Huayueyang Biotechnology Co, Ltd, Beijing, China) by using restriction enzyme sites SpeI and Hind III. The target fragments were inserted into the report plasmid of pMIR-reporter by using T4 DNA ligase. The sequenced luciferase reporter plasmids wild type and mutant type were cotransfected with miR-194 respectively to HEK-293T cells (Beinuo Biotechnology Co, Ltd, Shanghai, China). At 48 hours posttransfection, the cells were collected and lysed. Luciferase detection kit was applied to detect luciferase activity. Each reaction was run in 3 times.
2.10 Cell isolation and culture
In sterile condition, the prepuce of children (aged 1-9 years) underwent circumcision was taken to prepare a mixed cell suspension containing mast cells that could survive and maintain function. After the blood on the skin was washed with saline, the skin section was immediately placed in the RPMI 1640 nutrient solution with the subcutaneous tissue removed. After being washed by modified Tyrode liquid, the prepuce was sectioned into tissue fragments with the size of about 1 mm2 which were placed in RPMI 1640 medium. After detachment, the digestive solution was repeatedly triturated with a straw, and the tissue was dispersed to make a cell suspension. The suspension was filtered with a stainless-steel filter (150-mesh) to remove tissue fragments and larger cell precipitations. The filtrate was collected, washed by Tyrode, resuspended in RPMI 1640 medium. HDMECs were incubated in DMEM medium containing 10% fetal bovine serum. When HDMECs grew to 75% to 85% confluence, they were subcultured. The liquid was changed every two to 3 days.
2.11 Cell grouping and transfection
The mast cells were transduced with miR-194 NC sequence, miR-194 mimic, miR-194 inhibitor, or siRNA-THBS1 (GenePharma Ltd Company, Shanghai, China). At 1 day before transfection, the cell was passaged, seeded into six-well plate with each well containing 1 × 10⁵ cells. On the transfection day, cell confluence reached 70% to 80%. Cells were transfected on account of the protocols of Lipofectamine 2000 transfection reagent (11668-019; Invitrogen, New York, CA). At 6 to 8 hours after incubation, the medium was renewed with a complete medium. After 24 to 48 hours of culture, subsequent experiment was conducted. At 8 to 10 hours after transfection, cellular cover slides of each group were taken out, fixed by 70% glycerol and placed under a fluorescence microscope (FM-400; Pudan Optical Instrument Co Ltd, Shanghai, China) for detecting the transfection efficiency.
2.12 Mast cell degranulation assay
The mast cell suspension was appended to the carrier plate. The mast cells were observed with an inverted microscope at a rate of 100 times, and they were divided into normal granule and degranulation. The shapes of mast cells were mainly round or oval. The cytoplasm was full of particles and the outline of the cells was clear. Thus, normal mast cell has a shape of round or oval, a clear outline, and cytoplasm filled with high refractive index particles. On the contrary, if the outline of the cell was not clear and the efflux of cytoplasm scattered on the surface of the cell, the granule belonged to degranulated mast cells. The degranulation rate of mast cells (%) = (the number of degranulated mast cell /total number of mast cell) × total number of cells.
2.13 Histamine release assay
The samples were added with trichloroacetic acid, and the concentration of histamine was determined by fluorescence measurement. The internal and external standard curves of histamine were drawn, and the histamine content in samples was calculated by the standard curve. Release rate of histamine = content of histamine in supernatant/(histamine content in supernatant + histamine content in cells) × 100%.
2.14 Detection of vascular permeability in vitro
HDMECs were placed in a Transwell culture medium (Corning, NY) coated with gelatin to a confluent monolayer. After 48 hours, the integrity and homogeneity of endothelial monolayer were observed by a microscopy. The confluent monolayers were incubated with transfected mast cells following its activation by the supernatant for 18 hours. FITC-conjugated dextran (1 mg/mL; Sigma-Aldrich Corp., St Louis, MO) was appended to the apical chambers, and fluorescence in the basolateral chamber was measured with a fluorescence reader.
2.15 Reverse transcription quantitative polymerase chain reaction
The total RNA extraction was carried out by Trizol (15596-018; Invitrogen, New York, CA) assay. Referring to the specification of Primescript TMRT Reagent Kit (RRO37A; TaKaRa Biotechnology Co Ltd, Liaoning, China), the RNA of the samples was reversely transcribed into complementary DNA (cDNA). The cDNA was taken for reverse transcription quantitative polymerase chain reaction (RT-qPCR) on account of the specification of SYBR Premix Ex Taq™ II Kit (TaKaRa Biotechnology Co Ltd, Liaoning, China). The internal reference for miR-194 was U6 and that of the other primers was glyceraldehyde-3-phosphate dehydrogenase (GAPDH). The primer sequences (Wuhan Bio Just biological company, Wuhan, China) were shown in Table 1. The suggested the ratio of the target gene expression.22 The experiment was repeated triplicate independently.
| Genes | Primer sequence (5′-3′) |
|---|---|
| miR-194 | F: GCCCGCTGTAACAGCAACTCCAT |
| R: GTGCAGGGTCCGAGGT | |
| THBS1 | F: AGACTCCGCATCGCAAAGG |
| R: TCACCACGTTGTTGTCAAGGG | |
| TGF-β | F: TGTGACTGGGAAGGCAATTTCA |
| R: CGCCCACACCACGACA | |
| smad3 | F: TGGACGCAGGTTCTCCAAAC |
| R: CCGGCTCGCAGTAGGTAAC | |
| IL-4 | F: GCGGATCCAATCGACACCTATTAATG |
| R: CGAAGCCTCATAAATTAAAATATTCAGC | |
| IFN-γ | F: CCCTCTCTGGCTGTTACTGC |
| R: CTCCTTTTCCGCTTCCTTAG | |
| U6 | F: CTCGCTTCGGCAGCACA |
| R: AACGCTTCACGAATTTGCGT | |
| GAPDH | F: TTGGTATCGTGGAAGGACTCA |
| R: TGTCATCATATTTGGCAGGTT |
- Abbreviations: GAPDH, glyceraldehyde-3-phosphate dehydrogenase; IL-4, interleukin 4; IFN-γ, interferon-γ; miR-194, microRNA-194; RT-qPCR, reverse transcription quantitative polymerase chain reaction; TGF-β, transforming growth factor β; THBS1, thrombospondin 1.
2.16 Western blot analysis
The tissues or cells were added with 1 mL tissue lysate. The supernatant of each sample was taken to detect the protein concentration by using bicinchoninic acid kit (20201ES76; Yeasen Biotechnology Co Ltd, Shanghai, China). Then, the 10% SDS separation gel and 4% concentration gel were prepared. Then, the proteins were transferred to the nitrocellulose membrane. The membrane was blocked by 5% skimmed milk and incubated with diluted primary antibody rabbit anti-polyclone antibody THBS1 (1:1000; ab1823), TGF-β (1:500; ab92486), smad3 (1:1000; ab40854), p-smad3 (1:2000; ab52903), IL-4 (1:1000; ab62351) (Abcam), and IFN-γ (1:1000; sc-373727; Santa Cruz Biotechnology, Shanghai, China). The membrane was appended with the secondary antibody horseradish peroxidase-conjugated goat antirabbit IgG (1:1000; Boster Biological Technology Co Ltd, Hubei, China). Then, the membrane soaked in enhanced chemiluminescence reaction liquid (Pierce, Waltham, MA). GAPDH was used as internal reference, and the protein expression was presented by the ratio of the gray value of the target protein band to the internal reference band.
2.17 Statistical analysis
Statistical analyses were conducted by using SPSS 21.0 (IBM-SPSS, Inc., Chicago, IL). Mean value ± standard deviation was the form of measurement data. Differences between two groups were compared by t-test, while the differences among multiple groups were compared by one-way analysis of variance. P < 0.05 presented significantly different.
3 RESULTS
3.1 Hsa-miR-194 is most likely to directly regulate THBS1
The GEO database was used to retrieve CIU-related microarray data and finally, the data of GSE57178 microarray data was obtained. The gene expression in the CIU samples and normal control samples in the microarray data were analyzed. At last, 38 DEGs were obtained, and heat map of these DEGs was drawn (Figure 1A). It was found that most of these DEGs were highly expressed in CIU samples. To further screen the core genes from these DEGs, the STRING database was used to analyze the 38 DEGs and to construct the gene interaction network (Figure 1B). The results showed that THBS1, TIMP1 (MMP12), ICAM1, and VCAM1 were at the core location. Among those important DEGs, THBS1 gene expression was the highest in CIU samples. The KEGG database was used to further retrieve the THBS1-related pathway. It was found that the THBS1 was located in the upstream of the TGF-β pathway (map 04350). Actually, TGF-β signaling pathway was previously demonstrated to be involved in CIU,23-25 which further proved that THBS1 might play a key role in CIU. With the aim to further elucidate the upstream regulatory pathway of THBS1, five databases were searched for predicting the miRNA regulated by THBS1. The results for intersection of the predicted results (Figure 1C) showed that three miRNAs were found in the intersection of the five databases, which are hsa-let-7a, hsa-miR-18a, and hsa-miR-194, respectively. To screen the miRNA that was most likely to regulate THBS1 from these three miRNAs, the microRNA.org database was used to predict the binding capacity of THBS1 and these three miRNAs (Table 2). The prediction results presented that the hsa-miR-194 had the lowest MirSVR score among these three miRNAs, suggesting that hsa-miR-194 was most likely to regulate THBS1 directly. To sum up, these results and previous reports suggested that miR-194 can modulate the TGF-βpathway by regulating the THBS1 and ultimately affecting the development of CIU.
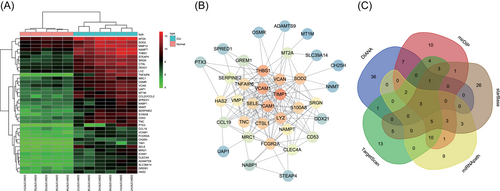
Hsa-miR-194 is most likely to directly regulate THBS1. A, Heat map of the first 30 differentially expressed genes in the GSE57178; X-axis represented sample number, Y-axis represented gene names, the dendrogram on the top showed the sample type clustering, the vitta on the top represented sample types, the dendrogram on the left suggested the gene expression clustering, each box in the graph suggested the gene expression in one sample, and the histogram on the upper right represented the color gradation. B, Interaction network of differential genes, each circle represented a gene, and the size and color of the circle represented the core level of the gene. The larger the circle and the darker the color was, the higher the core level the gene had in the network. C, Prediction of miRNA regulated THBS1, different color regions represented the results of different database prediction, the cross sections of all databases represented the intersection of databases, and the middle part represented the intersection of the five databases. miRNA, microRNA; THBS1, thrombospondin 1
| miRNA | Gene | mirSVR score | PhastCons score |
|---|---|---|---|
| hsa-let-7a | THBS1 | −0.1625 | 0.687 |
| hsa-miR-18a | THBS1 | −0.4405 | 0.6161 |
| hsa-miR-194 | THBS1 | −0.8395 | 0.5883 |
- Abbreviations: miRNA, microRNA; mRNA, messenger RNA.
- Note: mirSVR score represented thermodynamic stability (the requirement was less than −0.1), the lower the score was, the higher the miRNA-mRNA binding stability was, and the greater the possibility of corresponding miRNA downregulated the gene. PhastCons score represented that the evolutionary conservation of gene untranslated regions in each species, and the more conservative the better.
3.2 CIU patients had obviously larger average diameter of wheal
To compare the wheals from different sources, we adopted autologous serum skin test. At 30 minutes after the skin injected with autologous serum, the average diameter of the wheals was measured. The average diameters of the wheal after serum skin test and wheal after normal saline skin test were larger in the CIU patients. Besides, the average diameter of the wheal after serum skin test was obviously larger than that of the wheal after normal saline skin test in the CIU group, while the average diameter of the wheal after serum skin test and that of the wheal after normal saline skin test were similar in the control group (Table 3). These findings suggested that the average diameter of the wheal after serum skin test was obviously larger than that after normal saline skin test in the CIU group.
| Source of wheals | Control group | CIU group | P |
|---|---|---|---|
| Serum | 0.64 ± 0.12 | 1.08 ± 0.09* | 0.001 |
| Histamine | 1.98 ± 0.34 | 2.07 ± 0.31 | 0.132 |
| Normal saline | 0.62 ± 0.09 | 0.78 ± 0.10* | 0.001 |
- Abbreviation: CIU, chronic idiopathic urticaria.
- Note: Statistical data were measurement data, expressed by mean ± standard deviation. Comparisons between two groups were conducted using t-test, n = 40 in the control group and n = 53 in the CIU group. The experiment is repeated three times.
- * P < 0.05, vs the control group.
3.3 Higher concentration of IgA and lower concentration of IgG and IgM are shown in CIU
As shown in Table 4, the concentration of IgA in the CIU patients increased significantly, while the concentration of IgG and IgM decreased remarkably (P < 0.05). It was suggested that subjects in the CIU group exhibited higher concentration of IgA and lower concentration of IgG and IgM.
| CIU group | Control group | P | |
|---|---|---|---|
| IgG | 10.12 ± 2.98 | 14.02 ± 3.07* | 0.001 |
| IgA | 2.23 ± 0.43 | 1.29 ± 0.47* | 0.001 |
| IgM | 1.39 ± 0.62 | 1.68 ± 0.75* | 0.044 |
- Abbreviations: CIU, chronic idiopathic urticaria; IgA, immunoglobulin A; IgG, immunoglobulin G; IgM, immunoglobulin M.
- Note: Statistical data were measurement data, expressed by mean ± standard deviation. Comparisons between two groups were conducted using t-test, n = 40 in the control group and n = 53 in the CIU group. The experiment is repeated three times.
- * P < 0.05, vs the control group.
3.4 The positive expression rate of THBS1 is significantly higher in CIU
The immunohistochemistry of skin tissues in the control and CIU groups are displayed in Figure 2. The positive expression rate of THBS1 in the control group was 20.00% and in the CIU group was 67.96%. The positive expression rate of THBS1 was higher in CIU patients (P < 0.05). The results showed that there was a significant promotion in the positive expression rate of THBS1 in the CIU group.

Patients with CIU present higher THBS1 positive expression rate. A, The immunohistochemistry image of the skin tissues in the control and CIU groups (×400). B, The comparison of THBS1 positive rate between the control group and the CIU group. *P < 0.05 vs the control group (the results were statistical data obtained from χ2 test, n = 40 in the control group; n = 30 in the CIU group, and the experiment is repeated three times). CIU, chronic idiopathic urticaria; THBS1, thrombospondin 1
3.5 Patients with CIU show serious inflammatory reaction
ELISA was used in our research to detect the expression of related inflammatory factors in peripheral blood of CIU patients. The expression of HA, C5a, C3, C4, CRP, IL-4, and IgE was increased in serum of the CIU patients, while the expression of IFN-γ was decreased (all P < 0.05) (Table 5).
| Control group | CIU group | P | |
|---|---|---|---|
| C5a, ng/mL | 24.67 ± 2.59 | 44.98 ± 6.46* | 0.001 |
| C3, g/L | 0.75 ± 0.25 | 1.25 ± 0.18* | 0.001 |
| C4, g/L | 0.22 ± 0.06 | 0.49 ± 0.09* | 0.001 |
| CRP, mg/dL | 0.22 ± 0.16 | 0.68 ± 0.19* | 0.004 |
| IL-4, ng/mL | 7.36 ± 1.46 | 48.52 ± 4.24* | 0.001 |
| IgE, ng/mL | 32.67 ± 6.33 | 120.02 ± 11.12* | 0.001 |
| IFN-γ, ng/mL | 16.87 ± 3.77 | 3.53 ± 0.27* | 0.001 |
- Abbreviations: CIU, chronic idiopathic urticaria; C5a, complement component 5a; C3, complement component 3; C4, complement component 4; CRP, C-reactive protein; IL-4, interleukin 4; IgE, immunoglobulin E; IFN-γ, interferon-γ.
- Note: Statistical data were measurement data, expressed by mean ± standard deviation. Comparisons between two groups were conducted using t-test, n = 40 in the control group and n = 53 in the CIU group. The experiment is repeated three times.
- * P < 0.05, vs the control group.
3.6 CIU tissues show higher expression of THBS1, TGF-β, Smad3, p-smad3, and IL-4 while lower expression of miR-194 and IFN-γ
The experiments were used in the current study to detect the expression of miR-194, IFN-γ, THBS1, TGF-β, Smad3, and IL-4 (Figure 3). Expression of miR-194 and IFN-γ in the CIU patients was significantly lower, while that of THBS1, TGF-β, Smad3, and IL-4 increased (all P < 0.05). Meanwhile, the protein expression of IFN-γ in the CIU patients was decreased, while that of THBS1, TGF-β, Smad3, smad3 phosphorylation, and IL-4 increased (all P < 0.05). The results suggested that the expression of THBS1, TGF-β, Smad3, smad3 phosphorylation, and IL-4 were higher while the expression of miR-194 and IFN-γ lower in the CIU tissues.
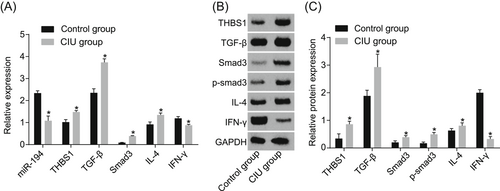
Increased expression of THBS1, TGF-β, smad3, p-smad3, IL-4, and decreased expression of miR-194 and IFN-γ in CIU patient tissues. A, Relative expression of miR-194, THBS1, TGF-β, smad3, IL-4, and IFN-γ in the control and CIU groups. B, Protein bands of THBS1, TGF-β, smad3, IL-4, and IFN-γ in the control and CIU groups. C, Statistical quantification of THBS1, TGF-β, smad3, p-smad3, IL-4, and IFN-γ in the control and CIU groups. *P < 0.05 vs the control group. Statistical data were measurement data, expressed by means ± standard deviation. Comparisons between two groups were conducted using t-test, n = 40 in the control group and n = 53 in the CIU group. The experiment is repeated three times. CIU, chronic idiopathic urticaria; IL-4, interleukin 4; TGF-β, transforming growth factor β; THBS1, thrombospondin 1
3.7 MiR-194 targets THBS1
There was a specific binding site between the THBS1 gene sequence and the miR-194 sequence, via the analysis of online software and THBS1 was the direct target gene of miR-194. Luciferase activity assay was used to confirm that THBS1 was the target gene of miR-194 in HEK-293T cells, and the experiment results implied that relative to the NC group, the luciferase activity of Wt-miR-194/THBS1 was decreased in the miR-194 mimic group (P < 0.05), while no difference in luciferase activity in MT-miR-194/THBS1 (P > 0.05), implying that miR-194 can target THBS1 (Figure 4).
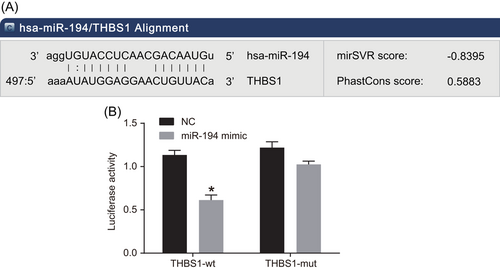
THBS1 is the target gene of miR-194. A, The predictive binding site for miR-194 in THBS1 3′-UTR. B, Luciferase activity detection. *P < 0.05 vs the NC group (the results were obtained from the two-way variance of analysis, N = 3, and the experiment was repeated three times). mut, mutant; NC, negative control; THBS1, thrombospondin 1
3.8 Overexpressed miR-194 and si-THBS1 decreases contents of IL-6, IL-8, IL-1β and TNF-α
The detection of related inflammatory factors in supernatant of mast cells is shown in Table 6. The contents of IL-6, IL-8, IL-1β, and TNF-α were lower in cells transfected with the miR-194 mimic, and si-THBS1, while were higher in cells introduced with the miR-194 inhibitor (all P < 0.05). In contrast to the miR-194 mimic and si-THBS1 groups, the contents of IL-6, IL-8, IL-1β, and TNF-α declined in the miR-194 mimic + si-THBS1 group (P < 0.05).
| Blank | NC | miR-194 mimic | miR-194 inhibitor | si-THBS1 | miR-194 mimic + si-THBS1 | |
|---|---|---|---|---|---|---|
| IL-6, pg/mL | 37.25 ± 4.41 | 39.87 ± 3.36 | 27.64 ± 2.12* | 53.79 ± 5.39* | 26.42 ± 1.96* | 12.20 ± 1.33*#& |
| IL-8, pg/mL | 281.29 ± 10.13 | 268.21 ± 15.14 | 160.68 ± 13.09* | 402.26 ± 17.34* | 176.67 ± 14.12* | 98.17 ± 9.04*#& |
| IL-1β, pg/mL | 403.63 ± 26.08 | 375.61 ± 31.05 | 233.29 ± 35.94* | 511.98 ± 39.00* | 221.31 ± 28.79* | 65.07 ± 10.53*#& |
| TNF-α, pg/mL | 142.07 ± 24.78 | 154.52 ± 22.09 | 91.45 ± 13.93* | 219.63 ± 18.88* | 86.11 ± 16.74* | 34.57 ± 12.87*#& |
- Abbreviations: NC, negative control; miR-194, microRNA- 194.
- * P < 0.05 vs the blank group.
- # P < 0.05 vs the miR-194-mimic group.
- & P < 0.05 vs the si-THBS1 group.
3.9 MiR-194 and si-THBS1 significantly reduce degranulation rate of mast cells
Mast cell degranulation assay was used to measure the degranulation rate of mast cells in each group (Figure 5). The degranulation rate was decreased in cells introduced with the miR-194 mimic, and si-THBS1 while that was enhanced in cells introduced with miR-194 inhibitor. In comparison to the miR-194 mimic and si-THBS1 groups, the degranulation rate of the miR-194 mimic + si-THBS1 group decreased (P < 0.05). We found that the degranulation rate of mast cells was significantly reduced after transfection of overexpressed miR-194.
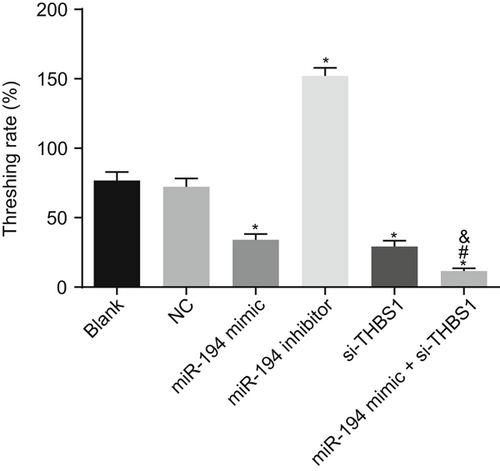
Mast cell degranulation detection shows that the degranulation rate was lower after transfection of overexpressed miR-194. *P < 0.05 vs the blank group; #P < 0.05 vs the miR-194 mimic group; &P < 0.05 vs the si-THBS1 group (the data were collected via the one-way variance of analysis, N = 3, and the experiment was repeated three times). CIU, chronic idiopathic urticaria; miR-194, microRNA-194; THBS1, thrombospondin 1
3.10 Mast cells transfected by miR-194 and si-THBS1 has reduced histamine release rate
Histamine release assay was used for the purpose of detecting the histamine release rate of mast cells in each group as shown in Figure 6. The histamine release rates of the miR-194 mimic, si-THBS1, and miR-194 mimic + si-THBS1 groups decreased, while that of miR-194 inhibitor group increased significantly relative to the blank group. Relative to the miR-194 mimic and si-THBS1 groups, the histamine release rate of the miR-194 mimic + si-THBS1 group reduced significantly (P < 0.05). These results implied that histamine release rate was significantly reduced by overexpressed miR-194 and si-THBS1.
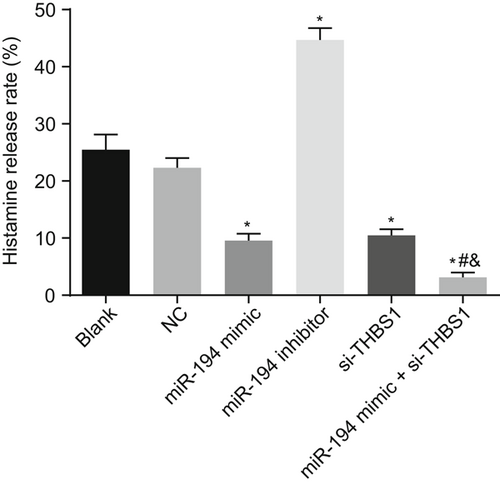
Overexpression of miR-194 and si-THBS1 decreased the histamine release rate. *P < 0.05 vs the blank group; #P < 0.05 vs the miR-194 mimic group; &P < 0.05 vs the si-THBS1 group (the data were collected via the one-way variance of analysis, N = 3, and the experiment was repeated three times). miR-194, microRNA-194; THBS1, thrombospondin 1
3.11 HDMECs transfected with miR-194 and si-THBS1 has reduced vascular permeability
HDMECs permeability test was used to detect the blood vascular permeability of each group (Figure 7). No difference was found in HDMECs permeability between the blank and the NC groups. HDMECs permeability was decreased in cells transfected with the miR-194 mimic and si-THBS1 while that was elevated in the cells introduced with miR-194 inhibitor. Relative to the miR-194 mimic and si-THBS1 groups, the HDMECs permeability of the miR-194 mimic + si-THBS1 group was lower (P < 0.05). It was suggested that the overexpression of miR-194 and si-THBS1 decreased HDMECs permeability.
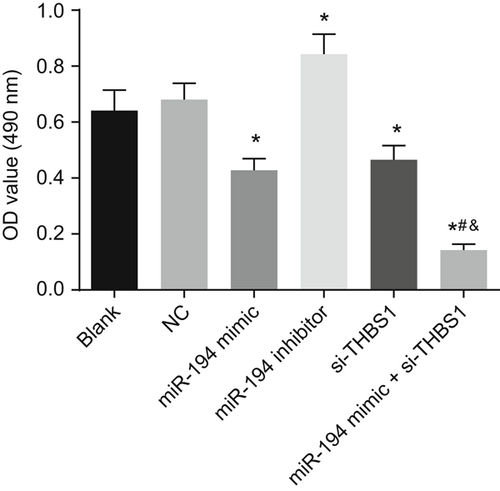
HDMECs permeability detection demonstrates that the vascular permeability is reduced obviously with overexpression of miR-194 and si-THBS1. *P < 0.05 vs the blank group; #P < 0.05 vs the miR-194 mimic group; &P < 0.05 vs the si-THBS1 group (the data were collected via the one-way variance of analysis, n = 3, and the experiment was repeated three times). miR-194, microRNA-194; THBS1, thrombospondin 1
3.12 The mRNA expression of IFN-γ is significantly increased, while that of THBS1, TGF-β, Smad3, and IL-4 is decreased significantly by overexpressed miR-194 and si-THBS1
The RT-qPCR (Figure 8) suggested that the expression of miR-194 increased in the cells transduced with miR-194 mimic and si-THBS1 while that in the cells transfected with miR-194 inhibitor decreased (P < 0.05). IFN-γ mRNA expression of cells transduced with miR-194 mimic and si-THBS1 was increased, while the mRNA expression of THBS1, TGF-β, Smad3, and IL-4 decreased significantly; the IFN-γ mRNA expression was decreased while the mRNA expression of THBS1, TGF-β, Smad3, and IL-4 mRNA increased in cells transduced with miR-194 inhibitor (P < 0.05). In comparison to the miR-194 mimic and si-THBS1 groups, the mRNA expression of IFN-γ was increased while that of THBS1, TGF-β, Smad3, and IL-4 was declined in the miR-194 mimic + si-THBS1 group (P < 0.05). Taken together, the results suggested that upregulated miR-194 and si-THBS1 improve the mRNA expression of IFN-γ and inhibit that of THBS1, TGF-β, smad3, and IL-4.
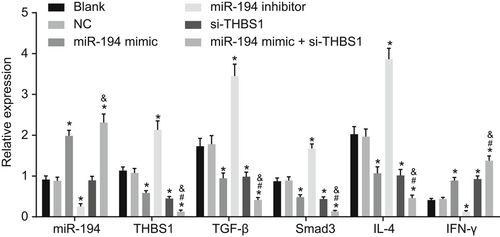
Upregulated miR-194 and downregulated THBS1 increase IFN-γ mRNA expression and decrease mRNA expression of THBS1, TGF-β, smad3, and IL-4. *P < 0.05 vs the blank group; #P < 0.05 vs the miR-194 mimic group. &P < 0.05 vs the si-THBS1 group (the data were collected via the one-way variance of analysis, n = 3, and the experiment was repeated three times). IFN-γ, interferon-γ; IL-4, interleukin 4; miR-194, microRNA-194; RT-qPCR, reverse transcription quantitative polymerase chain reaction; TGF-β, transforming growth factor-β; THBS1, thrombospondin 1
3.13 Upregulated miR-194 and downregulated THBS1 increase protein expression of IFN-γ while decrease that of THBS1, TGF-β, Smad3, smad3 phosphorylation, and IL-4
The protein expression of related proteins in mast cells was determined (Figure 9). IFN-γ protein expression in cells transduced with miR-194 mimic and si-THBS1 was higher while that of THBS1, TGF-β, Smad3, smad3 phosphorylation, and IL-4 was lower; the protein expression of IFN-γ reduced obviously while that of THBS1, TGF-β, Smad3, smad3 phosphorylation, and IL-4 increased in the cells transfected with miR-194 inhibitor (P < 0.05). Relative to the miR-194 mimic and si-THBS1 groups, the protein expression of IFN-γ increased significantly, while that of THBS1, TGF-β, Smad3, smad3 phosphorylation, and IL-4 declined in the miR-194 mimic + si-THBS1 group (P < 0.05). The results revealed that miR-194 and si-THBS1 can promote the protein expression of IFN-γ while impeded that of THBS1, TGF-β, Smad3, p-Smad3, and IL-4.
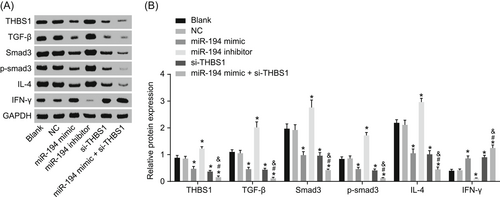
Overexpression of miR-194 and si-THBS1 increase protein expression of IFN-γ and reduce expressions of THBS1, TGF-β, Smad3, Smad3 phosphorylation, and IL-4. A, Gray value analysis of THBS1, TGF-β, Smad3, Smad3 phosphorylation, IL-4, and IFN-γ. B, Protein expression of THBS1, TGF-β, Smad3, Smad3 phosphorylation, IL-4, IFN-γ, and GAPDH examined by Western blot analysis. *P < 0.05 vs the blank group; #P < 0.05 vs the miR-194 mimic group; &P < 0.05 vs the si-THBS1 group (the data were collected via the one-way variance of analysis, n = 3, and the experiment was repeated three times). GAPDH, reduced glyceraldehyde-phosphate dehydrogenase; IFN-γ, interferon-γ; IL-4, interleukin 4; THBS1, thrombospondin 1; TGF-β, transforming growth factor β
4 DISCUSSION
CIU is a kind of complex dermatopathy characterized by red bumps and/or welts that is itching for more than 6 weeks.14 The pathogenesis of CIU is not clear; the only treatment it adopted is palliative because it does not depend on pathological mechanism and the critical pathophysiological events are well developed.26 MiR-194, a tumor suppressor that has the function of inhibiting cell proliferation, is an essential part in numerous pathological and physiological processes and its overexpression can repress tumor growth.10 The findings in our study demonstrated that miR-194 decreased inflammation and vascular permeability through TGF-β/SMAD pathway by inhibiting THBS1 so as to provide new idea for the treatment of CIU.
Initially, our experiment found that wheals in patient with CIU showed longer diameter. Besides, patients with CIU had higher concentration of IgA and lower concentration of IgG and IgM, and higher positive expression rate of THBS1. IgA functions as an essential mediator of intestinal immunity and a predominant antibody isotype.27 It was previously reported that an uncommon urticaria-like neutrophilic dermatosis serves as a sign of the presence of IgA myeloma.28 Besides, a former study found that IgA was remarkably increased in helicobacter pylori-infected chronic urticaria thus implicating in immune responses to Helicobacter pylori infection,29 which shares similar trends to our experiment. IgG is a main choice of cancer treatment, particularly in patients with metastatic or advanced cancers.30 In a previous research, scientists found that the level of IgG1 and IgE were lower in patients with chronic urticaria caused by raw fish.31 It was also reported that the level of IgM was lower in patients with primary Sjogren's syndrome, a disorder that exhibited urticaria of legs, thus inducing lymphoplasmacytic lymphoma.32 TGF-β is a potent IgA isotype switching factor, and INF-γ inhibited TGF-β-induced germ-line α transcription, and could also inhibit IgA secretion by TGF-β-induced murine B cells33, 34 It is reported that TGF-β treatment promoted SMAD3 phosphorylation, and overexpression of SMAD3 contributed to a significant decrease in IFN-γ gene expression.35 THBS1 (thrombospondin 1/TSP-1) was the first identified endogenous angiogenesis inhibitor.36 A former research demonstrated that THBS1 treatment has the function of promoting cytosolic Ca2+ in mast cells.37 What worth mentioning is that from the screen of relative gene and prediction of miRNA, we found that miR-194 could regulate THBS1, thereby regulating the TGF-β and influencing the development of CIU.
In the subsequent experiments, we found that the IFN-γ expression decreased while the expression of THBS1, TGF-β, Smad3, smad3 phosphorylation, and IL-4 increased in patients with CIU. Also, the expression of miR-194 and IFN-γ reduced while the expression of THBS1, TGF-β, Smad3, smad3 phosphorylation, and IL-4 promoted. Besides, we also found that miR-194 could target at THBS1. It was demonstrated that cytokines like IFN-γ and IL-4 have the function of stimulating proliferation and regulation differentiation and apoptosis of inflammatory cells.38 TGF-β, which is implicated in urticaria pathogenesis, functions as an anti-inflammatory cytokine.24, 25 Smad proteins serve as a critical role in signal transduction of TGF-β, which stimulates a series of cellular responses.39 We reported that miR-194 could inhibit the activation of TGF-β/SMAD pathway. A former study also found that the TGF-β/SMAD pathway could be downregulated by miR-629,40 suggesting that miRNA is correlated to TGF-β/SMAD pathway.
Furthermore, we observed that cells introduced with miR-194 mimic or si-THBS1 exhibited decreased contents of IL-6, IL-8, IL-1β, and TNF-α, suggesting that overexpression of miR-194 could alleviate inflammatory reaction. In addition, it was observed that miR-194 and si-THBS1 could reduce the degranulation rate, histamine release rate, and HDMECs permeability of CIU mast cells. Proinflammatory cytokines like TNF-α and IL-6 are implicated in inflammation in autoimmune and infectious disease initiation and progression including CIU by activating inflammatory cells and regulating cell differentiation and apoptosis.24, 25 Proinflammatory cytokines, induced by activating macrophages and monocytes, may stimulate T and B lymphocytes, natural killer cells, and neutrophils, thus elevating the biosynthesis of prostaglandins and acute-phase proteins.41 TNF-α was upregulated in endothelial and perivascular cells of the upper dermis in CIU inducing neuroendocrine disturbance and susceptibility to CIU, which may be induced by environmental stimulus.42 A former research presented that overexpressed miR-497 reduces vascular permeability.43 Another study demonstrated that upregulated miR-21 could decrease vascular permeability in mouse kidneys.44 A study proposed that the overexpressed miR-138 can not only ease the suffering of human coronary artery but also allay inflammatory response.45 Above documents demonstrated that miRNAs have its role to play in HDMECs and inflammatory response, which confirmed our experiment results.
5 CONCLUSION
To conclude, the results of this study have shown that miR-194 negatively regulates THBS1 and contributes to the inactivation of TGF-β/SMAD pathway, and further improving the inflammatory response of CIU mast cells and the permeability of HDMECs (Figure 10). Thus, miR-194 can provide a theoretical basis for treating CIU. However, further studies are needed to draw firmer conclusions regarding the function of miR-194 in the treatment of CIU.
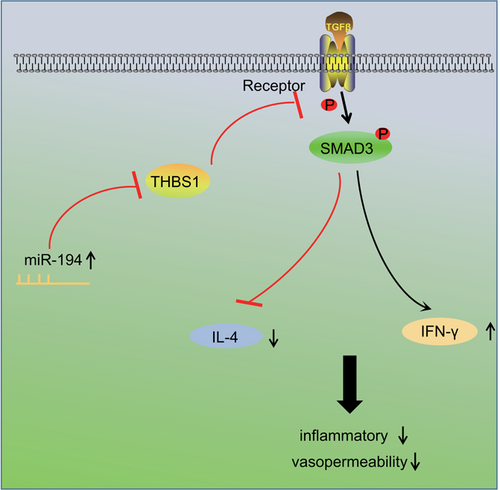
Mechanism involved in miR-194 regulation of CIU by targeting THBS1 through TGF-β/SMAD pathway. Overexpressed miR-194 can negatively regulate THBS1, inhibit the activation of TGF-β/SMAD pathway and the release of IL-4, promote the expression of IFN-γ, thus alleviating inflammatory response and HDMECs permeability of CIU mast cells. CIU, chronic idiopathic urticaria; IFN-γ, interferon-γ; IL-4, interleukin 4; miR-194, microRNA-194; TGF-β, transforming growth factor β; THBS1, thrombospondin 1
ACKNOWLEDGMENTS
We acknowledge and appreciate our colleagues for their valuable efforts and comments on this paper.
CONFLICT OF INTERESTS
The authors declare that there are no conflict of interests.
AUTHOR CONTRIBUTIONS
SQ and LY designed the study. ZL, SQ, and LY collated the data, designed and developed the database, carried out data analyses, and produced the initial draft of the manuscript. ZL contributed to drafting the manuscript. All authors have read and approved the final submitted manuscript.


