P-Glycoprotein Inhibition Sensitizes Human Breast Cancer Cells to Proteasome Inhibitors
ABSTRACT
Although effective for the treatment of hematological malignancies, the FDA approved proteasome inhibitors bortezomib and carfilzomib have limited efficacy in solid tumors including triple negative breast cancer (TNBC). Chemotherapy is the only option for treating TNBC due to the absence of specific therapeutic targets. Therefore, development of new TNBC therapeutic strategies has been warranted. We studied whether P-glycoprotein (P-gp) inhibition could sensitize TNBC cells to proteasome inhibitors. When verapamil, a P-gp inhibitor, was combined with the proteasome inhibitor MG132, bortezomib, or carfilzomib, the cytotoxic effects and apoptosis in TNBC MDA-MB-231 cells were enhanced, compared to each treatment alone. Furthermore, addition of verapamil improved proteasome-inhibitory properties of MG132, bortezomib, or carfilzomib in MDA-MB-231 cells, as shown by the increased accumulation of ubiquitinated proteins and proteasome substrates such as IκBα and p27kip1. Additionally, when nicardipine, another P-gp inhibitor, was combined with bortezomib or carfilzomib, enhanced inhibition of MDA-MB-231 cell proliferation was observed. These findings indicate that P-gp inhibitors could sensitize TNBC cells to structurally and functionally diverse proteasome inhibitors and might provide new treatment strategy for TNBC. J. Cell. Biochem. 118: 1239–1248, 2017. © 2016 Wiley Periodicals, Inc.
Triple negative breast cancer (TNBC) is characterized by the absence of estrogen receptor (ER), progesterone receptor (PR), and human epidermal growth factor receptor type 2 (HER2) [Foulkes et al., 2010]. TNBC is an aggressive form of breast cancer with poor prognosis and tendency for metastasis. It occurs in younger women and comprises almost 15% of all breast carcinoma [Elias, 2010]. Currently, chemotherapy is the only available treatment for TNBC, which necessitates the urgent need for development of new treatment strategies [Elias, 2010; Tseng et al., 2012].
Validation of the ubiquitin-proteasome system as a therapeutic target in cancer has led to the design and development of proteasome inhibitors as a treatment strategy [Adams, 2004]. As a result, bortezomib was approved by the United States Food and Drug Administration (US FDA) for the treatment of multiple myeloma and mantle cell lymphoma [Buac et al., 2013]. It is a reversible inhibitor that essentially targets proteasomal chymotrypsin (CT)-like activity [Adams et al., 1998]. Unfortunately, many patients have shown either intrinsic or acquired resistance to bortezomib [Mujtaba and Dou, 2011]. In addition, bortezomib, as a single agent or in combination, has limited scope for the treatment of solid tumors including breast cancer [Kondagunta et al., 2004; Shah et al., 2004; Yang et al., 2006; Engel et al., 2007]. Therefore, second generation proteasome inhibitors with relatively high specificity, potency and potential to overcome resistance to bortezomib were recently developed [Kuhn et al., 2007]. Carfilzomib, an irreversible proteasome inhibitor was approved by the US FDA for the treatment of multiple myeloma in July 2012, although its efficacy as a single agent in solid tumors, especially in breast cancer, has not yet been proven [Kortuem and Stewart, 2013].
Various studies have shown that the efficacy of proteasome inhibitors could be enhanced by combining them with other therapeutic agents [Davies et al., 2005; Berenson et al., 2006; Orlowski et al., 2007; Reece et al., 2008; Terpos et al., 2008; Kraus et al., 2013]. In an effort to find new therapeutic strategies for the treatment of TNBC, we investigated whether combinations with P-gp inhibitors could enhance the cytotoxicity of proteasome inhibitors in MDA-MB-231 cells. P-gp is an important member of the evolutionary conserved family of ATP-binding cassette (ABC) transporters [Higgins, 1992]. It is a transmembrane protein expressed in normal and cancer cells that acts as an energy dependent drug efflux pump and, therefore, could contribute to chemoresistance [Goldstein et al., 1992]. In this study, we reveal that when different classes of P-gp inhibitors (e.g., verapamil and nicardipine) are combined with structurally and binding mode-wise different classes of proteasome inhibitors (e.g., MG132, bortezomib, carfilzomib), the cytotoxic effects of proteasome inhibitors are enhanced with increased proteasome inhibition as well as induction of apoptosis in TNBC cells such as MDA-MB-231.
MATERIALS AND METHODS
REAGENTS
3-(4,5-Dimethylthiazol-2-yl)-2,5-diphenyltetrazolium bromide (MTT), dimethyl sulfoxide (DMSO), verapamil hydrochloride, and nicardipine hydrochloride were obtained from Sigma–Aldrich (St. Louis, MO). MG132 and bortezomib were obtained from Boston Biochem (Cambridge, MA), LC Laboratories (Woburn, MA). Carfilzomib was obtained from Investigational Pharmacy at Karmanos Cancer Center. DMEM/F12 (1:1), penicillin, and streptomycin were purchased from Invitrogen (Carlsbad, CA). Fetal bovine serum was purchased from Aleken biological (Nash, TX). Purified human 20S proteasome and Suc-LLVY-AMC as well asZ-LLE-AMC, the fluorogenic peptide substrate for the proteasomal CT and PGPH-like activity, respectively, were obtained from Calbiochem (San Diego, CA). CellEvent Caspase 3/7 green detection reagent was obtained from Invitrogen. Mouse monoclonal antibody against human poly (ADP-ribose) polymerase (PARP) was purchased from BioMol International LP (Plymouth Meeting, PA). Mouse monoclonal antibody against ubiquitin (P4D1), mouse monoclonal antibody against p27kip1, rabbit polyclonal antibody against IκBα (C-15), goat polyclonal antibody against β-actin (C-11), and secondary antibodies were purchased from Santa Cruz Biotechnology, Inc. (Santa Cruz, CA).
CELL CULTURE AND WHOLE CELL EXTRACT PREPARATION
Human breast cancer MDA-MB-231 and MDA-MB-468 cells were obtained from American type culture collection (Manassas, VA) and maintained in DMEM/F12 (1:1) supplemented with 10% fetal bovine serum, 100 units/ml penicillin, and 100 µg/ml streptomycin. The cells were maintained at 37°C and 5% CO2 in a humidified incubator. Preparation of a whole cell extract was done as described previously [An and Dou, 1996]. Briefly, after indicated treatments, cells were washed, centrifuged, and homogenized in a lysis buffer [50 mM Tris (pH 8.0), 150 mM NaCl, 0.5% NP40]. After rocking for 20 min at 4°C, the mixtures were centrifuged at 12,000g for 15 min at 4°C, and the resultant supernatants were collected as whole cell extracts.
CELL PROLIFERATION ASSAY
Five thousand cells/100 μl of cell culture media were plated in a 96-well plate.After overnight incubation, cells were then treated for 48 h with either vehicle control or various concentrations of test compounds as indicated in the figure legend. Percent relative cell proliferation was measured by 3-(4,5-dimethylthiazol-2-yl)-2,5-diphenyltetrazolium bromide (MTT) assay as described previously [Daniel et al., 2005].
CELLULAR MORPHOLOGY ANALYSIS
Cancer cells were plated and allowed to grow overnight, followed by indicated treatments. The morphological changes in the cells were observed using a Zeiss (Thornwood, NY) Axiovert 25 microscope with phase contrast.
CASPASE-3/7 DETECTION
CellEvent Caspase-3/7 green detection reagent (Invitrogen) was used to detect apoptotic cells. Briefly, cells were plated, allowed to grow overnight followed by indicated treatments for 24 h. CellEvent Caspase-3/7 green detection reagent was added to the plates and images were taken with fluorescence microscope.
WESTERN BLOT ANALYSIS
MDA-MB-231 cells were treated as indicated in the figure legends for 0–24 h. Whole cell extracts were prepared as described previously [An and Dou, 1996]. The cell lysates were separated by SDS–PAGE, transferred to a nitrocellulose membrane, and Western blot analysis was performed as described previously using specific antibodies for proteins of interest [An et al., 1998]. Enhanced chemiluminescence reagent (HyGLO reagent, Denville scientific, Metuchin, NJ) was used for its visualization.
PROTEASOMAL ACTIVITY ASSAY USING WHOLE CELL EXTRACTS
MDA-MB-231 cells were grown to 70–80% confluency and treated as indicated in the figure legend, harvested, and used for whole cell extract preparation. Cell extracts after each treatment were incubated at 37°C for 2 h with the fluorogenic substrate Suc-LLVY-AMC and production of hydrolyzed AMC groups was measured with the Wallac Victor3 multilabel counter with an excitation filter of 365 nm and emission filter of 460 nm. In another experiment, cell extracts from untreated MDA-MB-231 cells were incubated with indicated concentrations of verapamil for an hour at 37°C in an incubator. The fluorogenic substrates Suc-LLVY-AMC or Z-LLE-AMC for the proteasomal chymotrypsin or PGPH-like activity were added to the mixture and incubated for additional 2 h at 37°C. Production of hydrolyzed AMC groups was measured with the WallacVictor3 multilabel counter with an excitation filter of 365 nm and emission filter of 460 nm.
PURIFIED 20S PROTEASOME ACTIVITY ASSAY
Purified human 20S proteasome (35 ng) was incubated in 100 μl of assay buffer (50 mmol/L Tris–HCl, pH 7.5) with indicated concentrations of verapamil for an hour at 37°C in an incubator. The fluorogenic substrate Suc-LLVY-AMC (for the proteasomal chymotrypsin-like activity) was added to the mixture and incubated for an additional 2 h at 37°C. Production of hydrolyzed AMC groups was measured with the Wallac Victor3 multilabel counter with an excitation filter of 365 nm and emission filter of 460 nm.
STATISTICAL ANALYSIS
Statistical analyses were carried out with the R software package (Version 3.1.3) and were based on the parametric one-way ANOVA. The pair-wise post hoc t-test was applied and then adjusted by Holm's method for errors of multiplicity. The nonparametric one-way ANOVA using Kruskal–Wallis test, followed by Wilcoxon pair-wise post hoc procedures using Holm's method, was also applied as a reference. In general, the results of nonparametric methods were consistent with those of parametric methods. Box plot illustrations were used to depict the median values and interquartile ranges of %relative cell proliferation and were given without outliers and extreme values. P values of <0.05 were considered significant.
RESULTS
VERAPAMIL COMBINATION WITH MG132 SHOWS ENHANCED CYTOTOXICITY ACCOMPANIED BY INCREASED PROTEASOME INHIBITION
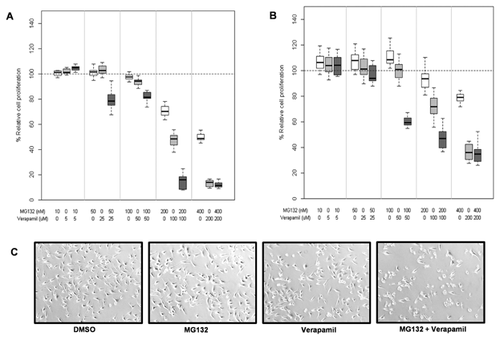
The objective of this study was to test whether combination of P-gp inhibitor, verapamil with proteasome inhibitors exerts enhanced cytotoxicity in TNBC cells. We exposed MDA-MB-231 cells to different concentrations of MG132 alone, verapamil alone, or their combination. It should be noted that MG132 is an earlier generation of proteasome inhibitor [Kisselev and Goldberg, 2001]. Results are depicted as box plots representing the median values and interquartile ranges of percentage relative cell proliferation of MDA-MB-231 cells exposed to MG132, verapamil, and combination, respectively (Fig. 1A). The combination of MG132 and verapamil (Mean ± SD of %relative cell proliferation, hereafter:59.30 ± 39.42) showed significantly increased levels of inhibition of cell proliferation in MDA-MB-231 cells, compared to each treatment alone (vs. MG132: 84.19 ± 20.88, adjusted P-value < 0.0001; vs. verapamil: 71.93 ± 36.12, adjusted P-value = 0.03). Similarly, the results show that the combination of MG132 and verapamil (67.95 ± 28.49) significantly increases inhibition of cell proliferation in MCF7 cells, compared to each treatment alone (vs. MG132: 100.54 ± 14.37, adjusted P-value < 0.0001; vs. verapamil: 83.20 ± 27.54, adjusted P-value = 0.0001; Fig. 1B). Furthermore, the combination treatment showed morphological changes indicating apoptosis in the MDA-MB-231 cells (Fig. 1C).
When MDA-MB-231 cells were treated with either 200 nM MG132 alone (Fig. 2A), 70 μM verapamil alone (Fig. 2B), or their combination (Fig. 2C), we observed significantly enhanced proteasome-inhibitory (increased levels of ubiquitinated proteins, p27 and IκBα) and apoptotic (PARP cleavage) effects in the combination setting, compared to each alone.
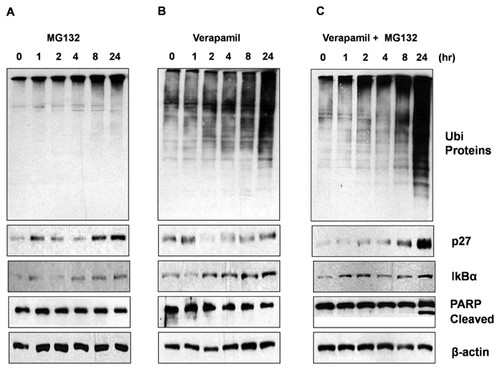
Accumulation of ubiquitinated proteins and proteasomal target proteins, p27 and IκBα by the verapamil treatment (Fig. 2B) suggests its proteasome-inhibitory potential. Along this line, we observed enhanced inhibition of proteasomal CT-like activity in MDA-MB-231 cells treated with bortezomib and verapamil combination, as compared to cells treated with each agent alone (data not shown). Further, verapamil inhibited the CT-like proteasomal activities in purified 20S proteasome and untreated cell extracts (data not shown).
ENHANCED CYTOTOXIC ACTIVITY OF BORTEZOMIB AND VERAPAMIL COMBINATION ON TNBC CELLS
We then tested if verapamil could potentiate proteasome-inhibitory properties of structurally different and US FDA approved proteasome inhibitors. First, we systematically compared the inhibitory effect of different concentrations of bortezomib and verapamil alone and their combinations in TNBC MDA-MB-231 cells by using the MTT cell viability assay. The combination of bortezomib and verapamil (54.10 ± 31.46) showed increased levels of growth inhibition in MDA-MB-231 cells, compared to each treatment alone, but the inhibition level of the combination was not significant compared to that of bortezomib (vs. bortezomib: 57.89 ± 25.25, adjusted P-value = 0.42; vs. verapamil: 76.11 ± 22.27, adjusted P-value < 0.0001; Fig. 3A). Importantly, bortezomib and verapamil co-treatment, specifically at the dose of 10 nM and 50 μM (51.87 ± 5.76), showed enhanced growth inhibition as compared to each treatment alone in this cell line (vs. bortezomib: 58.77 ± 4.80, adjusted P-value = 0.0006; vs. verapamil: 94.56 ± 5.30, adjusted P-value < 0.0001; Fig. 3A), supporting the idea that P-gp inhibition might sensitize these TNBC cells to proteasome inhibitors. We then tested whether the MDA-MB-231 cells treated with bortezomib and verapamil combination were undergoing apoptosis using the CellEvent Caspase-3/7 green detection reagent (Invitrogen). We detected more apoptotic cells after co-treatment with the combination of bortezomib and verapamil than each agent alone (Fig. 3B).
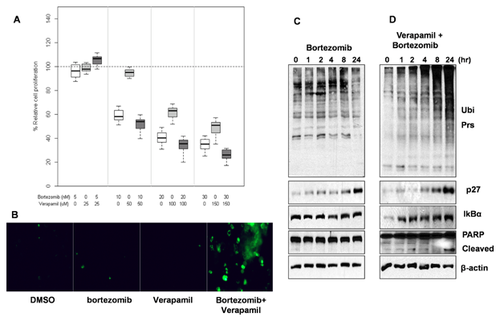
In order to deduce the mechanism for the enhanced cytotoxic activity, we studied the effect of the verapamil and bortezomib combination on proteasome substrates and apoptosis biomarkers. We observed increased accumulation of ubiquitinated proteins which indicates higher levels of proteasome inhibition after treatment with the combination (Fig. 3D) compared to verapamil (Fig. 2B) and bortezomib alone (Fig. 3C). It has been reported that inhibition of the NF-κB pathway is partially responsible for cytotoxic effect by bortezomib. It occurs through stabilization of the endogenous inhibitor, IκBα, a proteasome substrate, resulting in sequestration of NF-κB in the cytoplasm. This leads to prevention of transcriptional activation of NF-κB target genes [Orlowski and Baldwin, 2002; Orlowski and Kuhn, 2008]. Indeed, we observed that the combination treatment led to increased accumulation of proteasome substrates like IκBα and p27kip1 (Fig. 3D vs. 2B, 3C) that are involved in regulation of apoptosis via NF-κB pathway and cell cycle, respectively. Importantly, bortezomib and verapamil combination treatment for 24 h was able to induce apoptosis as indicated by PARP cleavage in MDA-MB-231 cells (Fig. 3D vs. 2B, 3C).
ENHANCED CYTOTOXIC ACTIVITY OF CARFILZOMIB AND VERAPAMIL COMBINATION ON TNBC CELLS
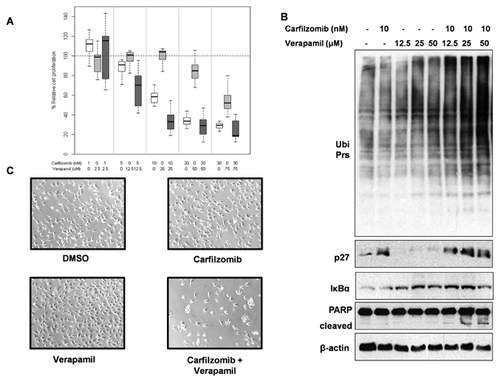
Carfilzomib is a second generation irreversible proteasome inhibitor recently approved by the US FDA for the treatment of relapsed and refractory multiple myeloma [Kuhn et al., 2011]. Overexpression of P-gp in cancer cells could be responsible for acquired resistance for carfilzomib [Verbrugge et al., 2012]. Also, P-gp was overexpressed in carfilzomib-resistant lung and colon cancer cell lines [Ao et al., 2012]. Therefore, we hypothesized that P-gp glycoprotein inhibition sensitizes solid tumor cells to carfilzomib. The box plots depict the median values and interquartile ranges of percentage relative cell proliferation of MDA-MB-231 cells exposed to carfilzomib, verapamil, and combination, respectively (Fig. 4A). The combination of carfilzomib and verapamil (51.87 ± 34.83) showed significantly increased levels of growth inhibition in MDA-MB-231 cells, compared to each treatment alone (vs. carfilzomib: 65.39 ± 32.09, adjusted P-value = 0.005; vs. verapamil: 86.41 ± 20.49, adjusted P-value < 0.0001). Furthermore, when 10 nM carfilzomib was combined with increasing doses of verapamil (12.5, 25, and 50 μM), we observed dose-dependent increase in levels of proteasome inhibition (enhanced accumulation of ubiquitinated proteins, IκBα and p27kip1 proteins) and apoptosis-associated PARP cleavage (Fig. 4B). Morphological changes, for example, round shaped, floating cells indicative of cellular apoptosis, were observed with carfilzomib and verapamil combination (at the 10 nM and 50 µM concentrations, respectively) in accordance with the PARP cleavage (Fig. 4B and C).
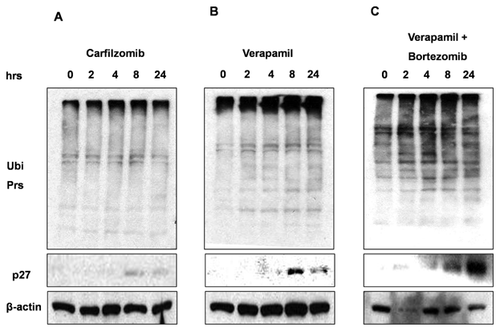
We further tested another TNBC cell line, MDA-MB-468 to study cytotoxic effects of carfilzomib and verapamil combination. Our results suggest that carfilzomib and verapamil combination in MDA-MB-468 cells show enhanced proteasome inhibition as indicated by increased accumulation of ubiquitinated proteins as well as p27kip1 proteins (Fig. 5C vs. A and B).
NICARDIPINE IN COMBINATION WITH BORTEZOMIB AND CARFILZOMIB SHOWS ENHANCED CYTOTOXICITY ACCOMPANIED BY INCREASED PROTEASOME INHIBITION
To find out whether the enhanced growth inhibition with bortezomib or carfilzomib is limited to verapamil, we combined these proteasome inhibitors with another P-gp inhibitor, nicardipine [Pascaud et al., 1998] that is structurally different than verapamil. Results are shown as box plots depicting the median values and interquartile ranges of percentage relative cell proliferation of MDA-MB-231 cells exposed to bortezomib, nicardipine, and combination, respectively (Fig. 6A). The combination of bortezomib and nicardipine (30.49 ± 32.06) showed increased levels of growth inhibition in MDA-MB-231 cells, compared to each treatment alone, but the inhibition level of the combination was marginally increased compared to that of nicardipine (vs. bortezomib: 50.22 ± 27.56, adjusted P-value = 0.005; vs. nicardipine: 45.29 ± 35.71, adjusted P-value = 0.06).

The box plot in Figure 6B depicts the median values and interquartile ranges of %relative cell proliferation of MDA-MB-231 cells exposed to carfilzomib, nicardipine, and combination, respectively. The combination of carfilzomib and nicardipine (31 ± 28) showed significantly increased levels of growth inhibition in MDA-MB-231 cells, compared to each treatment alone (vs. carfilzomib: 65 ± 32, adjusted P-value < 0.0001; vs. nicardipine: 51 ± 36, adjusted P-value = 0.0002).
We then tested the combinational effect on breast cancer SUM159 cells that are ER and PR-negative. We found that nicardipine, when combined with carfilzomib, showed enhanced inhibition of SUM159 cell proliferation as compared to each agent alone (data not shown).
Collectively, these findings indicate that different classes of P-gp inhibitors such as verapamil and nicardipine sensitize TNBC cells to structurally and binding mode-wise different classes of proteasome inhibitors like MG132, bortezomib, and carfilzomib.
DISCUSSION
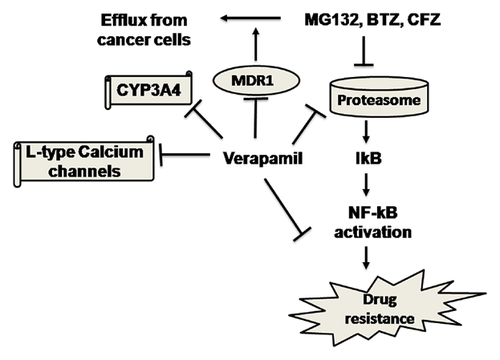
Previous studies have shown that P-gp-knock down using siRNA sensitizes P-gp-overexpressing K562/DOX cells to proteasome inhibitors like bortezomib and MLN273 [Minderman et al., 2007; Rumpold et al., 2007]. Interestingly, bortezomib has shown to be a weak substrate for P-gp [Rumpold et al., 2007]. It has also been reported that verapamil enhances bortezomib cytotoxicity in mantle cell lymphoma [Chen et al., 2012] and myeloma cells [Meister et al., 2010]. The available literature indicates that verapamil has multiple targets in cancer cells including but not limited to P-gp [Ford and Hait, 1990], CYP3A4 [Wang et al., 2004], and L-type calcium channels [Ford and Hait, 1990], but the exact mechanism for its anticancer activities is not clear. Therefore, multitude of mechanisms including but not limited to increase in intracellular drug concentration by inhibition of proteasome inhibitor efflux from cancer cells, inhibition of CYP3A4 resulting in inhibition of metabolism of proteasome inhibitors, and its own proteasome inhibitory properties potentially contribute to anticancer properties of verapamil.
Similarly, inhibition of proteolytic activities of proteasome might not be the only mechanism responsible for anticancer properties of proteasome inhibitors. Indeed, bortezomib targets diverse signaling pathways such as activation of c-Jun N-terminal kinase, inhibition of NF-κB, stabilization of p53, p21, and p27kip1, decreased levels of Bcl-2 and Bcl-xL, and down regulation of cellular inhibitor of protein phosphatase 2A [Suh and Goy, 2008; Tseng et al., 2012]. Interestingly, most of the proteasome inhibitors were developed to inhibit specific proteasomal activities (e.g., inhibition of CT-like activity by bortezomib), although inhibitors like marizomib inhibit all of the proteasomal activities [Lawasut et al., 2012]. Therefore, we wanted to test whether proteasomal-inhibitory activities of verapamil are limited to some specific proteasome subunit. Using the fluorescent probes for CT- and PGPH-like proteasomal activities, we found that verapamil directly inhibited CT-like as well as PGPH-like activities (data not shown). Similarly, another study indicated that verapamil inhibits proteasomal CT-like activity in ECV304 human bladder carcinoma cells [Fekete et al., 2005]. It should be noted that verapamil showed stronger inhibition of PGPH-like activity at lower doses than for CT-like activity (data not shown), suggesting that verapamil inhibits proteasome in a noncompetitive manner with bortezomib and carfilzomib and, therefore, might help to overcome resistance to clinical proteasome inhibitors. Clearly, verapamil enhances cytotoxic effects of proteasome inhibitors in TNBC cells like MDA-MB-231.
Overall, results of this study are in accordance with other researchers who showed that verapamil could potentially be used as a primary or adjuvant anticancer agent [Zhang et al., 2009]. Even though P-gp inhibitors have been effective in cell culture systems in vitro, reversal of multidrug resistance (MDR) in vivo warrants high serum concentrations of MDR modulating drugs, leading to toxicities and limiting their use in standard chemotherapy regimens [Fekete et al., 2005]. We are aware that verapamil doses that were used in this study are quite high, and cannot be achieved clinically without significant toxicity. Additionally, bortezomib, verapamil, and nicardipine can decrease blood pressure, so the patient doses should be adjusted if these combinations go to clinical trials [Zhou et al., 2005a; Chen et al., 2012]. Nonetheless, we provide here the proof of concept that P-gp inhibitors in combination with proteasome inhibitors have potential to be used for the treatment of solid tumors. Our data provides clear evidence that enhanced cytotoxicity in MDA-MB-231 cells is achieved when structurally and binding mode-wise different classes of proteasome inhibitors (e.g., MG132, bortezomib, and carfilzomib) are combined with different classes of P-gp inhibitors (e.g., verapamil, nicardipine).
Importantly, in this study, we have employed two different classes of drugs that are already approved by the FDA for clinical use. Pharmacokinetics and pharmacodynamics data for these drugs are readily available should these combinations go to clinical trials. This provides the advantage of shortening the hitherto lengthy process of approval for novel anticancer agents by US FDA. Also, drug design and discovery efforts could be taken to design more potent, less toxic P-gp inhibitors with minimal or no activity on calcium channels [Zhou et al., 2005b], devoid of the effects on cardiovascular system. The novel P-gp inhibitors could be combined with proteasome inhibitors to treat solid tumors.
Finally, as shown in the proposed model for enhanced cytotoxicity of proteasome inhibitors due to the concurrent use of P-gp inhibitors (Fig. 7), we are potentially targeting multiple mechanisms of chemoresistance, that is, prevention of (i) drug efflux; (ii) drug metabolism; and (iii) NF-κB pathway by combining P-gp inhibitors with proteasome inhibitors. In addition, the current study shows that proteasome might be another direct target for verapamil and proteasomal inhibition by verapamil might be contributing to the enhanced anticancer properties of proteasome inhibitors.
ACKNOWLEDGMENTS
This work has been partially supported by NCI R01 CA127258 (to QPD), NIH center grant P30 CA022453 (to Karmanos Cancer Center), and Thomas C. Rumble fellowship from Wayne State University (to Rahul R. Deshmukh).


