AQP2-Induced Acceleration of Renal Cell Proliferation Involves the Activation of a Regulatory Volume Increase Mechanism Dependent on NHE2
ABSTRACT
We have previously shown in renal cells that expression of the water channel Aquaporin 2 (AQP2) increases the rate of cell proliferation by shortening the transit time through the S and G2/M phases of the cell cycle. This acceleration is due, at least in part, to a down-regulation of regulatory volume decrease (RVD) mechanisms when volume needs to be increased in order to proceed into the S phase. We hypothesize that in order to increase cell volume, RVD mechanisms may be overtaken by regulatory volume increase mechanisms (RVI). In this study, we investigated if the isoform 2 of the Na+/H+ exchanger (NHE2), the main ion transporter involved in RVI responses, contributed to the AQP2-increased renal cell proliferation. Three cortical collecting duct cell lines were used: WT-RCCD1 (not expressing AQPs), AQP2-RCCD1 (transfected with AQP2), and mpkCCDc14 (with inducible AQP2 expression). We here demonstrate, for the first time, that both NHE2 protein activity and expression were increased in AQP2-expressing cells. NHE2 inhibition decreased cell proliferation and delayed cell cycle progression by slowing S and G2/M phases only if AQP2 was expressed. Finally, we observed that only in AQP2-expressing cells a NHE2-dependent RVI response was activated in the S phase. These observations suggest that the AQP2-increased proliferation involves the activation of a regulatory volume increase mechanism dependent on NHE2. Therefore, we propose that the accelerated proliferation of AQP2-expressing cells requires a coordinated modulation of the RVD/RVI activity that contributes to cell volume changes during cell cycle progression. J. Cell. Biochem. 118: 967–978, 2017. © 2016 Wiley Periodicals, Inc.
The Na+/H+ exchanger (NHE) plays an important role in a remarkable assortment of physiological processes, ranging from intracellular pH (pHi) homeostasis and epithelial salt transport to cellular volume regulation and cell proliferation [Orlowski and Grinstein, 2011; Donowitz et al., 2013; Fuster and Alexander, 2014]. Some of these events, such as cell proliferation, are closely associated with changes in cell volume [Lang et al., 2000, 2005]. In fact, previous reports indicate that factors that affect cell volume also have an effect on mechanisms that control cellular proliferation [Rouzaire-Dubois and Dubois, 1998; Kunzelmann, 2005]. It is well accepted that during progression through the cell cycle, cellular volume increases as a result of the accumulation of diverse substrates, protein synthesis, and DNA duplication [Kunzelmann, 2005]. This cell volume increase may be achieved by inhibition of regulatory volume decrease mechanisms (RVD) and/or by activation of regulatory volume increase (RVI) mechanisms. In line with this proposal, several reports demonstrate that, in many cell types, RVI mechanisms are up regulated during cell growth [Lang et al., 1991, 1998b; Ritter and Wöll, 1996] and that RVD capacity is actively modulated throughout the cell cycle [Chen et al., 2002; Wang et al., 2002; Di Giusto et al., 2012]. Other reports, in tumor ras-oncogene-expressing cells, suggest that both RVD and RVI mechanisms are necessary for cell cycle progression [Ritter and Wöll, 1996; Lang et al., 1998a]. Therefore, evidence indicates that cellular proliferation requires mechanisms for cell volume regulation, and thus the movement of ions and water. However, little is known regarding the sequence of events leading from cell volume changes to cell cycle progression.
The water channels Aquaporins (AQPs) have been proposed to play a key role not only in the control of cell volume but also in cell migration, proliferation, and apoptosis [Jablonski et al., 2004; Ford et al., 2005; Verkman, 2008; Flamenco et al., 2009; Rivarola et al., 2010; Shimizu et al., 2014; Galan-Cobo et al., 2015, 2016]. In renal cells, we have demonstrated that AQP2 enhances cell proliferation rate by a coordinate activation of specific RVD mechanisms in the G1 phase and their subsequent inhibition in the S phase of the cell cycle [Di Giusto et al., 2012]. What still remains unclear is whether activation of RVI mechanisms is also required to increase cell volume.
RVI is mainly accomplished by cellular NaCl uptake (Na+/H+ and Cl−/HCO3− exchangers acting in parallel) and the obligated water influx that leads to cell swelling [Lang et al., 2007]. Although to date four different NHEs isoforms have already been described in epithelia (NHE1–4), in renal cells NHE2 is the isoform proposed to be involved in cell volume increase. It has been demonstrated that hyperosmolality increases its mRNA expression [Soleimani et al., 1994]. Moreover, our group previously demonstrated that a hypertonic shock activates NHE2 function [Ford et al., 2002]. Bearing in mind these observations and those showing that NHE2 favors cell growth in CHO cells [Kapus et al., 1994], the aim of the present study was to investigate the putative link between AQP2 expression, NHE2 function, and RVI response during cell cycle progression. For this purpose, we used three renal cortical collecting duct cell lines: WT-RCCD1 that do not express renal aquaporins (AQPs), AQP2-RCCD1 that constitutively expresses AQP2 in the apical plasma membrane [Capurro et al., 2001; Ford et al., 2005], and mpkCCDc14 cells that modulate AQP2 expression upon exposure to AVP or its analogues [Hasler et al., 2002]. Our results showed that AQP2-expressing cells have a higher basal pHi, together with an increased NHE2 expression and increased NHE2 activity. In addition, only in the presence of AQP2, the inhibition of NHE2 reduced cell proliferation by slowing the transit through S and G2/M phases of the cell cycle. In S phase, an activation of a NHE2-mediated RVI response was observed only in AQP2-expressing cells. These results indicate that NHE2 and AQP2 would work in coordination as part of the cellular device that regulates collecting duct cell cycle progression.
MATERIALS AND METHODS
CELL CULTURE
RCCD1 cells, an epithelial cell line derived from rat renal cortical collecting duct, which maintains very high transepithelial resistance similar to that observed in the native tissue [Blot-Chabaud et al., 1996]. Two types of RCCD1 cells were used: WT-RCCD1 cells, which do not express aquaporin water channels [Capurro et al., 2001] and AQP2-RCCD1 cells, stably transfected with cDNA coding for rat AQP2 [Ford et al., 2005]. WT-RCCD1 cells were grown in a modified-DMEM (DM) medium (Dulbecco's modified Eagle's medium/Ham's F-12, 1:1 v/v; 14 mM NaHCO3, 2 mM glutamine; 50 nM dexamethasone; 30 nM sodium selenite; 5 μg/ml insulin; 5 μg/mL transferrin; 10 ng/ml epidermal growth factor; 50 nM triiodothyronine; 100 U/ml penicillin-streptomycin; 20 mM Hepes; pH 7.4) and 2% fetal bovine serum (Invitrogen, San Diego, CA) at 37°C in 5% CO2/95% air atmosphere [Blot-Chabaud et al., 1996]. AQP2-RCCD1 cells were maintained in DM medium containing Geneticin (200 μg/ml, Invitrogen) as previously reported [Ford et al., 2005]. All experiments were performed on WT- and AQP2-RCCD1 cells between the 20th and 40th passages.
The mpkCCDc14 cells (provided by A. Vandewalle and M. Bens, Institut National de la Santé et de la Recherche Médicale, Paris, France) were grown in flasks (passage 20–30th) in DM supplemented with 2% fetal calf serum (DM: DMEM-Ham's F12 at 1:1 vol/vol, 60 nM sodium selenate, 5 g/ml transferrin, 2 mM glutamine, 50 nM dexamethasone, 1 nM triiodothyronine,10 ng/ml epidermal growth factor, 5 g/ml insulin, 20 mM d-glucose, and 20 mM HEPES, pH 7.4) (4) at 37°C in 5% CO2–95% air atmosphere [Bens et al., 1999].
CELL CYCLE SYNCHRONIZATION
Cells were synchronized in the S phase of the cell cycle by the double-block technique, using thymidine as an inhibitor of DNA synthesis [Harper, 2005; Di Giusto et al., 2012]. WT-RCCD1, AQP2-RCCD1, or mpkCCDc14 cells in exponential growth were first exposed for 12 h to 2 mM thymidine. Cells were then released in fresh media for another 12 h, later followed by a second thymidine block for another 12 h.
CELL GROWTH MEASURES
For cell number counting of WT- and AQP2-RCCD1 cells were seeded on 24 polywell at 25 × 103 cells/ml densities, allowed to attach for 24 h, and then were grown in the different experimental conditions.
For cell number counting of mpkCCDc14 cells were seeded on 24 polywell at 2 × 10³ cells/ml densities in the presence of vehicle (water) or 100 μM dibutyryl cyclic AMP (dbAMPc), allowed to attach for 24 h, and then were grown in the different experimental conditions.
After incubation, cells were detached by trypsination, resuspended in PBS-trypan blue to exclude non-viable cells, and counted in a Neubauer hemocytometer.
CELL PROLIFERATION AND CELL CYCLE ANALYSIS BY FLOW CYTOMETRY
For dual parameter flow cytometry cells were pulsed with 20 μM of the thymidine analog 5-Bromodeoxyuridine (BrdU, Sigma–Aldrich, St. Louis) for 1 h. After removal of BrdU, cells were allowed to continue cycling in fresh media for a chase period of up to 6 h. Cells were then harvested and fixed in 70% ethanol. BrdU content was analyzed after DNA denaturation with 2N HCl plus 0.1% Triton X-100 at room temperature followed by neutralization with 0.1 M Na2B4O7 buffer, pH 8.5. The cells were labeled using specific anti-BrdU monoclonal antibodies (BD Biosciences, CA) and Cy2-conjugated secondary antibodies (Jackson Immuno, PA) and suspended in the presence of propidium iodide (PI, 50 μg/ml) and RNase A (1 mg/ml) in PBS for up to 4 h at 4°C in the dark. Bivariate histograms of BrdU/DNA content were obtained collecting Cy2 green fluorescence as a measure of BrdU positive cells (BrdU+) cells (log scale) and red PI fluorescence as a measure of DNA content (linear scale) for 30,000 events in each sample using a FACS Calibur flow cytometer (Becton-Dickinson, CA). Cell cycle compartments were calculated from bivariate histograms after doublets exclusion (Win MDI 2.8 Joseph Trotter, The Scripps Research Institute, CA). The transit times through the S phase (Ts) and the G2/M phase (TG2/M) were calculated as previously described [Begg et al., 1985; Baron and Penit, 1990].
CELL SURFACE BIOTINYLATION
Ninety to ninety-five percent confluent WT-RCCD1, AQP2-RCCD1, or mpkCCDc14 cells grown for 4 days in the presence of vehicle (−AQP2) or 100 μM dbAMPc (+AQP2) were washed three times in cold PBS and cell surface biotinylation was performed with a Cell Surface Protein Isolation kit (Pierce, IL) following the manufacturer's instructions. Briefly, the cells were rinsed with PBS and then biotinylated using EZ-Link Sulfo-NHS-SS-Biotin in PBS for 30 min on ice. After quenching, the cells were harvested and solubilized in Lysis Buffer and incubated for 30 min on ice. After centrifugation at 10,000g for 2 min at 4°C, the supernatant was added to Immobilized NeutrAvidinTM gel and incubated for 60 min at room temperature. After being washed, the biotinylated proteins were eluted in SDS/PAGE sample buffer containing 50 mM dithiothreitol.
WESTERN BLOT STUDIES
Immunoblotting experiments were carried out as previously described [Rivarola et al., 2010]. Briefly, total cell lysates or cell surface biotinylated membranes were subjected to 7.5% SDS-polyacriylamide minigels electrophoresis using the Tris-Tricine buffer system and then transferred to nitrocellulose membranes (Mini Protean II, Bio-Rad, Hercules, CA). Blots were blocked with 1% BSA and then probed using either rabbit polyclonal anti-NHE2 (dilution 1:300, Alfa Diagnostics International, TX), rabbit polyclonal anti-AQP2 (dilution 1:1000) generated against a peptide corresponding to amino acids 250–271 of rat AQP2, conjugated with keyhole limpet hemocyanin [Shi et al., 2001] or streptavidin-HRP (dilution 1:6000 DakoCytomation, Denmark). After being rinsed with PBS-Tween, membranes were incubated with the appropriate secondary antibody (anti rabbit or anti mouse IgG conjugated to horseradish peroxidase, dilution 1:25,000, Sigma–Aldrich A0545) and visualized using the chemiluminescence method (SuperSignal Substrate, Pierce). For densitometric quantification of biotinylated membranes from WT- and AQP2-RCCD1 cells or −AQP2 and +AQP2 mpkCCDc14 cells, samples were run in the same gel. Images were captured on a GBOX (Syngene, MD) and the bands corresponding to AQP2 (29 kDa), NHE2 (100 kDa), or streptavidin-HRP biotinylated protein (150 kDa band) were quantified by a densitometric analysis using Gel-Pro Analyzer software (Media Cybernetics, MD) and expressed as the NHE2/streptavidin ratio.
QUANTIFICATION OF PLASMA MEMBRANE NHE2 BY IMMUNOFLUORESCENCE STUDIES
To quantify NHE2 proteins at the plasma membrane (PM) in RCCD1 cells, immunofluorescence studies were performed. WT- or AQP2-RCCD1 cells were seeded on coverslips and allowed to grow. Then, monolayers were incubated with the specific plasma membrane marker Alexa 488-conjugated wheat germ agglutinin (WGA; Molecular Probes—Thermo Fisher Scientific, MA) for 30 min at 4°C to label the surface glycoproteins. Cells were then fixed in 3% paraformaldehyde for 30 min and then permeabilized with 0.2% Triton X-100 at room temperature. Samples were sequentially incubated with polyclonal anti-rat NHE2 (dilution 1:50, Santa Cruz Biotechnology sc-30167) ON at 4°C and secondary antibodies (rabbit anti-Cy3 conjugate, dilution 1:100, Jackson Immuno 111-165-003) for 2 h at room temperature. Then, nuclei were stained with Hoechst (5 μg/ml) for 1 min. Coverslips were mounted with Vectashield mounting medium. Images were captured using epifluorescence on an Olympus FluoView FV1000 confocal microscope and digitalized.

INTRACELLULAR pH STUDIES
RCCD1 monolayers, grown on permeable filters, were inserted between two lucite frames, separating two fluid compartments when diagonally placed in a quartz cuvette with control solution (Table I) as previously reported [Ford et al., 2002]. Free access both to the apical and basolateral baths was possible. Measurements were made with a computerized and thermoregulated (37°C) spectrofluorometer (Jasco 770, MD). For measurements, the cell monolayer was placed forming a 45° angle with the exploring beam. Fluorescence emission was monitored at 535 nm, with excitation wavelengths of 439 and 510 nm. For intracellular pH (pHi) measurements, cells were loaded with 8 μM of 2′,7′bis(2-carboxyethyl)-5-(and–6) carboxyfluorescein acetoxymethyl ester (BCECF/AM, Molecular Probes) during 60 min at 37°C, both from the apical and basolateral baths. The ratio of the BCECF fluorescence emitted from dye-loaded cells was calibrated, in terms of pH, by incubating the cells in “high K+ solution” (140 mM KCl, 4.6 mM NaCl, 1 mM MgCl2, 2 mM CaCl2, 10 mM Hepes, 5 mM glucose) and then by permeabilizing the cells with 5 μM nigericin to balance extracellular pH (pHo) with pHi. Then, pH-bathing solution was stepped between 6.6 and 8.5. The 510/439 ratio was linear over this pH range (r = 0.99, n = 6).
| Solution | Control | NH4Cl | 0 Na+ |
|---|---|---|---|
| NaCl | 147 | 127 | – |
| Hepes | 30 | 30 | 30 |
| KCl | 3 | 3 | 3 |
| CaCl2 | 1.8 | 1.8 | 1.8 |
| MgSO4 | 1 | 1 | 1 |
| KH2PO4 | 1 | 1 | 1 |
| K2SO4 | 1 | 1 | 1 |
| NH4Cl | – | 20 | – |
| TMA | – | – | 147 |
| Glucose | 5.6 | 5.6 | 5.6 |
- All concentrations are given in mM; pH was adjusted to 7.4 at 37°C.


MEASUREMENT OF REGULATORY VOLUME INCREASE ACTIVITY
To determine the regulatory volume increase (RVI) activity WT-RCCD1, AQP2-RCCD1, or mpkCCDc14 cells (stimulated or not with 100 μM dbAMPc) were seeded on culture flasks, either allowed to grow freely or synchronized. Cells were harvested by trypsinization with Trypsin/EDTA, washed in an isosmotic solution, and then incubated for up to 10 min in the desired solution. Cells were incubated either in an isosmotic solution (311 ± 5 mOsM) containing (in mM): 90 NaCl, 10 NaHCO3, 5 KCl, 1 CaCl2, 0.8 MgSO4, 1 MgCl2, 100 mannitol, 20 Hepes, 5 glucose, or in a hypertonic solution (419 ± 5 mOsM) prepared by mannitol addition to obtain the desired osmolality, while maintaining the ionic strength. Solutions osmolality were routinely measured in a pressure vapor osmometer (Vapro; Wescor, Logan, UT). All solutions were titrated to pH 7.40 using Tris (Sigma–Aldrich) and bubbled with atmospheric air.
Cell volume was estimated from suspended cells using a Scepter™ handheld automated cell counter (Millipore, MA) fitted with a 60 µm Scepter sensor and ScepterPro software. The Scepter uses a Coulter principle to generate a histogram of cell-volume distribution ranging from 0 to 24 pL [Winterberg et al., 2012; Xiao et al., 2012].

STATISTICS
Values were reported as mean ± SEM, and n is the number of experiments. Student's t-test for unpaired data was used. P < 0.05 was considered a significant difference.
RESULTS
NHE2 ACTIVITY AND EXPRESSION ARE INCREASED IN THE PRESENCE OF AQP2
The first set of experiments examined the consequences of AQP2 expression on NHE activity in RCCD1 cells. Intracellular pH (pHi) measurements were performed in monolayers grown on permeable filters using an  -free medium (Control, Table I) to minimize bicarbonate-transporting systems. Figure 1A shows that in AQP2-expressing cells, basal pHi was higher than in WT cells. We then investigated whether this alkalinization could be due to a higher NHE activity. Since we have previously reported that WT-RCCD1 cells expresses two isoforms of the Na+/H+ exchanger (NHE1 and NHE2) [Ford et al., 2002], we used the highly specific inhibitor HOE-694 to identify the isoforms. The inhibitor HOE-694 at low doses (1 μM) inhibits NHE1, but not NHE2, while at higher doses (15 μM) block both isoforms [Counillon et al., 1993; Counillon and Pouyssegur, 2000]. Figure 1B shows that independently of AQP2 expression 1 μM HOE-694 did not affect basal pHi, indicating that NHE1 does not contribute to basal pHi. In contrast, 15 μM HOE-694 induced an acidification significantly higher in AQP2-expressing cells than in WT cells. These results suggest that the higher basal pHi observed in AQP2-RCCD1 cells could be explained by an increased NHE2 activity. We further evaluated this possibility analyzing the difference in the NHE1 and NHE2 activity between WT and AQP2-expressing cells by the NH4Cl pre-pulse technique [Boron and De Weer, 1976]. Figure 1C and D shows time-course experiments of pHi evolution, using the NH4Cl pre-pulse technique, in control conditions and in the presence of 1 μM or 15 μM HOE-694. It can be noted that both cell lines acidify to the same extent when NH4Cl is washout (ΔpHi WT: −0.33 ± 0.15 vs. AQP2: −0.39 ± 0.08. ns, n = 10). In addition, the intracellular Buffer power (ßi) was not affected by the expression of AQP2 (ßi, mM pH−1, WT: 8.27 ± 2.29 vs. AQP2: 7.61 ± 2. NS, n = 10). NHE1 activity was estimated as the difference between the H+-fluxes of experiments performed in the absence or presence of 1 μM HOE-694 and NHE2 activity as the difference between experiments performed in the presence of 1 μM and 15 μM HOE-694. It can be seen in Figure 1E that NHE1 activity was similar in both cell lines. However, in AQP2-expressing cells, NHE2 activity was significantly higher than in WT cells.

To investigate whether the increase in NHE2 activity of AQP2-expressing cells was parallel to a change in protein expression, immunoblots experiments were carried out on WT- and AQP2-RCCD1 cell surface biotinylated membranes. Figure 2A illustrates that NHE2 was expressed in both cell lines; however, densitometric analysis showed that the ratio of NHE2/Streptavidin protein was higher in AQP2-expressing cells. We also performed immunoblots experiments using another cortical collecting duct cell model: mpkCCDc14 cell line. In the absence of stimulation, mpkCCDc14 cells do not express plasma membrane AQP2 but upon addition of vasopressin, or its analogues, cells translocate AQP2 to the apical membrane AQP2 [Hasler et al., 2002]. Figure 2B shows that +AQP2-mpkCCDc14 cells not only express plasma membrane AQP2 but also increase NHE2 protein expression.
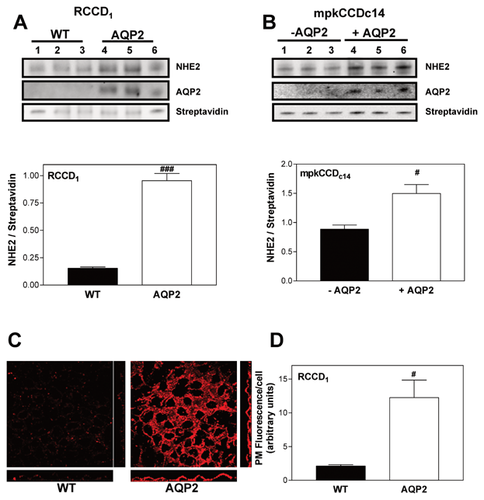
Cell membrane expression of NHE2 in RCCD1 cells was confirmed by immunofluorescence experiments. Since we were interested in quantifying plasma membrane-associated NHE2, WGA, a plasma membrane marker, was added in the immunofluorescence experiments. We then created a mask to analyze NHE2 immunofluorescence associated with plasma membrane as described in Methods section [Janecki et al., 2000]. Figure 2C illustrates that in AQP2-expressing cells, the plasma membrane-associated NHE2 stain was more intense. Signal quantification confirmed higher levels of plasma membrane-associated NHE2 immunofluorescence in AQP2-expressing cells as compared to WT cells (Fig. 2D).
Altogether, these results suggest that the basal alkalinization observed in AQP2-expressing cells is probably due to the higher membrane protein NHE2 expression that leads to the higher NHE2 activity of these cells.
NHE2 ACTIVITY CONTRIBUTES TO CELL CYCLE PROGRESSION IN AQP2-EXPRESSING CELLS
We then investigated whether NHE2 increased activity in AQP2-expressing cells could be implicated in the enhanced cell proliferation observed in these cells. In order to study only NHE2 activity, cells were grown under conditions where NHE1 is inhibited. For this, we used two experimental conditions, one, cells grown in the presence of 1 μM HOE-694, with NHE2 being the only active Na+/H+ isoform (+NHE2) and the other, cells grown in the presence of 15 μM HOE-694, to also inhibit NHE2 (−NHE2). Our results showed that inhibition of NHE2 activity did not affect WT-RCCD1 cell growth but did significantly reduce the number of AQP2-RCCD1 cells to a level similar to that observed in WT cells (Fig. 3A). Further studies assessed BrdU incorporation by flow cytometry analysis in order to evaluate the proliferation of growing cells (Fig. 3B). Results showed that the percentage of BrdU+ cells was significantly reduced in the absence of NHE2 activity only in cells expressing AQP2.
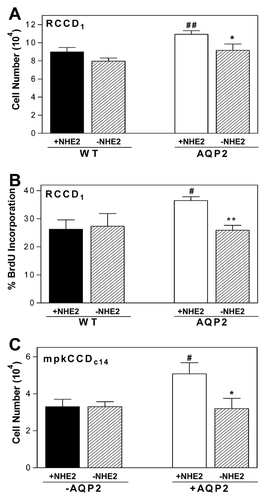
We also evaluated the time course of growing cells using the mpkCCDc14 cells. Our results showed that inhibition of NHE2 activity did not affect non stimulated mpkCCDc14 cells (-AQP2) growth, but did significantly reduce the number of cell growth in mpkCCDc14 expressing AQP2 (Fig. 3C). These results confirm that independently of the cortical collecting duct cell model AQP2 expression per se plays a role in the increase of the rate of cell growth.
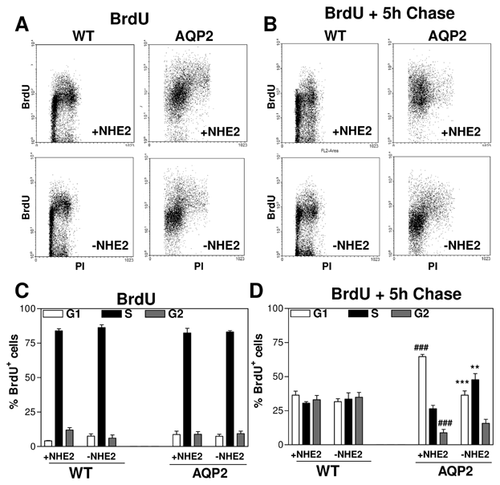
We then determined whether cell growth disparities could be due to differences in cell cycle progression. To evaluate the progression of RCCD1 cell through the cell cycle we performed BrdU pulse-chase experiments. Figure 4A and C shows that independently of NHE2 activity immediately after BrdU pulse most BrdU+ cells are in the S phase in WT- and AQP2-RCCD1 cells. Figure 4B and D shows that after 5 h chase in fresh medium, the percentage of cells in S-phase decreased and cells reached the subsequent phases. However, WT cells have significantly fewer BrdU+ cells in G1 phase and higher BrdU+ cells in G2/M phase than AQP2-expressing cells. When NHE2 was inhibited (−NHE2) in WT cells, the proportion of BrdU+ cells in each phase of the cell cycle did not change. However, in AQP2-expressing cells, after NHE2 inhibition the proportion of BrdU+ cells in G1 phase decreased.
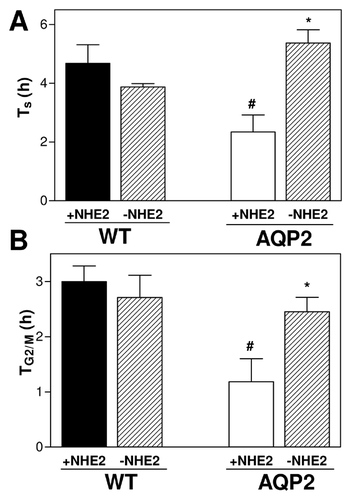
We then used the BrdU pulse-chase results to calculate the duration of the S phase (Ts) and the duration of the G2/M phase (TG2/M) of the cell cycle. It can be observed in Figure 5A and B that when NHE2 is active (+NHE2), Ts and TG2/M times were both shorter in AQP2-expressing cells, but they increased to levels similar to WT cells when NHE2 activity was blocked. Together these results demonstrate that NHE2 has an important role in AQP2-induced acceleration of cell proliferation.
NHE2-DEPENDENT RVI RESPONSE IS ACTIVATED DURING THE S PHASE OF THE CELL CYCLE IN AQP2-EXPRESSING CELLS
We then investigated whether the increased NHE2 activity and the higher cell proliferation rate observed in the presence of AQP2 were linked to changes in the capacity of cell volume regulation during cell cycle progression. RVI activity was measured as cell volume recovery in response to a hypertonic gradient (ΔOsM = +100 mOsM) in synchronized (most cells at S phase) and unsynchronized cells (most cells at G1 phase). Figure 6 shows the time course of cell volume in WT- and AQP2-RCCD1 cells during the hypertonic challenge. It can be noted that, independently of AQP2 expression, in G1 phase cells shrank but failed to recover cell volume (Fig. 6A). In contrast, at S phase, only cells expressing AQP2 were able to recover cell volume (Fig. 6B). Figure 6C illustrates the percentage of cell volume recovery 10–20 min after the hypertonic shock (%RVI). It can be observed that RVI machinery was inactive during G1 phase in both cell lines, but only AQP2-expressing cells activated the RVI during S phase. We then performed experiments on mpkCCDc14 cells expressing or not AQP2. Figure 6D shows that only in the S phase of AQP2-expressing mpkCCD14, cells are able to activate the RVI machinery. Finally, we investigated whether this activation was dependent on NHE2 activity.
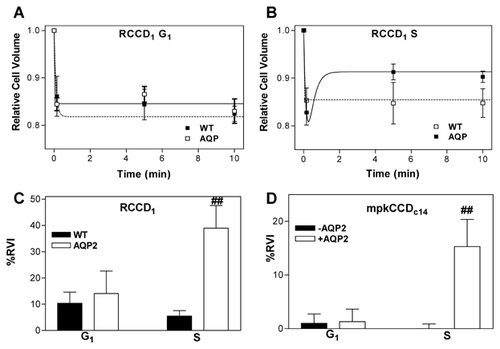
Our results in AQP2-expressing cells showed that the blockage of NHE2 activity with HOE-694 15 μM inhibited S phase-associated RVI (%RVI in S: +NHE2 = 34.08 ± 8.92 vs. −NHE2 = 1.93 ± 1.40, P < 0.01 n = 15). For mpkCCDc14 cells grown expressing AQP2, the blockage of NHE2 activity with HOE-694 15 μM also inhibited S phase-associated RVI (%RVI in S: +NHE2 = 15.33 ± 2.90 vs. −NHE2 = 0 ± 0.01, P < 0.01 n = 6). Altogether, these results demonstrate that the RVI machinery activated during S phase in AQP2 expressing cells involves NHE2 activity.
DISCUSSION
Although the Na+/H+ exchanger has long been implicated in the control of cell proliferation, the specific mechanisms are not yet fully elucidated. To date, most studies have focused in the participation of NHE1 isoform, having a permissive role rather than an obligatory signaling role per se. In fact, it appears that NHE1-induced changes in pHi may contribute to modulation of cell proliferation [Putney et al., 2002; Fuster and Alexander, 2014]. However, some lines of evidence indicate that under certain conditions NHE2 is also able to support proliferation [Kapus et al., 1994]. Moreover, it has been described that growth factors modulate NHE2 expression and activity through specific domains [Levine et al., 1993; Nath et al., 1999; Xu et al., 2001]. Since cell cycle progression is dependent on an increase in cell volume, in part mediated via NHEs, and AQPs are involved in cell volume regulation [Ford et al., 2005; Galizia et al., 2008], in this study, we analyzed if NHE2 could influence renal cell proliferation focusing on its relationship with AQP2 expression and cell volume regulation.
We here demonstrate, for the first time, that AQP2-expressing cells have both higher pHi and higher protein levels of NHE2 than WT-RCCD1 cells. As we have previously demonstrated that in these cells, NHE2 is mainly involved in steady-state pHi regulation [Ford et al., 2002], the increase in basal pHi in AQP2 expressing cells could be explained by the increased NHE2 protein abundance that leads to a rise in NHE2 activity. We also show that the increased NHE2 expression in the presence of AQP2 seems to be characteristic of CCD cells since stimulating AQP2 expression in another CCD cell line, the mpkCCDc14 cells, NHE2 protein abundance also enhances. As it is well-known that in many systems, increases in pHi may accelerate cell proliferation by stimulating the synthesis of protein, RNA, and DNA [Schreiber, 2005], it is likely that a higher basal pHi observed in AQP2 cells could act as a facilitator to initiate cell cycle. Our data support this hypothesis since AQP2-expressing cells presented a NHE2-sensitive increased proliferation and inhibition of NHE2 activity slowed down the progress through the S and G2/M phase of the cell cycle.
However, an increase in pHi is not the only factor that contributed to accelerate proliferation since we have previously shown that the accelerated proliferation rate seen in AQP2-expressing cells depends, at least in part, on an increase in cell volume and the capacity for RVD changes during the S phase [Rivarola et al., 2010; Di Giusto et al., 2012]. We here demonstrated that while there was no RVI activity in cells in G1 phase, in S phase, AQP2-expressing cells had an NHE2-mediated RVI activity. The participation of NHE2 in RVI is in line with previous reports in the collecting duct showing that hyperosmolality increases NHE2 mRNA expression and that transcriptional regulation of the NHE2 gene is mediated by two osmotic response elements [Soleimani et al., 1994; Bai et al., 1999]. Moreover, our previous studies indicated that NHE2 was activated by tonicity [Ford et al., 2002].
What could be the interplay between AQP2 and NHE2 to contribute to cell proliferation? It has recently been described that AQP2 promotes cell migration and epithelial morphogenesis through interaction with β-integrins that are connected to the actin cytoskeleton [Tamma et al., 2011; Chen et al., 2012]. It has also been shown that both AQP2 and NHE2 proteins can interact with cytoskeleton through binding to cytoskeletal protein α-spectrin [Chow et al., 1999; Noda et al., 2005]. So it is likely that the increased NHE2 activity and the NHE2 associated-RVI observed in the presence of the water channel AQP2 may be related to the fact that both proteins may form part of an interactome that process proliferative cues. In line with this, it has recently been described that AQP1 and AQP3 overexpression accelerates the cell proliferation because affects the expression of key proteins for the cell cycle progression and contributes to cell volume changes needed for this process [Galan-Cobo et al., 2015, 2016]. So, it cannot be discarded that along with volume changes other proteins related to proliferation may also be modified in AQP2-expressing cells. Further experimental efforts are needed to address this complex interplay between AQP2 and RVI activity at each phase of the cell cycle.
In conclusion, our data show that, in collecting duct cells, the water channel AQP2 plays an important and novel role in regulating cell proliferation through modulating the activation of the RVI machinery during S phase, a mechanism that in turn depends on NHE2 activity. Clarification of the mechanisms governing cell volume control by AQP2 would be very important in learning about correct cellular function as well as about diseases associated with failure in AQP2 expression and alterations in cell proliferation as in the case of Insipidus Nephrogenic Diabetes induced by chronic lithium treatment.
ACKNOWLEDGMENTS
The authors are grateful to Dr. Juerguen Puenter (Aventis Pharma Deutschland GmbH, Germany) who kindly provided us with the HOE-694 compound. This work was supported by grants from Fondo Nacional para la Ciencia y la Tecnología, Argentina, Grant Number: PICT 12-0750; Universidad de Buenos Aires, Argentina, Grant Numbers: UBACYT 20020100100648 and UBACYT 20020130100697; Consejo Nacional de Ciencia y Tecnología, Argentina, Grant Number: PIP 0088 and PIP 0296.


