Inverted multiscale optical resolution photoacoustic microscopy
Abstract
Optical resolution photoacoustic microscopy (ORPAM) is one of the fastest evolving photoacoustic imaging modalities. It not only has a comparable spatial resolution to pure optical microscopies such as epifluorescence microscopy, confocal microscopy, and two-photon microscopy, but also owns a higher penetration depth. In this study, we report an inverted multiscale (IM)-ORPAM that utilizes a two-dimensional galvanometric scanner integrated with two microscopic imaging lenses to achieve rotary-scanning-based multiscale imaging. A 15 MHz cylindrically focused ultrasonic transducer is mounted on a motorized rotator to synchronously follow the optical scanning paths. To minimize the loss of signal-to-noise ratio, the acoustic focal line is precisely adjusted confocal with the optical focal plane. Black tapes, carbon fibers, and sharp blades are imaged to evaluate the performance of the system, and in vivo multiscale imaging of vasculatures inside the ears and brains of mice is demonstrated using this system.
Introduction
Over the last decade, optical resolution photoacoustic microscopy, referred to as ORPAM, is one of the most rapidly growing biomedical imaging modalities 1. ORPAM has a cellular-level spatial resolution and a penetration depth of up to 1 mm using the intrinsic biological absorption as the contrast mechanism 2. In conventional ORPAMs, to achieve the best signal-to-noise ratio (SNR) of photoacoustic signals, spherically focused high-frequency ultrasonic transducers are usually employed and precisely adjusted to achieve confocal with the optical focus 3-5. Moreover, to obtain high-resolution and wide-field photoacoustic images, ORPAMs commonly utilize high-performance mechanical scanners to realize fast and precise raster scanning of either the imaging interface or the sample. Unfortunately, besides the bulky size, the imaging speed of the mechanical-scanning-based ORPAM is insufficient. Additionally, experienced operators and complicated operations are essential to reach the satisfactory image quality.
In attempts to improve the temporal resolution of ORPAMs, multiple studies have been reported 7-15. For example, Wang et al. employed a voice-coil stage to achieve a frame rate of 40 Hz in B-scan imaging over a 1 mm range 7. Rao et al. reported the use of a hybrid optical-mechanical scanner to obtain B-scan images at 6.25 Hz 8. In addition, thermal and magnetic MEMS mirrors were successfully developed to scan optical/acoustic beams at an ultrahigh speed in ORPAMs 9-11. Moreover, Yuan and Kang developed fast transmission-mode ORPAMs via combining large-area flat ultrasonic transducers with two-dimensional (2D) galvanometer-based optical scanners 12, 13. In this study, we develop an inverted multiscale ORPAM, referred to as (IM)-ORPAM, realized by integrating a 2D galvanometric scanner with two different microscopic objectives. An acoustic/optical combiner allows fully transmission of the excitation beam and reflection of the photoacoustic signals. To minimize the loss in SNR, the focal line of a cylindrically focused transducer is adjusted to achieve confocal with optical focal plane. Apart from reported ORPAMs, we employ the rotary scanning mechanism in this system, which not only avoids relative motion between the imaging interface and the sample, but also has the potential to achieve super-fast scanning with cost-efficient instruments such as brushless motors. In addition, we design an inverted microscopic configuration to avoid the use of a water tank, which is required in other ORPAMs. To prevent complicated adjustments and operations, the imaging plane locates at 0.2 mm out of the imaging window. By using two different microscopic imaging lenses, we have successfully demonstrated the low-resolution mode with a circular imaging area of up to 8.4 mm in diameter and a lateral resolution of 10.8 µm, and the high-resolution mode with a circular imaging area of up to 4 mm in diameter and a lateral resolution of 4.2 µm.
Methods and materials
System configurations
Figure 1(a) shows the schematic of the imaging system. Laser pulses emitted from a 532 nm high-repetition-rate (2.5 kHz) laser (FDSS532-Q3-STA, Crylas Inc.) with 20 μJ pulse energy and 2 ns duration are split by a beam splitter (BS025, Thorlabs Inc.). The reflection beam is delivered into a fast photodiode (PD818-BB-21, Newport Corp.), and serves as trigger and synchronization sources for data acquisition, optical scanning, and motorized rotation. The transmission beam is filtered by a spatial filter comprising an objective (GCO-2112, Daheng Optics), a Plano-convex lens, and a 15 μm pinhole, then coupled into a single-mode optical fiber via a space-to-fiber coupler built by an objective lens (GCO-2112, Daheng Optics) and a customized multi-dimensional single-mode optical fiber manipulator. The output beam from the single mode fiber is collimated via a collimator (F220FC-532, Thorlabs Inc.) and delivered into a 2D galvanometric scanner (GVS012/M, Thorlabs Inc.). The scanner is driven by a multifunctional data acquisition card (PCI-6731, National Instrument) to achieve fast rotary scanning of the collimated optical beam on the back surface of the imaging lenses. A scan lens (LSM-03-VIS, Thorlabs Inc.) and a microscopic objective lens (RMS4, Thorlabs Inc.) are switchable using a customized objective lens turret to select specific mode. The low-resolution scan lens (LSM-03-VIS) has an effective working distance of 25.1 mm, a maximum FOV of 10.3 mm × 10.3 mm, and a 9.9 μm optical focus, and the high-resolution objective lens (RMS4) owns an effective working distance of 18.5 mm, a maximum FOV of 4 mm × 4 mm and a 0.1 NA value in air.
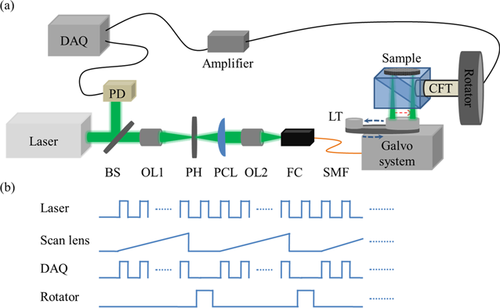
The system configurations. (a) The schematic of the imaging system. (b) Synchronization sequences for optical scanning, data acquisition and motorized rotation. BS: beam splitter, PD: photo diode, OL1: object lens 1, OL2: objective 2, PH: pinhole, PCL: Plano-convex lens, FC: fiber coupler, CFT: cylindrically focused transducer, LT: lens turret, SMF: single mode fiber, DAQ: data acquisition.
As shown in Figure 1(b), the output signal from the photodiode triggers the multifunctional data acquisition card to generate two saw-tooth functions, thereby driving the galvanometric scanner to scan the laser beam. Another two analog output channels of the card serve as the external trigger for data recording and the start trigger for the motorized rotator (RAP125, Zolix Inc.). The detailed design of the acoustic/optical combiner is shown in Figure 2(a). It comprises two isosceles right-angle water prisms separated by an ultrathin glass plate. The thickness of the glass plate is 0.1 mm. During the experiments, the excitation laser beam passed through the water cube, and the tissues absorbed the light and produced photoacoustic waves. Due to the huge difference in acoustic impedance between water and glass (1.48 kg/m2 ⋅ s vs. 18.9 kg/m2 ⋅ s), most of the photoacoustic waves were reflected and detected by a cylindrically focused transducer. The transducer (V319-SU, Olympus IMS) with a focal length of 25.4 mm, a center frequency of 15 MHz, and a bandwidth of 80% was mounted on the right side of the holder and sealed by a rubber sealing ring to avoid water leak during the rotation. The acoustic focal line of the transducer was designed to be 0.2 mm out of the imaging window. The optical plane was adjusted to achieve confocal with the acoustic focal line via a high resolution Z-axis stage (GCM-1622M, Daheng Optics). The signals were amplified by ∼39 dB using an amplifier (5073PR, Olympus IMS) and digitized with a data acquisition card (NI-5124, National Instrument, TX) at a sampling rate of 100 MS/s.
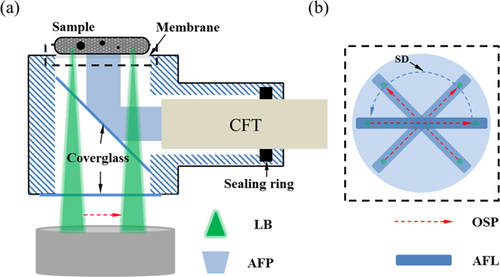
(a) The schematic of the acoustic/optical combiner. (b) The rotary scanning mechanism of the acoustic focal line (blue line) and the optical scanning path (dotted red line). CFT: cylindrically focused transducer, LB: laser beam, AFB: acoustic focal beam, OSP: optical scanning path, AFL: acoustic focal line, SD: scanning direction.
In the experiments, at each laser scanning point, a depth resolved photoacoustic signal (A-line) was recorded. To cover the entire imaging area, as shown in Figure 2(b), the optical focus was firstly scanned along the optical scanning path (dotted red line) which was overlapped with the acoustic focal line of the cylindrically focused transducer (blue line) to form a B-Scan image. Then, two saw-tooth signals with different amplitudes drove the 2D galvanometric scanner to make the optical scanning path rotate with a given angle until the whole imaging area was fully covered. Meanwhile, the acoustic focal line was synchronously rotated to follow the rotation of the optical scanning path. In image reconstruction, we directly back-projected A-lines onto polar coordinates and exhibited the three-dimensional (3D) data by the means of maximum amplitude projection (MAP). Due to the inhomogeneous sampling pattern of the rotary scanning mechanism, weighting factors calculated based on the number of scans in each pixel was applied to remove the non-uniformity of the reconstructed images.
Phantom experiments
Black taps were imaged to evaluate the effective FOV and SNR of the cylindrically focused and flat transducers. The flat transducer (V319-SU, Olympus IMS) had the same center frequency and active area as the cylindrically focused one. In addition, the sharp edge of a blade was imaged to estimate the lateral resolutions in different modes. In low-resolution mode, we collected 2000 A-lines with a 2.5 μm interval to form a B-scan, and 3200 B-scans with a 0.05625° rotational angle to reconstruct a 3D image. When switched to the high-resolution mode, the interval between A-lines was reduced to 1.25 μm. Moreover, multiple 7 μm carbon fibers were embedded in a tissue mimicking agarose phantom mixed of India ink and intralipid, and imaged to estimate the axial resolution and evaluate the multiscale capability. The given optical absorption and reduced scattering coefficients of the phantom were 0.01 mm–1 and 1 mm–1, respectively.
Animal preparation
We carried out in vivo experiments using mouse ears and brains to further assess the system. For the experiments, 1250 A-lines were collected to form a B-scan and 1800 B-scans were used to recover a 3D image for both modes. The intervals between A-lines were 6 µm and 2.5 μm for the low- and high- resolution modes, respectively. Mice were kept motionless using an isoflurane inhalation anesthetic system and the body temperature was maintained at 37 °C using a temperature control pad (17673, Lankai Inc.). The ears and brains were gently depilated and tightly attached to the membrane sealed imaging window. For brain imaging, scalps were carefully removed with a sharp blade and skulls were intact. All procedures were approved by the University of Electrical Science and Technology of China (UESTC). The laser pulses after the imaging lenses were measured to be 80 nJ. As the sizes of the optical focuses are 10.8 μm and 4.2 μm in low- and high- resolution modes, the laser fluence at the focal point in the water are estimated to be 87 mJ/cm2 and 575 mJ/cm2 which are still less than the damage threshold experimentally observed in small animals 16. All mice were kept 24 hours after the experiments and no obvious damage were observed in the imaging area.
Results and discussions
Figure 3(a) shows two B-scan images of the black tap using the different transducers. To avoid the impact of energy fluctuation, each B-scan image was acquired from 100 times signal averaging. As shown in Figure 3(b), the maximum effective FOVs of cylindrically focused and flat transducers were measured as 8.4 mm and 3.8 mm, respectively. In addition, within the active FOVs, the SNR of the cylindrically focused transducer was 37 dB, and the SNR of the flat one was 30 dB in the center and decreased to 19 dB at the edge.
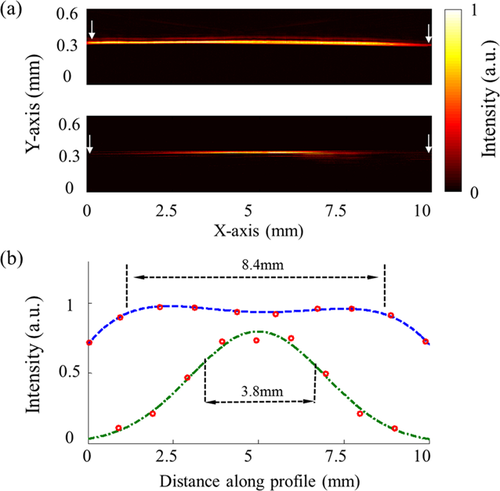
The effective FOV and SNR comparison between cylindrically focused transducer and flat transducer. (a) The B-scan images of a black tape using cylindrically focused and flat transducers. (b) Lateral profiles of the imaged tapes in the B-scan images. The white arrows in the B-scan images indicate the position of the plotted profiles.
Figure 4(a)–(d) show the photoacoustic MAP images and the Gaussian-fitted profiles of the imaged blade edge. The edge spread function (ESF) was fitted (blue dotted line) to derive the line spread function (LSF). In the low-resolution mode, the full-width-at-half-maximum (FWHM) of the LSF was calculated as 10.8 μm. In the high-resolution mode, the FWHM was measured to be 4.2 μm. Both experimental resolutions are slightly worse than the theoretical ones which are 9.9 μm for the low-resolution mode and 3.2 µm for the high-resolution mode. This is mainly caused by the refractive index mismatch at the boundaries formed by air, water and the glass plate in the acoustic/optical combiner.
In Figure 4(f), we plotted the Gaussian-fitted axial profile of a single carbon fiber indicated in Figure 4(e). The FWHM of the profile determines the axial resolution of this system, which is measured as 89.7 μm.
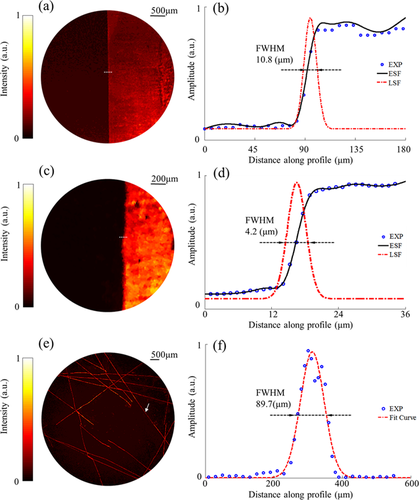
MAP images and Gaussian fitted lateral profiles of blade edge imaged in low-resolution mode (a, b) and high-resolution mode (c, d). MAP images of carbon fibers and the Gaussian fitted axial profile of a single carbon fiber (e, f). The experimental lateral resolutions in low- and high- resolution modes are estimated to be 10.8 μm and 4.2 μm, respectively. The axial resolution is 89.7 μm in both modes. EXP: experimental data, ESF: edge spread function, LSF: line spread function. FWHM: full-width-at-half-maximum.
Figure 5(a) and (b) show the low-resolution and high-resolution MAP images of carbon fibers in the tissue mimicking background phantom. We compared the imaged sizes of the same carbon fiber in Figure 5(c) and (d). The imaged size in the high-resolution mode was 7.5 µm, and the imaged size in the low-resolution mode was 11.3 µm, which was much larger than the actual size. The result indicates that high-resolution mode has a better resolving capability compared to the low-resolution mode, which is consistent with the conclusion in the resolution test.
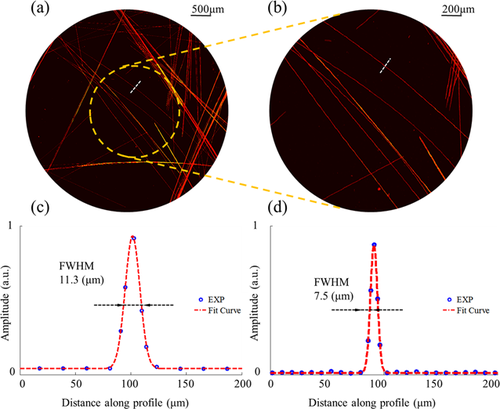
MAP images (a, b) of the carbon fiber in low- and high-resolution modes, and the Gaussian fitted profiles (c, d) of the same carbon fiber. The imaged sizes of carbon fiber in low and high resolution modes are 11.3 µm and 7.5 µm, respectively. FWHM: full-width-at-half-maximum.
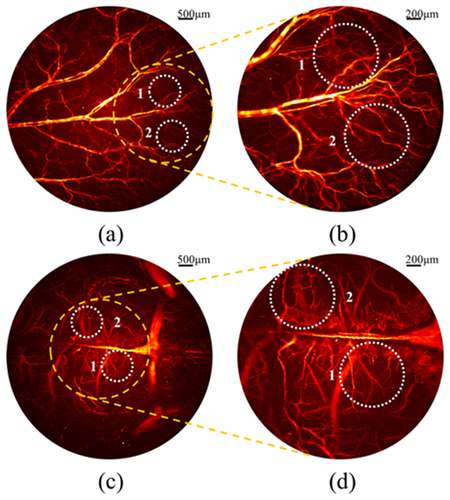
In vivo imaging of the ears and brains of mice was conducted in both high- and low-resolution modes, as shown in Figure 6. The 3D rendering of the mouse brain was shown in Movie 1. We selected two typical sub-regions for each sample, indicated by the dashed circles in Figure 6(a)–(d), and found that a larger amount of blood vessels, especially capillaries, were clearly observed in the high-resolution mode. Although the low-resolution mode missed some small blood vessels, it provided a wider FOV. In real situation, we can select the proper mode for specific applications.
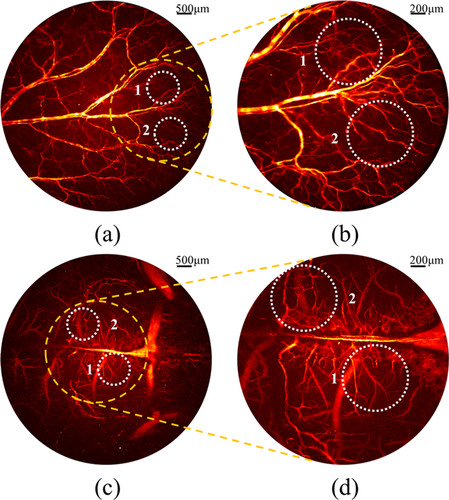
Low- and high- resolution MAP images of a typical mouse ear (a, b) and a mouse brain (Movie 1) with scalp (c, d). In both modes, blood vessels and capillaries can be clearly observed. The high-resolution mode resolves more detailed information of the capillary bed and the low-resolution mode offers a larger FOV.
Conclusions
In summary, we report an inverted ORPAM system with multiscale FOVs and resolutions. The inverted configuration is suitable to be used in clinical applications such as ophthalmology, stomatology, and dermatology. In addition, multiscale imaging is flexible in use depending on the specific applications. As opposed to most conventional ORPAM systems, there is no need to scan the imaging interface/samples, which therefore eliminates possible misalignment caused by vibration of mechanical scanners. Most importantly, this system is free from requiring complicated operations and skilled operators. However, it is acknowledged that further improvements could be made to optimize the imaging system. Firstly, we recognize that the lateral resolution may not be high enough for some special biological applications. It is known that the lateral resolution of ORPAM is determined by the size of laser focus and its axial resolution depends on the center frequency and bandwidth of the ultrasonic transducer. In this respect, it is possible for us to use new optical design to obtain a higher lateral resolution 5, 17. Moreover, the discrepancy between theoretical and experimental lateral resolutions could be compensated by using refractive index liquid to replace water in the acoustic/optical combiner and a correction lens in front of the combiner 18. It is also feasible to improve the SNR and axial resolution of this system using a higher frequency transducer (>25 MHz). Secondly, the current experimental time for the maximum FOV is around 900 seconds, which is limited by the maximum repetition rate of the pulsed laser (2.5 kHz). Therefore, a high repetition rate pulsed laser can significantly improve the imaging speed. For example, if a 100 kHz repetition rate laser (Piccolo AOT 100, InnoLas Laser) was used, one experiment only costs 22 seconds. Thirdly, compared with the conventional raster scanning ORPAM, more A-lines are needed in rotary-scanning-based ORPAM. Now, we are focusing on developing a sparse-rotary scanning based method that has the potential to reduce the experimental data and further improve the temporal resolution.
Acknowledgements
This work was sponsored by National Natural Science Foundation of China (61528401 and 81571722), State International Collaboration Program from Sichuan (2016HH0019), and startup grant (A03012023601011) from University of Electronic Science and Technology of China.


