Prognostic and discriminatory abilities of imaging scoring systems in predicting COVID-19 adverse outcomes
Abstract
Background
To evaluate the discriminatory ability of imaging modalities' scoring systems in the prediction of COVID-19 adverse outcomes like ICU admission, ventilatory support, or mortality.
Methods
We searched PUBMED, EBSCO, WEB OF SCIENCE, and SCOPUS. Two authors independently screened the resulting papers for fulfillment criteria. Meta-DiSc version 1.4, RevMan version 5.4, and MedCalc version 19.1 were used for test accuracy analysis, sensitivity and specificity analysis, and pooling Area under the curve for discriminatory assessment, respectively.
Results
Regarding mortality prediction, the computed tomography (CT) showed significantly higher sensitivity [80%; 95% CI 0.74–0.85] and positive likelihood ratio (PLR) [4.41 95% CI 2.94–6.61] relative to the Lung Ultrasound Score (LUS) approach, while the LUS approached the CT scan with specificity of 81% [95% CI 0.78–0.83] and negative likelihood ratio (NLR) of [0.32; 95% CI 0.16–0.64]. The pooled area under ROC for LUS was [AUC = 0.777, 95% CI 0.701–0.852; p < 0.001, I2 = 74.86%, p = 0.019] while the pooled area under ROC for CT severity score was [AUC = 0.855, 95% CI 0.78–0.93; p < 0.001, I2 = 93.73%, p < 0.001]. Regarding adverse outcomes prediction, the LUS had a slightly higher specificity of [78%; 95% CI 0.75–0.80] and PLR of [3.60; 95% CI 2.28–5.68] compared to CT score. The pooled AUC using LUS was (0.77, 95% CI 0.719–0.832; p < 0.001), while using CT severity score was (0.843, 95% CI 0.787–0.898; p < 0.001), and using X-ray scores was (0.814, 95% CI 0.751–0.878; p < 0.001).
Conclusion
CT severity score showed a better discriminatory ability in predicting COVID-19 adverse outcomes, as in-hospital mortality, ICU admission, and need for ventilatory support compared to LUS and X-RAY scores, while the LUS, being more specific, had a slightly better prognostic value.
Abbreviations
-
- AUC
-
- area under the curve
-
- CT
-
- computed tomography
-
- LUS
-
- Lung Ultrasound Score
-
- NLR
-
- negative likelihood ratio
-
- PLR
-
- positive likelihood ratio
-
- ROC
-
- receiver operator characteristic
1 BACKGROUND
Coronavirus disease 2019 (COVID-19), caused by the severe acute respiratory syndrome coronavirus 2 (SARS-CoV-2), has caused a pandemic in more than 200 countries or areas affected to the point the World Health Organization declared it a public health emergency issue of international concern (PHEIC) [1, 2].
Several studies and meta-analyses have been done on the role of different imaging modalities such as X-ray, computed tomography (CT), and ultrasound in COVID-19 diagnosis. COVID 19 imaging findings have been reported in lots of studies; however, the use of a combined prognostic and triage tool has not been explored yet [3]. The prognostic importance of imaging modalities and their role in the risk stratification of patients already diagnosed with COVID-19 have not yet been established. COVID-19 results in severe acute respiratory distress syndrome (ARDS), multi-organ dysfunction syndrome and mortality, and while supportive care is the main line of treatment for noncritically ill patients at admission, many of the patients may deteriorate during hospitalization. Thus, early prediction of disease progression is crucial in delivering appropriate health care for COVID-19 patients. Moreover COVID-19 pandemic has been associated with high mortality notably in multimorbid elderly, and from here stems the importance of finding an easy-to-use practical method to determine whether a patient will present complications in order to monitor him. Also, patients' stratification according to severity is crucial to ensure adequate management of overwhelmed healthcare resources caused by this global pandemic, to prioritize hospital admission in low income areas with limited resources [4]. Prediction scores play a vital role in guiding clinical decision-making for patients. Yet some studies proved that the available prediction scores did not perform well on COVID-19 patients as they underestimated the disease's severity. On the other hand, imaging scoring systems such as Lung ultrasound scores or CT severity scores can improve risk stratification for infected patients by quantifying and monitoring the severity of lung abnormalities [5]. They could also be used as predictors of mortality [6]. The aim of this meta-analysis is to evaluate the discriminatory ability of different imaging modalities and their scoring systems in the prediction of adverse outcomes as ICU admission, ventilatory support, or mortality.
2 METHODS
A systematic review and meta-analysis were performed following the Preferred Reporting Items for Systematic reviews and meta-analyses (PRISMA) guidelines [7]. A research protocol for this review is available online at the PROSPERO International prospective register of systematic reviews (http://www.crd.york.ac.uk/PROSPERO/) under the registration number: CRD42022314532.
2.1 Search and identification of studies
A comprehensive literature search was carried out on the following databases: PUBMED, EBSCO, WEB OF SCIENCE, and SCOPUS in October 2021. We used the following search terms: ((CT severity score OR Chest computed Tomography OR Lung ultrasound OR ultrasound OR lung ultrasonography OR lung US OR CT severity score OR CXR score OR RALE OR BRIXIA OR percent opacification)) AND ((coronavirus disease-19 OR coronavirus disease OR coronavirus OR COVID-19 OR COVID19 OR SARS-CoV-2)) AND ((mortality OR prognostic* OR “outcomes” OR stratification)).
2.2 Selection process and inclusion criteria
We imported the yielded results from database searches into Covidence.
From the searches, two reviewers (P.S,O) independently screened the title and abstract of each paper and retrieved potentially relevant references. Following this initial screening, we obtained the full text of the studies, and two reviewers (P.S,O) did the full-text screening for the papers using preset inclusion criteria: the included study must have used a scoring system either lung ultrasound score or brixia or rale, if there is no scoring system, the study is excluded. We included any study that reports either the area under the curve (AUC) “the c statistic” or the hazard ratios when using one of the scoring systems in adverse outcomes prediction. Studies included also had to have COVID-19 diagnosed patients, they were retrospective and prospective cohort studies, English studies.
2.3 Data extraction
Details regarding the hazards (or odds) ratio of mortality, ICU admission, or intubation for patients with different scoring systems along with their sensitivity and specificity and optimal cutoff were extracted. Moreover, the study design, the country where the study was done, patients characteristics, and scoring system details and cutoffs were extracted.
2.4 Risk of bias
Risk of bias assessment was performed using the Quality in Prognostic Studies (QUIPS) tool.
This tool includes six domains: selection of participants, study attrition, prognostic factor measurement, study confounding, outcome measurement, and statistical analysis and reporting. Under each domain, bias is assessed by answering three up to seven items for which the response and an overall rating for each domain are assigned as “high,” “moderate,” or “low” risk of bias [8].
2.5 Statistical analysis
The test accuracy analysis was performed by using Meta-DiSc version 1.4 and RevMan version 5.4. After the selection of the studies, we proceeded to calculate the statistical parameters true positive, false positive, true negative, and false negative from the data extracted from the studies. The sensitivity, specificity, positive likelihood ratio (PLR), and negative likelihood ratio (NLR) were pooled and plotted. We used the Hierarchical Summary Receiver Operating Characteristic (HSROC) model in this analysis and I squared for assessing the heterogeneity. Heterogeneity was assessed by Higgins I2. The threshold analysis was performed to explore if the heterogeneity was affected by the threshold level. Also, according to Cochrane Handbook for systematic review, SE was calculated for 95% CI with the following formula: SE = (upper limit of CI – lower limit of CI)/3.92, and logarithmic RR for base 10 using Excel sheet. RevMan version 5.3 for Windows using Generic Inverse Variance method was used for pooling RR with 95% CI. Furthermore, the discriminatory ability of scoring systems which describes the scoring systems' ability to individually distinguish patients who will experience the outcome from patients who will not be quantified using the AUC for the receiver operator characteristic (ROC) analysis and MedCalc version 19.1 was used for pooling AUC with 95% CI.
2.6 Scoring systems
2.6.1 Lung ultrasound score (LUS)
We calculate the LUS by summing points in 12 lung segments ranging from 0 to 36. These segments are the upper and lower parts of the anterior, posterior, and lateral aspects of the chest wall. Each segment is allocated a score from 0 to 3 according to four ultrasound aeration patterns 0 points—the presence of lung sliding with A lines or one or two isolated B lines; 1 point—moderate loss of lung aeration with three or four B lines (septal rockets); 2 points—severe loss of lung aeration with five or more B lines (glass rockets); and 3 points—the presence of a hypoechoic poorly defined tissue characterized by complete loss of lung aeration (consolidation) [9].
2.6.2 CT severity score
To calculate the CT severity score, we summate the five lung lobes (3 right and 2 left) with a maximum of 25 for both lungs. Each lobe is given a score ranging from 0 to 5 according to the lung involvement: score 0, no parenchymal involvement; score 1, <5% parenchymal involvement; score 2%, 5%–25% parenchymal involvement; score 3%, 26%–50% parenchymal involvement; score 4%, 51%–75% parenchymal involvement; and score 5, >75% parenchymal involvement [10].
2.6.3 Chest X-ray score
The most used X-ray scores are RALE BRIXIA Percent Opacification. In the RALE score, the lung is divided into four quadrants. Each quadrant is given an intensity and an opacification score. These are then multiplied together for each quadrant, and all four scores are added together. In the Brixia score, the lungs are divided into six zones, and the degree of opacification is scored as 1, 2, 3, respectively, as follows: interstitial opacities, interstitial and alveolar opacities (interstitial predominate), and interstitial and alveolar opacities (alveolar predominate). Percent opacification is a simple visual estimate of the total percentage of lung parenchymal opacification [11].
3 RESULTS
The literature search resulted in a total of 3559 papers. After duplicate removal, 2467 hits remained, which went down to 218 after the title and abstract screening. Full-text screening yielded 56 articles from which data was subsequently extracted (Figure 1). The characteristics of the included studies are presented in Table S1 [11-63]. Most studies are retrospective, they have a wide distribution worldwide in Italy, Japan, China, Netherlands. The risk of bias within studies using QUIPS tool is presented in Figure 2.
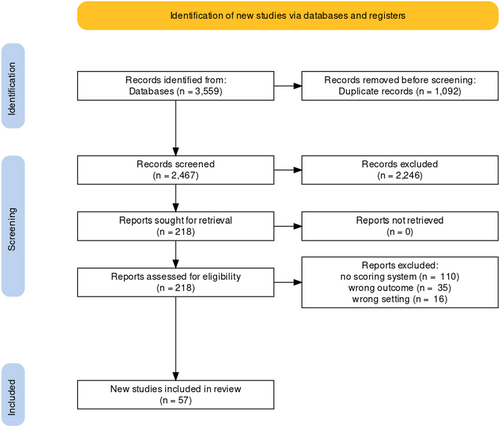
Flowchart of the included studies.
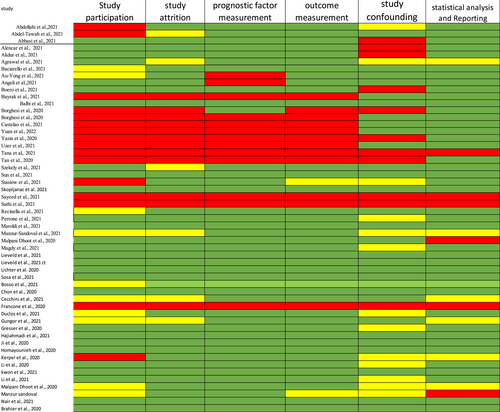
Risk of bias within studies using QUIPS tool.
3.1 Mortality
Eight studies reported the sensitivity and specificity of the LUS and six studies reported the sensitivity and specificity of the CT. The CT showed clinically and statistically significant higher sensitivity [80%; 95% CI 0.74–0.85] and PLR [4.41 95% CI 2.94–6.61] relative to the LUS approach with 66% sensitivity [95% CI 0.60–0.71] and 3.43 PLR [95% CI 2.27–5.18]. While the LUS approached the CT scan with specificity of 81% [95% CI 0.78–0.83] and NLR of [0.32; 95% CI 0.16–0.64] in comparison to those of the CT approach with 80% specificity [95% CI 0.60–0.71] and 0.27 NLR [95% CI 0.21–0.36] (Figures 3 and 4). The threshold analysis showed that the different cutoff values had a statistically insignificant effect on the heterogeneity. The pooled area under ROC for LUS was [AUC = 0.777, 95% CI 0.701–0.852; p < 0.001, I2 = 74.86%, p = 0.019] while the pooled area under ROC for CT severity score was [AUC = 0.855, 95% CI 0.78–0.93; p < 0.001, I2 = 93.73%, p < 0.001] (Figures 5 and 6), respectively.
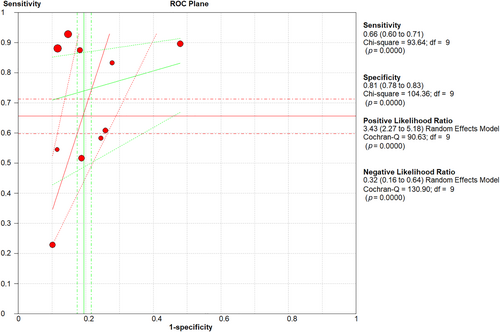
LUS sensitivity, specificity, PLR, and NLR regarding mortality prediction. LUS, Lung Ultrasound Score; NLR, negative likelihood ratio; PLR, positive likelihood ratio.
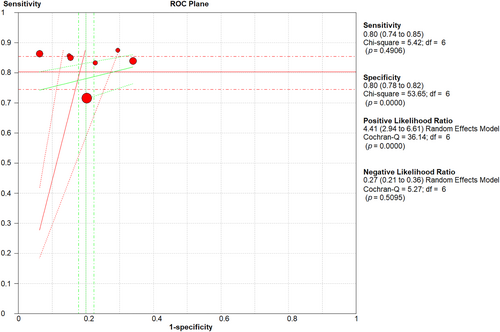
Sensitivity, specificity, PLR, and NLR of CT severity score. CT, computed tomography; NLR, negative likelihood ratio; PLR, positive likelihood ratio.
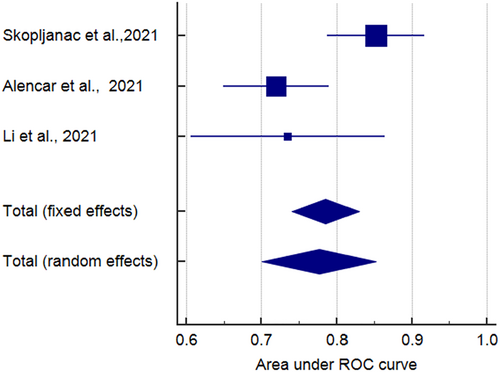
AUC ROC curve of LUS in mortality prediction. AUC, area under the curve; LUS, Lung Ultrasound Score; ROC, receiver operator characteristic.
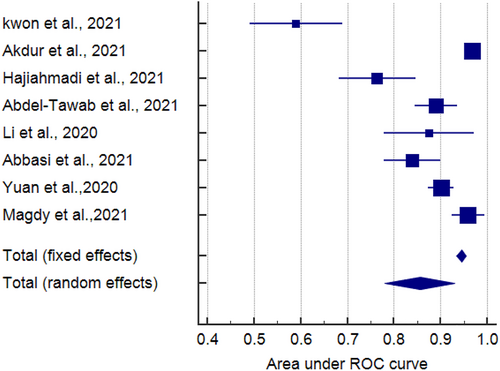
AUC ROC curve of CT severity score in mortality prediction. AUC, area under the curve; CT, computed tomography; ROC, receiver operator characteristic.
3.2 Adverse outcomes (ICU admission, mortality, need for ventilatory support)
Five studies reported the sensitivity and specificity of the CT and eight studies reported the sensitivity and specificity of the LUS. The CT showed a clinically and statistically significant higher sensitivity [72%; 95% CI 0.66–0.78] and NLR [0.39; 95% CI 0.21–0.73] relative to the LUS approach with 62% sensitivity [95% CI 0.57–0.67] and 0.37 NLR [95% CI 0.23–61]. While the LUS approached the CT scan with specificity of [78%; 95% CI 0.75–0.80] and PLR of [3.60; 95% CI 2.28–5.68] in comparison to those of the CT approach with 77% specificity [95% CI 0.74–0.70] and 2.42 PLR [95% CI 1.33–4.37] (Figures 7 and 8). Threshold analysis showed that the different cutoff values had a statistically insignificant effect on the heterogeneity. The pooled area under the ROC curve (AUC) for any adverse outcome using LUS was (0.77, 95% CI 0.719–0.832; p < 0.001), and the pooled studies showed marked heterogeneity (p < 0.0001; I2 = 96.60%) while the pooled area under the ROC curve (AUC) for predicting these outcomes using CT severity score was (0.843, 95% CI 0.787–0.898; p < 0.001), and the pooled studies showed marked heterogeneity (p < 0.0001; I2 = 92.93%). Using X-ray scores, the pooled area under the ROC curve (AUC) for predicting any adverse outcome was (0.814, 95% CI 0.751–0.878; p < 0.001), and the pooled studies showed substantial heterogeneity (p < 0.0001; I2 = 85.60%) (Figure 9). The pooled studies showed that LUS score >15 [OR = 1.07, 95% CI 1.00–1.14; p = 0.05, I2 = 0%, p = 0.91] was associated with any adverse outcomes such as mortality, ICU admission, or ventilatory need. Regarding CT severity score, results demonstrate its association with adverse outcomes [OR = 1.08, 95% CI 1.03–1.14; p = 0.002, I2 = 0%, p = 1]. CXR scores [OR = 1.11, 95% CI 1.00–1.22; p = 0.04, I2 = 0%, p = 0.89] were also associated with the outcome (Figure 10).
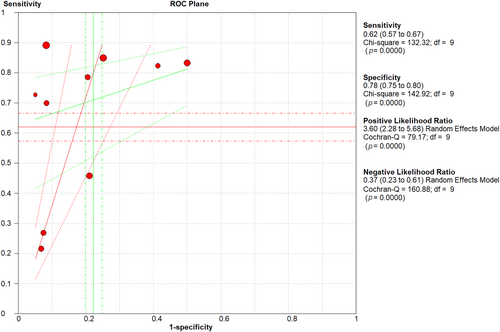
Sensitivity, specificity, PLR, and NLR of LUS in adverse outcome prediction. LUS, Lung Ultrasound Score; NLR, negative likelihood ratio; PLR, positive likelihood ratio.
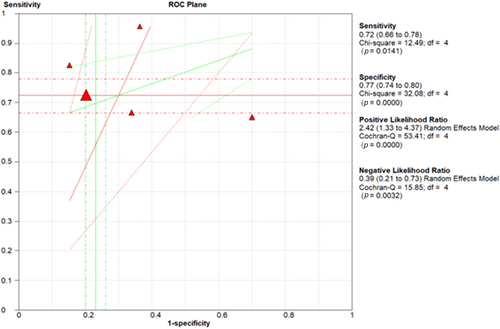
Sensitivity, specificity, PLR, and NLR of CT severity score in adverse outcome prediction. CT, computed tomography; NLR, negative likelihood ratio; PLR, positive likelihood ratio.

AUC ROC curve for LUS, CT severity score, and CXR scores in adverse outcomes prediction. AUC, area under the curve; CT, computed tomography; LUS, Lung Ultrasound Score; ROC, receiver operator characteristic.
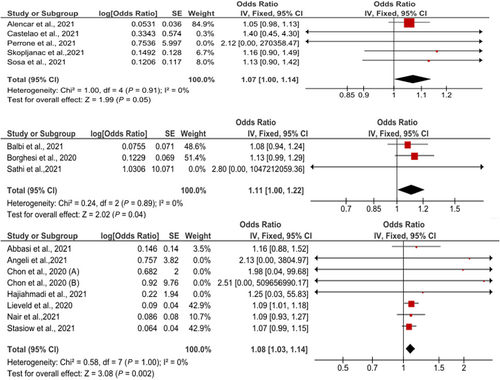
Odds ratio of association of LUS, CT severity score, and CXR scores with any adverse outcomes. CT, computed tomography; LUS, Lung Ultrasound Score.
4 DISCUSSION
In COVID-19 diagnosis, a meta-analysis pointed out that CT is sensitive and moderately specific while chest X-ray is moderately sensitive and specific, and Ultrasound is sensitive but not specific, thus chest CT and ultrasound are more useful for ruling out COVID-19 infection [3]. Several studies have discussed the use of one of the imaging scoring systems in prediction of COVID-19's outcomes but no meta-analysis had compared between them in predicting COVID's outcomes. For example, Borghesi et al. and Yasin et al. discussed the use of CXR score in predicting disease severity and in-hospital mortality. Similarly, Saeed et al. reported that CT score could be used in the prediction of outcomes. Lichter et al., de ALencar et al., and G Song et al. discussed the use of Lung ultrasound score in patients' stratification and as a predictor of mortality. Our meta-analysis showed that CT had a higher sensitivity (80% vs. 60%) and PLR in predicting both mortality and or any adverse outcomes such as ICU admission, ventilatory support need, and mortality as compared to the Lung Ultrasound score. Thus, CT is superior to ultrasound in ruling out severe outcomes of COVID-19. Lung ultrasound score had a slightly higher specificity compared to CT in both mortality prediction and prediction of any adverse outcome. Lung ultrasound's performance is thus better in ruling in the occurrence of adverse outcomes. The use of LUS can be superior as regards to the prediction of adverse events and patients' stratification as it is more specific in rolling out such adverse outcomes. This result is in association with a previously published study comparing CT and LUS as predictors of in-hospital mortality, LUS was the sole predictor of mortality [37].
The pooled Hazard ratios of LUS and CT severity score were not statistically significant mostly due to the small number of studies included.
On the other hand, the AUC of CT severity score was superior to that of LUS in predicting mortality only and predicting any adverse outcome, which elucidates that CT's performance outweighed that of LUS.
Heterogeneity is a common issue in meta-analyses of diagnostic test accuracy, as different studies, different patient populations, or different methods for measuring the accuracy of the test are used. Moreover, we did threshold analysis. We also used random model in the analysis of odds, and this widens the confidence interval and take the possibility of heterogeneity in its assumption.
Several studies have discussed the use of one of the imaging scoring systems in prediction of COVID-19's outcomes but no meta-analysis had compared between them in predicting COVID's outcomes. For example, Borghesi et al. and Yasin et al. discussed the use of CXR score in predicting disease severity and in hospital mortality. Similarly, Saeed et al. reported that CT score could be used in the prediction of outcomes. Lichter et al., de ALencar et al., and G Song et al. discussed the use of Lung ultrasound score in patients' stratification and as a predictor of mortality.
Nevertheless, CT has some downsides which are not encountered with lung ultrasound such as exposure to radiation, lack of assessment of hemodynamics, machine logistics and the presence of an expert reader, and moving the patients to the radiological setting for image acquisition, with a consequent increased risk of infection [64-68].
On the other hand, lung ultrasound is a much more feasible, accessible, and low-cost tool with the advantage of having no radiological hazards. Also, LUS is a reliable tool for Covid-19 because it can detect the peripheral distribution of lung infiltrates [69].
5 LIMITATIONS
The number of studies using chest X-ray as an imaging modality in prognosis was limited so we were not able to include it in all the analyses done. Also, a significant number of them were observational studies. Some heterogeneity was observed but we overcome it by running a random effect meta-analysis. Yet despite these limitations, this study provided significant information on imaging modalities and scoring systems, which are valuable for guiding the use of such scoring systems in therapeutic decision-making.
6 IMPLICATION FOR FUTURE PRACTICE
Another simple widely available tool that could be used to guide decision-making as it proved to have a prognostic value in mortality prediction is echocardiography. Markers of Right ventricle and Left ventricle dysfunction as Right ventricle fractional area change and Left ventricle ejection fraction assessed by bedside echo were found to be independent predictors of mortality in hospitalized COVID-19 patients [70]. Yet, others claim that only RV parameters are the ones associated with mortality [71]. Thus, the use of such a tool is yet to be investigated.
7 CONCLUSION
CT severity score showed a better discriminatory ability in predicting COVID-19 adverse outcomes such as in-hospital mortality, ICU admission, and need for ventilatory support compared to LUS and X-RAY scores while the LUS, being more specific, had a slightly better prognostic value.
AUTHOR CONTRIBUTIONS
Omneya kandil study design and writing and revision. Anas, Mohamed Tarek data analysis. Patrick, Omar, Demi, Elyas, Walaa, Khalil, Abdelraham screening and data extraction. Diaa and Hani manuscript revision.
ACKNOWLEDGMENTS
Financial support was not obtained from any individual, institutions, agencies, drug industries, or organizations.
CONFLICT OF INTEREST STATEMENT
The authors declare that they have no competing interests.
ETHICS STATEMENT
Not applicable.
INFORMED CONSENT
Not applicable.
Open Research
DATA AVAILABILITY STATEMENT
The datasets used and/or analyzed in this study are available from the corresponding author upon reasonable request.


